
Problem 6-7 Wayback Cleaning Co.
Probability Calculations Using the Normal Distribution – Template
Enter data only in the shaded cells
This spreadsheet is designed to calculate the probability of values equal to, or less than, a desired x value,
given the mean and standard deviation of a normally distributed variable. It uses the cumulative normal distribution
Enter the mean of the distribution in shaded cell D8 and the standard deviation in shaded cell D9. below.
Enter the desired X-value in shaded cell D10, below. The calculated z-value and probability will be seen in D11 and D12.
Mean of distribution 128.225 NORMAL PROBABILITY CALCULATIONS
Std deviation of distribution 5
Desired x-value 120 Mean of distribution 1020
Calculated z-value -1.645 Std Dev of distribution 20
Probability of x, or less 0.04998 Desired x-value 1044
Calculated z-value 1.20
(X-axis) Probability Using Prob. of x, or less 0.88493
Desired x-values Equivalent – Z Values NORMS.DIST
88.225 -8.00 0.00000 Equivalent Probability Using Desired
89.225 -7.80 0.00000 Z Values NORM.DIST x-values
90.225 -7.60 0.00000 -4.00 0.00003 940
91.225 -7.40 0.00000 -3.60 0.00016 948
92.225 -7.20 0.00000 -3.20 0.00069 956
106.225 -4.40 0.00001 2.40 0.99180 1068
107.225 -4.20 0.00001 2.80 0.99744 1076
108.225 -4.00 0.00003 3.20 0.99931 1084
109.225 -3.80 0.00007 3.60 0.99984 1092
110.225 -3.60 0.00016 4.00 0.99997 1100
111.225 -3.40 0.00034
112.225 -3.20 0.00069
113.225 -3.00 0.00135
114.225 -2.80 0.00256
115.225 -2.60 0.00466
116.225 -2.40 0.00820
117.225 -2.20 0.01390
118.225 -2.00 0.02275
119.225 -1.80 0.03593
120.225 -1.60 0.05480
121.225 -1.40 0.08076
122.225 -1.20 0.11507
123.225 -1.00 0.15866
124.225 -0.80 0.21186
125.225 -0.60 0.27425
126.225 -0.40 0.34458
127.225 -0.20 0.42074
128.225 0.00 0.50000
129.225 0.20 0.57926
130.225 0.40 0.65542
131.225 0.60 0.72575
132.225 0.80 0.78814
133.225 1.00 0.84134
134.225 1.20 0.88493
135.225 1.40 0.91924
136.225 1.60 0.94520
137.225 1.80 0.96407
138.225 2.00 0.97725
139.225 2.20 0.98610
140.225 2.40 0.99180
141.225 2.60 0.99534
142.225 2.80 0.99744
143.225 3.00 0.99865
144.225 3.20 0.99931
145.225 3.40 0.99966
146.225 3.60 0.99984
147.225 3.80 0.99993
148.225 4.00 0.99997
149.225 4.20 0.99999
150.225 4.40 0.99999
151.225 4.60 1.00000
152.225 4.80 1.00000
153.225 5.00 1.00000
154.225 5.20 1.00000
155.225 5.40 1.00000
156.225 5.60 1.00000
157.225 5.80 1.00000
158.225 6.00 1.00000
159.225 6.20 1.00000
160.225 6.40 1.00000
161.225 6.60 1.00000
162.225 6.80 1.00000
163.225 7.00 1.00000
164.225 7.20 1.00000
165.225 7.40 1.00000
166.225 7.60 1.00000
167.225 7.80 1.00000
168.225 8.00 1.00000
0.80
0.90
1.00
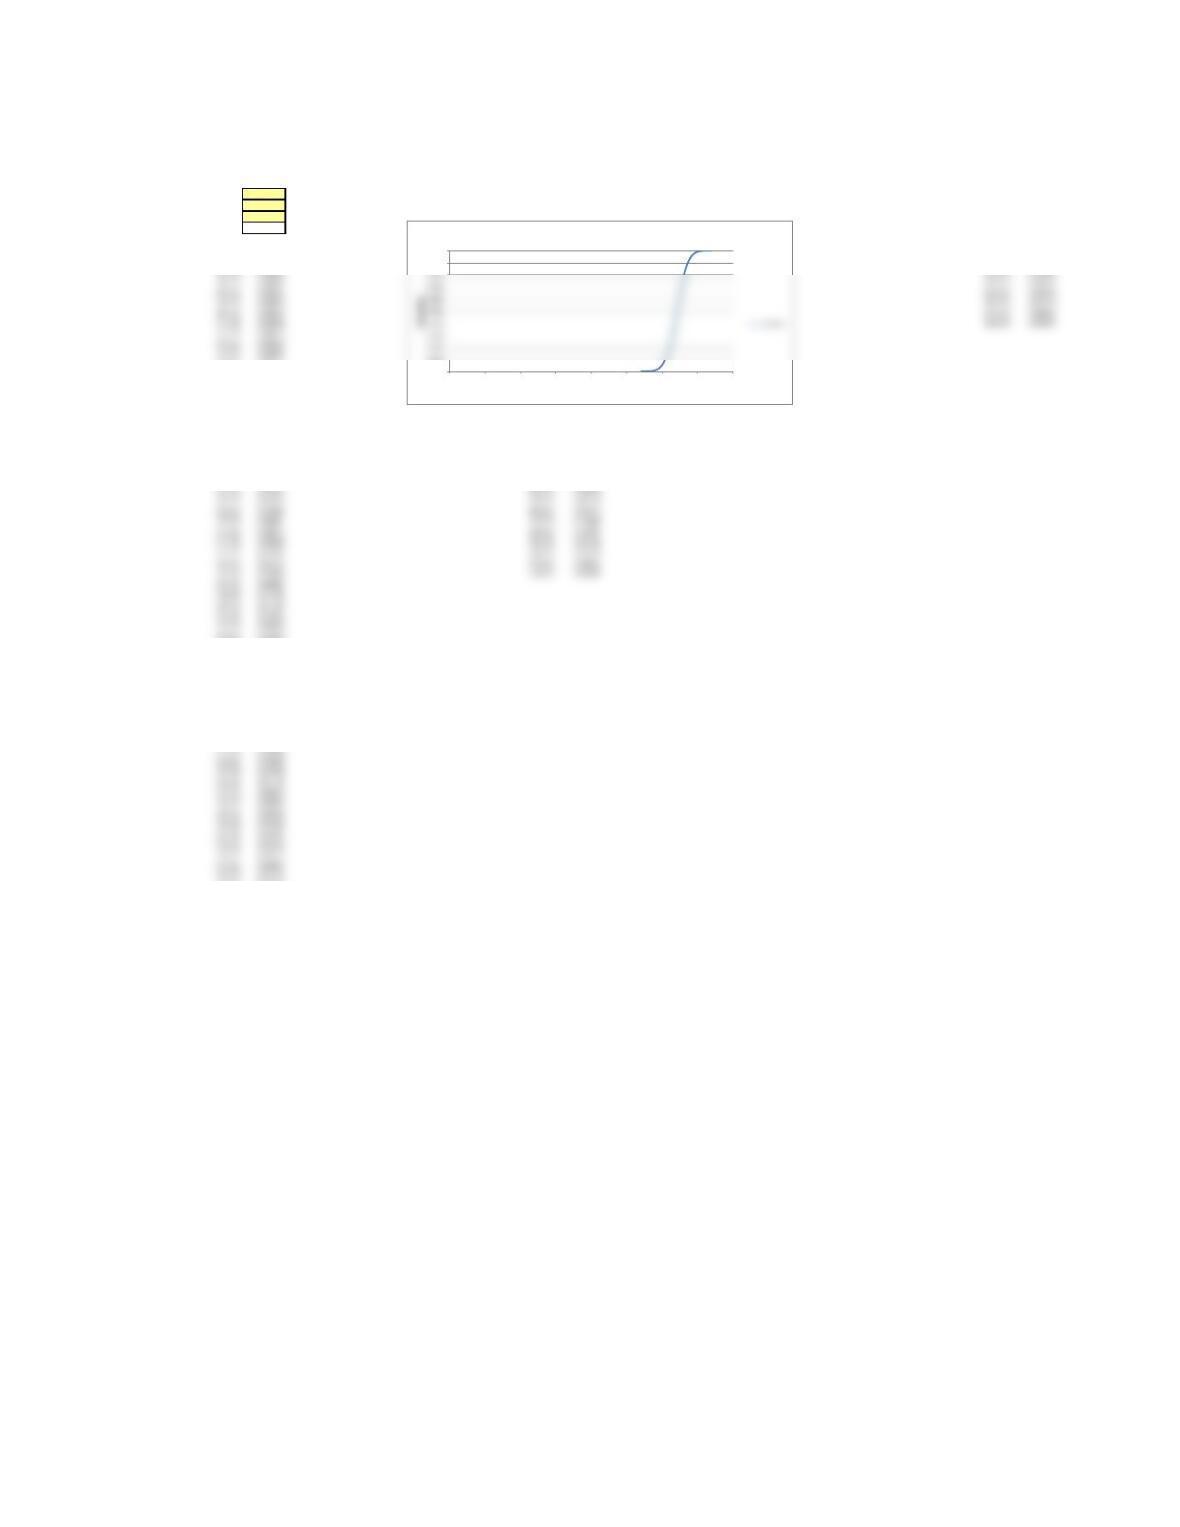
-4.0-3.8-3.6-3.4-3.2-3.0-2.8-2.6-2.4-2.2-2.0-1.8-1.6-1.4-1.2-1.0-0.8 -0.6 -0.4 -0.2 0.0 0.2 0.4 0.6 0.8 1.0 1.2 1.4 1.6 1.8 2.0 2.2 2.4 2.6 2.8 3.0 3.2 3.4 3.6 3.8 4.0
z-values
Cumulative Probability Function
NORMS.DIST
Mean of distribution 1020
Std Dev of distribution 20
Desired x-value 1044
Calculated z-value 1.20
Prob. of x, or less 0.88493
Equivalent Probability Using Desired
Z Values NORM.DIST x-values
-4.00 0.00003 940
-3.60 0.00016 948
-3.20 0.00069 956
2.40 0.99180 1068
2.80 0.99744 1076
3.20 0.99931 1084
3.60 0.99984 1092
4.00 0.99997 1100
93.225 -7.00 0.00000 -2.80 0.00256 964
94.225 -6.80 0.00000 -2.40 0.00820 972
95.225 -6.60 0.00000 -2.00 0.02275 980
96.225 -6.40 0.00000 -1.60 0.05480 988
97.225 -6.20 0.00000 -1.20 0.11507 996
100.225 -5.60 0.00000 0.00 0.50000 1020
101.225 -5.40 0.00000 0.40 0.65542 1028
102.225 -5.20 0.00000 0.80 0.78814 1036
103.225 -5.00 0.00000 1.20 0.88493 1044
104.225 -4.80 0.00000 1.60 0.94520 1052
105.225 -4.60 0.00000 2.00 0.97725 1060
-2.80 0.00256 964
-2.40 0.00820 972
-2.00 0.02275 980
-1.60 0.05480 988
-1.20 0.11507 996
0.00 0.50000 1020
0.40 0.65542 1028
0.80 0.78814 1036
1.20 0.88493 1044
1.60 0.94520 1052
Problem 6-7 Wayback Cleaning Co.
X-value Calculations Given Probabilities Using the Inverse Normal Distribution – Template
This spreadsheet is designed to calculate the X-value based on probability of values equal to, or less than a desired x value,
of a normally distributed variable. It requires input of a known mean and standard deviation and uses the inverse of the cumulative normal distribution
Enter the mean of the distribution in cell D9 and the standard deviation in cell D10, below. Enter the desired probability in cell D11, and the calculated x-value will be seen in D12.
Mean of distribution 128.225
Std Dev of distribution 5
Probability of X or less 0.05
Calculated X-Value 120.00 Calculated Given
x-values Probability
Calculated x-values Probability 113.225 0.00135
108.225 0.00003 118.225 0.02275
108.725 0.00005 123.225 0.15866
113.225 0.00135
113.725 0.00187
114.225 0.00256
114.725 0.00347
115.225 0.00466
115.725 0.00621
116.225 0.00820
116.725 0.01072
117.225 0.01390
117.725 0.01786
118.225 0.02275 Truncated
118.725 0.02872 x-values Probability
126.225 0.34458
126.725 0.38209
127.225 0.42074
127.725 0.46017
128.225 0.50000
128.725 0.53983
129.225 0.57926
129.725 0.61791
130.225 0.65542
130.725 0.69146
131.225 0.72575
138.225 0.97725
138.725 0.98214
139.225 0.98610
139.725 0.98928
140.225 0.99180
140.725 0.99379
141.225 0.99534
141.725 0.99653
142.225 0.99744
142.725 0.99813
143.225 0.99865
143.725 0.99903
144.225 0.99931
144.725 0.99952
145.225 0.99966
145.725 0.99977
146.225 0.99984
146.725 0.99989
147.225 0.99993
147.725 0.99995
148.225 0.99997
0.000
0.100
0.900
1.000
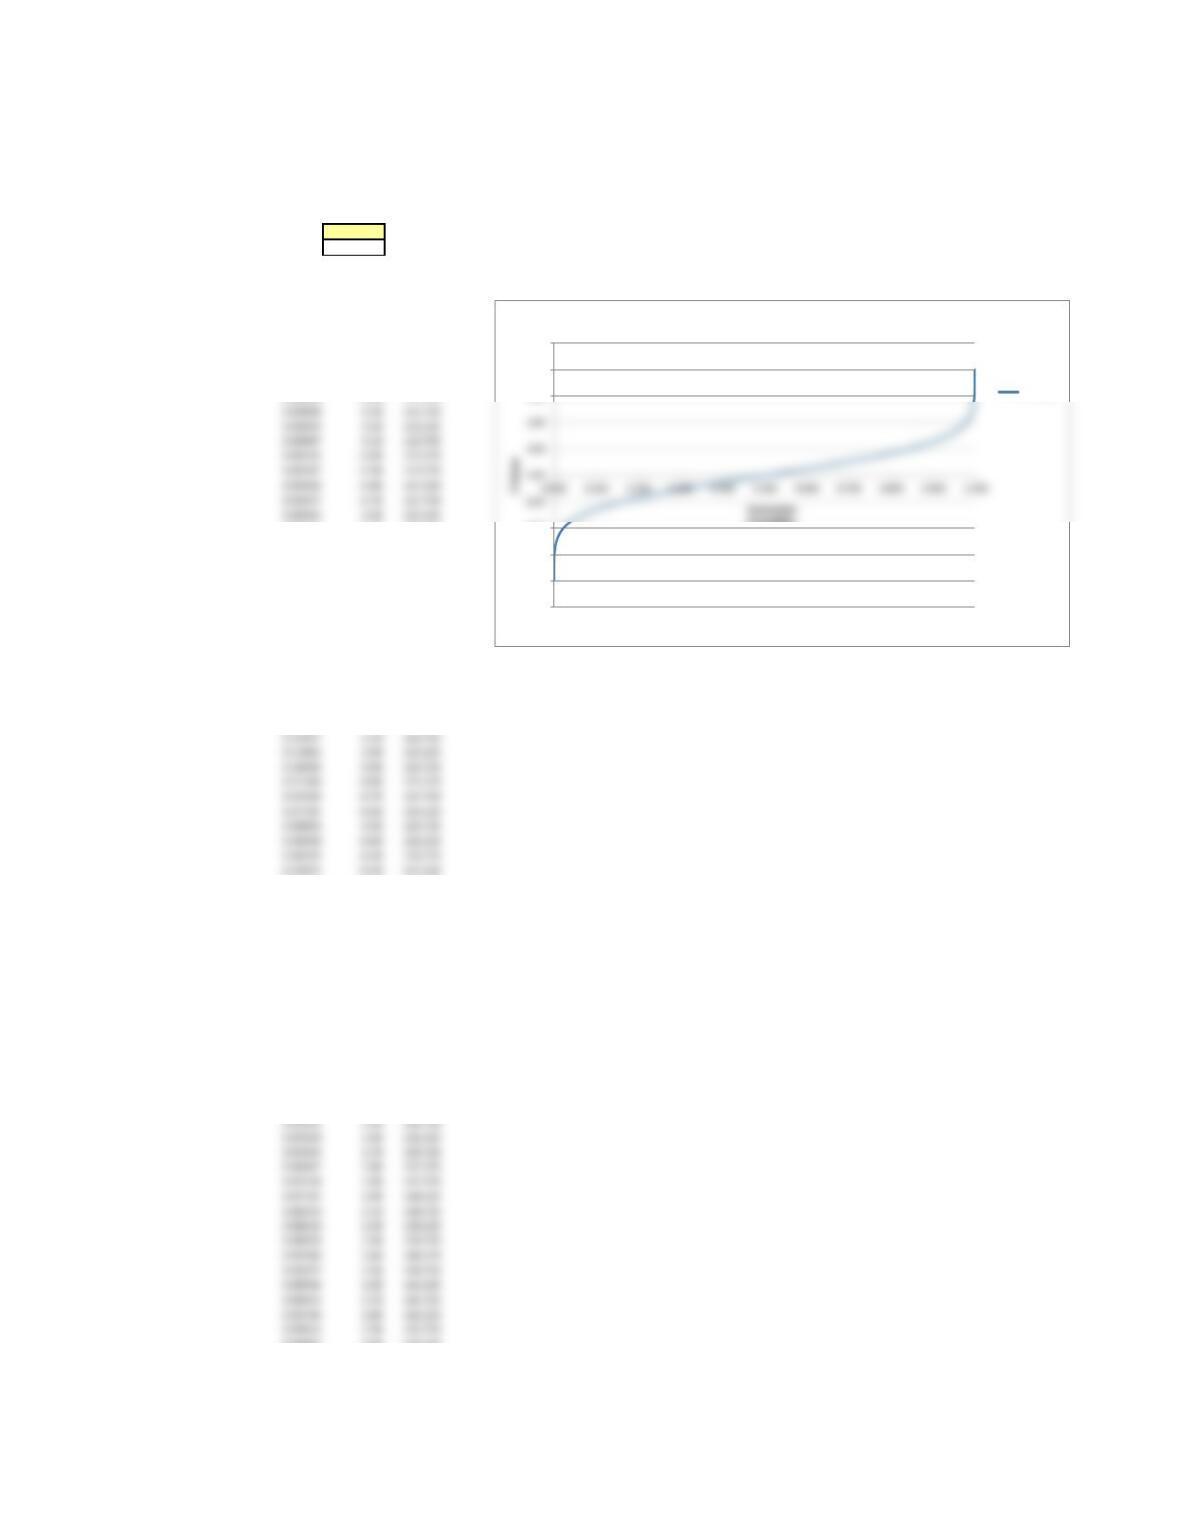
020 40 60 80 100 120 140 160
X-values
X-values vs. Cumulative Probability
Problem 6-7 Wayback Cleaning Co.
Z and X-value Calculations Given Probabilites, Using the Inverse Normal Distribution – Template
This spreadsheet is designed to calculate the z-value based on probability of values equal to, or less than,
an equivalent x-value of a normally distributed variable. It uses the inverse of the cumulative normal distribution.
Enter the desired probability of the Z-value or less in the shaded cell D9, below. The calculated z-value will be seen in cell D10.
0.05000
-1.645
Probability of x-value, or less
Calculated z-value Calculated Equivalent
Probability Z Values x-values
0.00003 -4.00 108.225
0.00005 -3.90 108.725
0.00007 -3.80 109.225
0.00011 -3.70 109.725
0.00016 -3.60 110.225
0.00023 -3.50 110.725
0.00034 -3.40 111.225
0.00621 -2.50 115.725
0.00820 -2.40 116.225
0.01072 -2.30 116.725
0.01390 -2.20 117.225
0.01786 -2.10 117.725
0.02275 -2.00 118.225
0.02872 -1.90 118.725
0.03593 -1.80 119.225
0.04457 -1.70 119.725
0.05480 -1.60 120.225
0.06681 -1.50 120.725
0.08076 -1.40 121.225
0.09680 -1.30 121.725
0.11507 -1.20 122.225
0.13567 -1.10 122.725
0.15866 -1.00 123.225
0.18406 -0.90 123.725
0.21186 -0.80 124.225
0.24196 -0.70 124.725
0.27425 -0.60 125.225
0.30854 -0.50 125.725
0.34458 -0.40 126.225
0.38209 -0.30 126.725
0.42074 -0.20 127.225
0.46017 -0.10 127.725
0.50000 0.00 128.225
0.53983 0.10 128.725
0.57926 0.20 129.225
0.61791 0.30 129.725
0.65542 0.40 130.225
0.69146 0.50 130.725
0.72575 0.60 131.225
0.75804 0.70 131.725
0.78814 0.80 132.225
0.81594 0.90 132.725
0.84134 1.00 133.225
0.86433 1.10 133.725
0.88493 1.20 134.225
0.90320 1.30 134.725
0.91924 1.40 135.225
0.93319 1.50 135.725
0.94520 1.60 136.225
0.95543 1.70 136.725
0.96407 1.80 137.225
0.97128 1.90 137.725
0.97725 2.00 138.225
0.98214 2.10 138.725
0.98610 2.20 139.225
0.98928 2.30 139.725
0.99180 2.40 140.225
0.99379 2.50 140.725
0.99534 2.60 141.225
0.99653 2.70 141.725
0.99744 2.80 142.225
0.99865 3.00 143.225
0.99903 3.10 143.725
0.99931 3.20 144.225
0.99952 3.30 144.725
0.99966 3.40 145.225
-5.00
-4.00
-3.00
-2.00
3.00
4.00
5.00
Probability
Z Values vs. Probability
Z Values
0.00048 -3.30 111.725
0.00069 -3.20 112.225
0.00097 -3.10 112.725
0.00135 -3.00 113.225
0.00187 -2.90 113.725
0.00256 -2.80 114.225
0.00347 -2.70 114.725
0.00466 -2.60 115.225