Chapter 6 – Instructor Reserve Problem Solutions
See the Excel solution files in the Instructor Reserve Materials folder for Chapter 6.
1. Receiving inspection technicians at SelCells, Inc., a cellphone retailer took a sample
of 250 incoming phones, as shown in the table found in the worksheet Prob 06-01.
a. Find the proportion of defective phones in the sample that are classified as
defective (having at least one feature that did not operate properly) by using the
Excel COUNTIF function in the Ch6BiPoisExpCntTemplate.xlsx
b. If a technician takes a random sample of only 50 phones from this population,
assuming that they follow a binomial distribution, what is the probability that: (i)
exactly 2 phones will be defective? (ii) 4 phones or fewer will be defective? (iii) 6 or
more phones will be defective? Use the binomial probability distribution formula
and verify your result using Excel Binomial spreadsheet template.
Answer
a) The 2.4 percent defective phones count is verified in the Prob01-02-
08BiPoisExpCnt.xlsx spreadsheet.
The output shows:
Answers the question: Is the cellphone defective?
b-1) The binomial distribution’s function has this form: 𝑓(𝑥)=[𝑛
𝑥](𝑝)𝑥(1−𝑝)𝑛−𝑥
To find the probability that 2 phones in a sample of 50 will be defective, we compute:
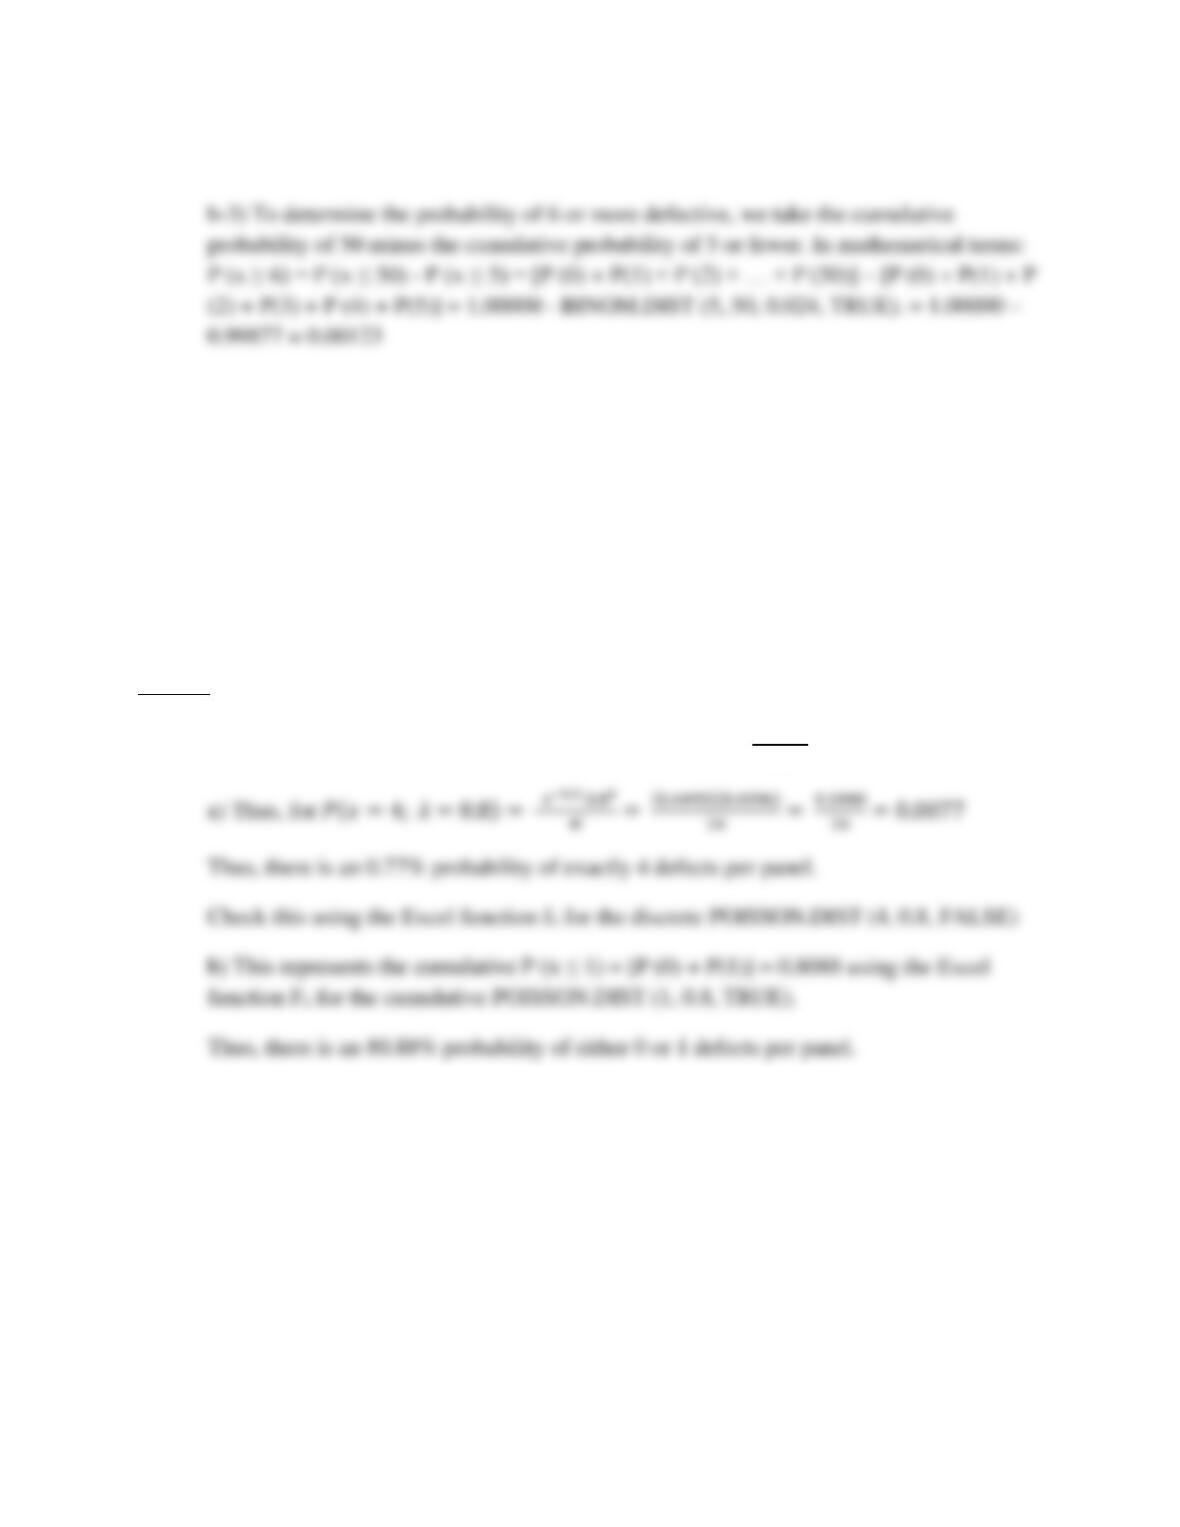
50, 0.024, TRUE) calculates the cumulative probability of 0.99312.
2. Plastic panels are made by Panlmastr Company. The average number of defects per
panel is 0.8. If these data follow a Poisson distribution, use the Poisson spreadsheet
template to answer the following questions.
a) What is the probability of finding exactly 4 defects in a plastic panel chosen at
random?
b) What is the probability of finding 1 or fewer defects in a panel?
Answer
The Poisson distribution’s function has this form: 𝑓(𝑥)= 𝒆−𝝀 𝝀𝒙
𝒙!
3. The production manager at Evansrode Marine Engines is investigating a new
process which makes a 36-inch shaft used in outboard motors. Since this is a new
process, she wants to get descriptive statistics that can be used in later studies to
determine the capability of the process to perform within specification limits. 100
shafts taken from the process were measured. Determine the mean, median, mode,
variance, standard deviation, skewness and kurtosis, etc. of distribution for the
process, based on based on the Data Analysis add-ins in Excel. Plot a histogram of
the process samples. What conclusions can you draw from the analysis of the data?
Answer
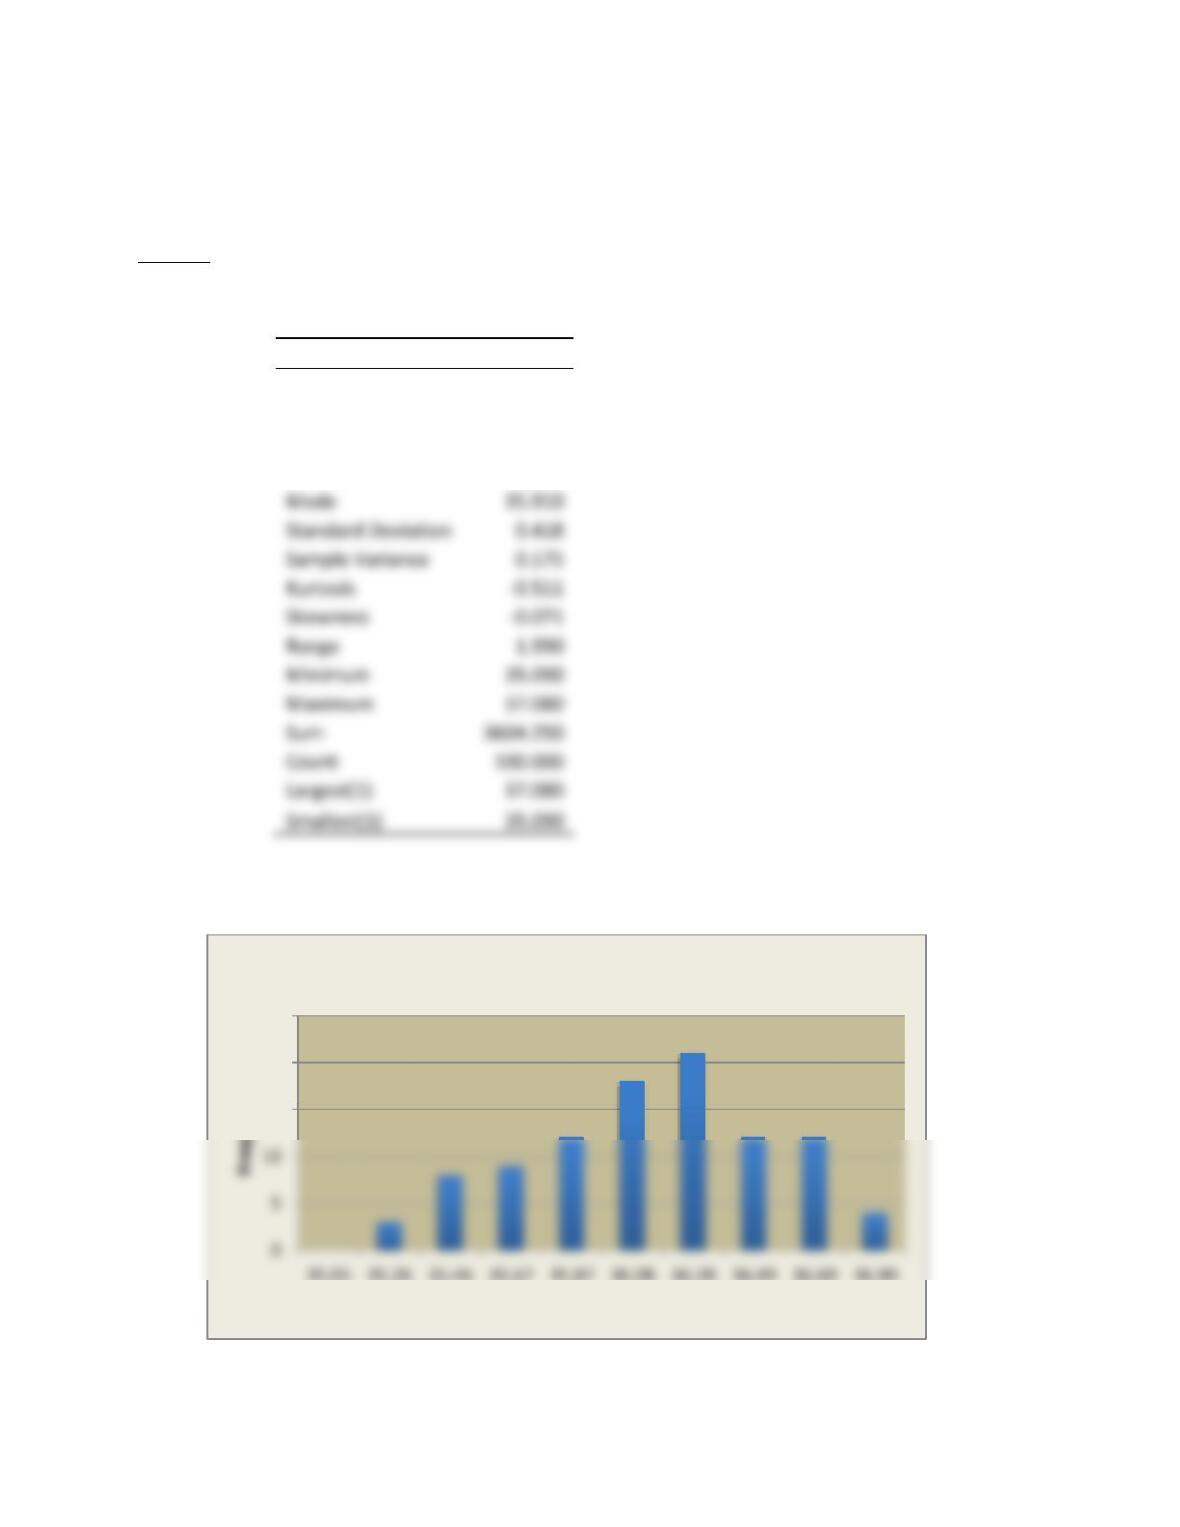
Descriptive Statistics from the Excel Add-In are as follows:
Descriptive Statistics
Mean
36.043
Standard Error
0.042
Median
36.085
15
20
25
35.05 35.26 35.46 35.67 35.87 36.08 36.28 36.49 36.69 36.90
Cell Upper Limit
Histogram
Mode
35.910
Standard Deviation
0.418
Sample Variance
0.175
Kurtosis
Skewness
Range
1.990
Minimum
35.090
Maximum
37.080
3604.250
Count
Largest(1)
37.080
Smallest(1)
35.090
Analysis of the data reveal a mean of 36.04, and a standard deviation of 0.418, which is
rather large. The range of 1.99 inches is definitely excessive. There is pronounced
4. A manufacturer of a printer determines that the mean number of days before a
cartridge runs out of ink is 75 days, with a standard deviation of 6 days. Assuming a
normal distribution, what is the probability that the number of days will be less
than 67.5 days? More than 88?
Answer
a) For the printer manufacturer, the mean number of days before a cartridge runs out of
ink, µ = 75 days; and the standard deviation, = 6 days. For x = 67.5:
z = 𝑥− 𝜇
𝜎
z = 67.5− 75
6 = – 1.25
b) For z = 𝑥− 𝜇
𝜎
z = 88− 75
6 = 2.17
5. Tio Anciano tequila is sold in 1 liter (1000 milliliter) bottles. The standard deviation
for the filling process is 10 milliliters. If the process requires a 2 percent, or smaller,
probability of over-filling, defined as over 990 milliliters, what must the target mean
for the process be?
Answer
For Tio Anciano tequila bottling process, the values for the 2 % cutoff and the standard
deviation are:
x = 990 ml; = 10 ml
For a total probability of 2% for overfilling:
6. The mean filling weight of salt containers processed by the Piedra Salt Co. is 15.5
ounces. If 1 percent of the containers contain more than 16 ounces, what is the
standard deviation of the filling weight of the containers?
Answer
Given that the process mean filling weight is µ = 15.5 oz. for the Piedra salt containers,
By looking up 1.0000-0.01 = 0.99, using the NormalINVTemplate.xlsx from the Ch.6-
Templates folder, or Appendix A in the text, we find:
7. Cheez-D-Lite snack cracker boxes have been found to have a standard deviation of
10 grams and a mean of 412 grams. How many grams should be specified to ensure
that 95 percent of the boxes will contain more than this weight?
Answer
Given that the standard deviation for Cheez-D-Lite snack crackers, is = 10., µ = 412,
and P (z > x) = 0.95, and using the NormalINVTemplate.xlsx from the Ch.6-Templates
folder, or Appendix A in the text, we find that:
z = – 1.645 for x > 0.95
8. SelCells, Inc., the cellphone retailer mentioned in problem 1, above, uses a large
number of common batteries in one of its most popular lines of phones. After testing
a large number of them, they found that the average time to failure is 1/
= 7800
hours.
a) What is the probability that a component will fail within 1000 hours? After 7800
hours?
Answer
The mean rate of failure is
= 1/7800 = 0.000128 failures/hour. Therefore, the
probability of failure within 1000 hours is approximately 0.128. Using the exponential
9. The quality manager at Bestiful Company is certifying a new process that must
produce 95% (or better) good product before the process is considered proven. A
sample of 40 containers from the process line are tested, and 93% are found to be
good. Formulate the appropriate hypotheses and test them using an α = 0.01
significance level. Explain your results.
Answer
The hypothesis which requires testing is:
H0: Proportion of good product ≥ 95%
H1: Proportion of good product < 95%
10. Qualiparts, a supplier of parts to the auto industry, wants to test to determine if the
strength of wire used to make alternators is significantly higher for any of four
potential subcontractors. The four subcontractors agreed to submit sample
information from 10 samples, using a standardized test provided by Qualiparts, as
provided in the data in the worksheet Prob 06-10. Use the single factor ANOVA
Excel tool to determine if there is a significant difference between the strength
scores of the four contractors at the 5 percent level.
Answer
The null hypothesis is: H0: µ1 = µ2 = µ3 = µ4 versus
The alternative hypothesis: H1: Not all µ1 = µ2 = µ3 = µ4
The ANOVA results from the Excel Data Analysis menu are as shown in the table,
below. See spreadsheet Prob06-10InsRsv.xlsx for details, while using the standardized
test data provided by Qualiparts, as found in the C06-DataInsRsv Excel workbook for
Prob06-10.
11. Durrarub, Inc. makes rubber doors sealing accessories for industrial uses. The
company wants to test how closely the hardness of their door sealing products is
correlated with temperature. It is known that the higher the temperature, the lower
the hardness, beginning at around 35˚ C. (95˚ F.) and up. Using a standardized test
provided by Durrarub, as shown in the shown in the worksheet Prob. 06-11. Use the
Excel correlation and the Regression tool to determine the regression equation and
the R2 value. Explain the output. If the oven is increased to 60˚ C, what would you
predict that the hardness measure will be?
Answer
From the table below, we can see that the regression equation is: Y = 127.350 – 0.694 X,
where X is the independent variable, temperature.
12. RocketSci uses two main ingredients to make rocket fuel used to power rocket
engines for space missions. They are ammonium perchlorate powder (the oxidizer),
and fine aluminum powder (the fuel), held together by a binder of petroleum based
rubber with the acronyms PBAN or HTPB. The company wishes to test the fuel
mixtures in a prototype engine (treatments) with a high and a low level of
ammonium perchlorate and a high and low level of aluminum powder. RocketSci
wishes to set up a 2 X 2 experimental design to determine which is the ideal
combination of high and low ingredients to produce the maximum thrust level. Use
the thrust data in the worksheet Prob. 06-12 to interpret the results and make a
recommendation to management.
Answer
As can be seen, from the spreadsheet Prob06-12-InsRsv.xlsx results, summarized below,
Factor 1 (the aluminum perchlorate ingredient) has the greatest impact on thrust. This