Problem 6-5 Los Alamos Green Tea
Probability Calculations Using the Normal Distribution – Template
Enter data only in the shaded cells
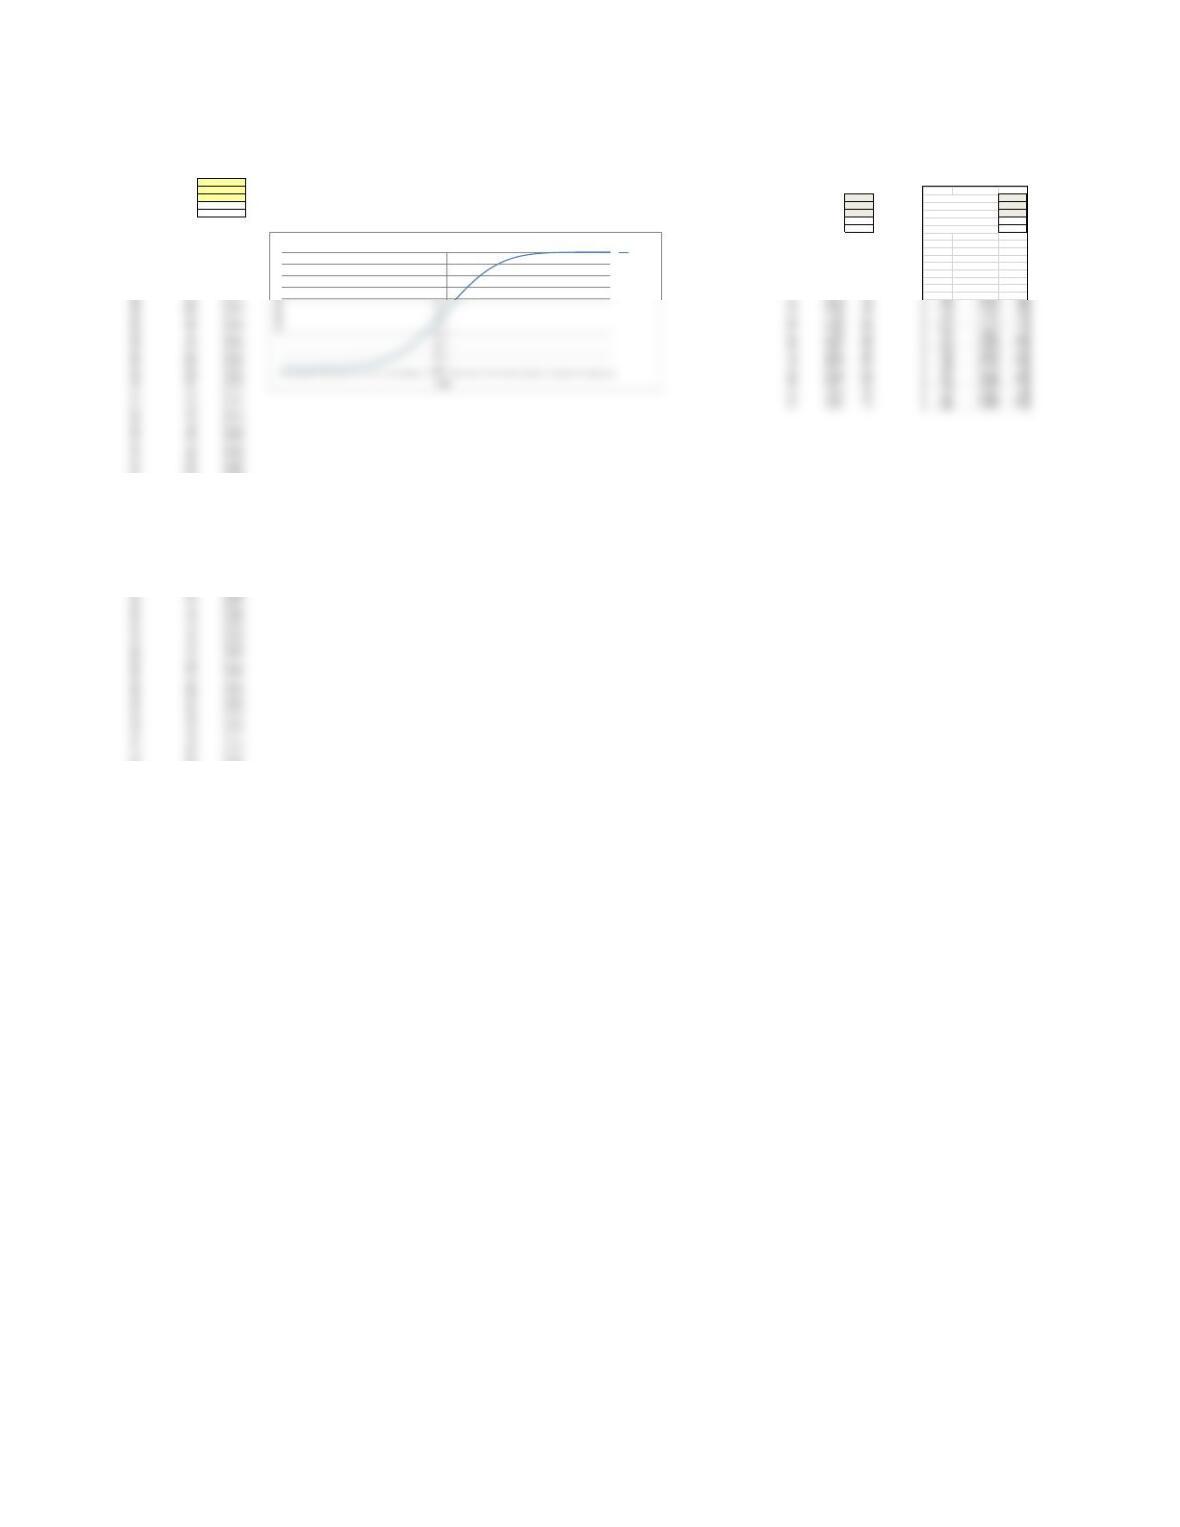
This spreadsheet is designed to calculate the probability of values equal to, or less than, a desired x value,
given the mean and standard deviation of a normally distributed variable. It uses the cumulative normal distribution
Enter the mean of the distribution in shaded cell D8 and the standard deviation in shaded cell D9. below.
Enter the desired X-value in shaded cell D10, below. The calculated z-value and probability will be seen in D11 and D12.
Mean of distribution 463.69 NORMAL PROBABILITY CALCULATIONS
Std deviation of distribution 7
Desired x-value 480 Mean of distribution 1020
Calculated z-value 2.33 Std Dev of distribution 20
Probability of x, or less 0.99010 Desired x-value 1044
Calculated z-value 1.20
(X-axis) Probability Using Prob. of x, or less 0.88493
Desired x-values Equivalent – Z Values NORMS.DIST
385 -11.24 0.00000 Equivalent Probability Using Desired
387 -10.96 0.00000 Z Values NORM.DIST x-values
389 -10.67 0.00000 -4.00 0.00003 940
391 -10.38 0.00000 -3.60 0.00016 948
393 -10.10 0.00000 -3.20 0.00069 956
395 -9.81 0.00000 -2.80 0.00256 964
397 -9.53 0.00000 -2.40 0.00820 972
399 -9.24 0.00000 -2.00 0.02275 980
447 -2.38 0.00856
449 -2.10 0.01793
451 -1.81 0.03493
453 -1.53 0.06336
455 -1.24 0.10722
457 -0.96 0.16961
459 -0.67 0.25143
461 -0.38 0.35038
463 -0.10 0.46074
465 0.19 0.57423
467 0.47 0.68184
469 0.76 0.77595
471 1.04 0.85182
473 1.33 0.90824
475 1.62 0.94692
477 1.90 0.97138
479 2.19 0.98563
481 2.47 0.99330
483 2.76 0.99710
485 3.04 0.99883
487 3.33 0.99957
489 3.62 0.99985
491 3.90 0.99995
493 4.19 0.99999
495 4.47 1.00000
497 4.76 1.00000
499 5.04 1.00000
501 5.33 1.00000
503 5.62 1.00000
505 5.90 1.00000
507 6.19 1.00000
509 6.47 1.00000
511 6.76 1.00000
513 7.04 1.00000
515 7.33 1.00000
517 7.62 1.00000
519 7.90 1.00000
521 8.19 1.00000
523 8.47 1.00000
525 8.76 1.00000
527 9.04 1.00000
529 9.33 1.00000
531 9.62 1.00000
533 9.90 1.00000
535 10.19 1.00000
537 10.47 1.00000
539 10.76 1.00000
541 11.04 1.00000
543 11.33 1.00000
545 11.62 1.00000
0.70
0.80
0.90
1.00
Cumulative Probability Function
NORMS.DIST
Mean of distribution 1020
Std Dev of distribution 20
Desired x-value 1044
Calculated z-value 1.20
Prob. of x, or less 0.88493
Equivalent Probability Using Desired
Z Values NORM.DIST x-values
-4.00 0.00003 940
-3.60 0.00016 948
-3.20 0.00069 956
-2.80 0.00256 964
-2.40 0.00820 972
-2.00 0.02275 980
401 -8.96 0.00000 -1.60 0.05480 988
403 -8.67 0.00000 -1.20 0.11507 996
405 -8.38 0.00000 -0.80 0.21186 1004
407 -8.10 0.00000 -0.40 0.34458 1012
409 -7.81 0.00000 0.00 0.50000 1020
411 -7.53 0.00000 0.40 0.65542 1028
413 -7.24 0.00000 0.80 0.78814 1036
415 -6.96 0.00000 1.20 0.88493 1044
417 -6.67 0.00000 1.60 0.94520 1052
419 -6.38 0.00000 2.00 0.97725 1060
421 -6.10 0.00000 2.40 0.99180 1068
423 -5.81 0.00000 2.80 0.99744 1076
425 -5.53 0.00000 3.20 0.99931 1084
427 -5.24 0.00000 3.60 0.99984 1092
429 -4.96 0.00000 4.00 0.99997 1100
431 -4.67 0.00000
433 -4.38 0.00001
435 -4.10 0.00002
437 -3.81 0.00007
439 -3.53 0.00021
441 -3.24 0.00059
443 -2.96 0.00156
445 -2.67 0.00379
Problem 6-5 Los Alamos Green Tea
X-value Calculations Given Probabilities Using the Inverse Normal Distribution – Template
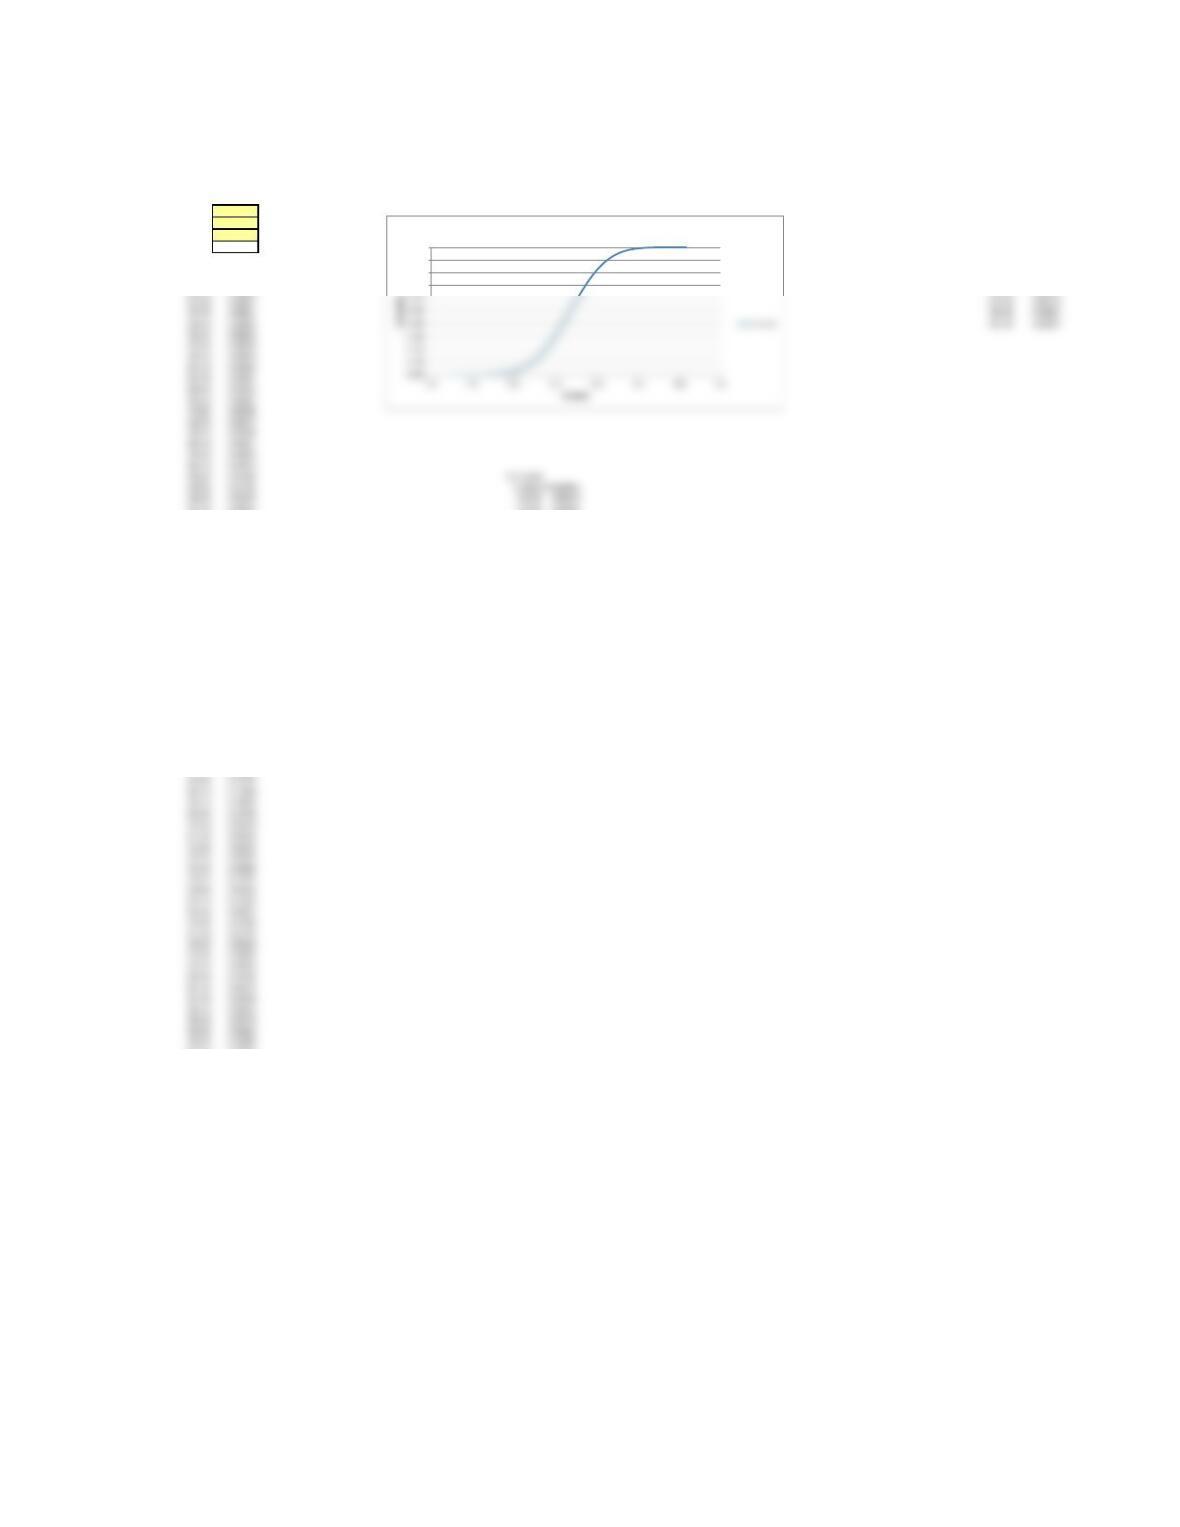
This spreadsheet is designed to calculate the X-value based on probability of values equal to, or less than a desired x value,
of a normally distributed variable. It requires input of a known mean and standard deviation and uses the inverse of the cumulative normal distribution
Enter the mean of the distribution in cell D8 and the standard deviation in cell D9, below.
Enter the desired probability in cell D10, and the calculated x-value will be seen in D11.
Mean of distribution 463.69
Std Dev of distribution 7Calculated Given
Probability of X or less 0.99 x-values Probability
Calculated X-Value 479.97 442.69 0.00135
449.69 0.02275
Calculated x-values Probability 456.69 0.15866
435.69 0.00003 463.69 0.50000
436.39 0.00005 470.69 0.84134
450.39 0.02872 442.69 0.00135
451.09 0.03593 449.69 0.02275
451.79 0.04457 456.69 0.15866
452.49 0.05480 463.69 0.50000
453.19 0.06681 470.69 0.84134
453.89 0.08076 470.69 0.84134
454.59 0.09680 484.69 0.99865
455.29 0.11507 491.69 0.99997
455.99 0.13567
456.69 0.15866
457.39 0.18406
458.09 0.21186
458.79 0.24196
459.49 0.27425
460.19 0.30854
460.89 0.34458
461.59 0.38209
462.29 0.42074
462.99 0.46017
463.69 0.50000
464.39 0.53983
465.09 0.57926
465.79 0.61791
466.49 0.65542
467.19 0.69146
485.39 0.99903
486.09 0.99931
486.79 0.99952
487.49 0.99966
488.19 0.99977
488.89 0.99984
489.59 0.99989
490.29 0.99993
490.99 0.99995
491.69 0.99997
0.700
0.800
0.900
1.000
X-values vs. Cumulative Probability
Problem 6-4 Los Alamos Green Tea
Z and X-value Calculations Given Probabilites, Using the Inverse Normal Distribution – Template
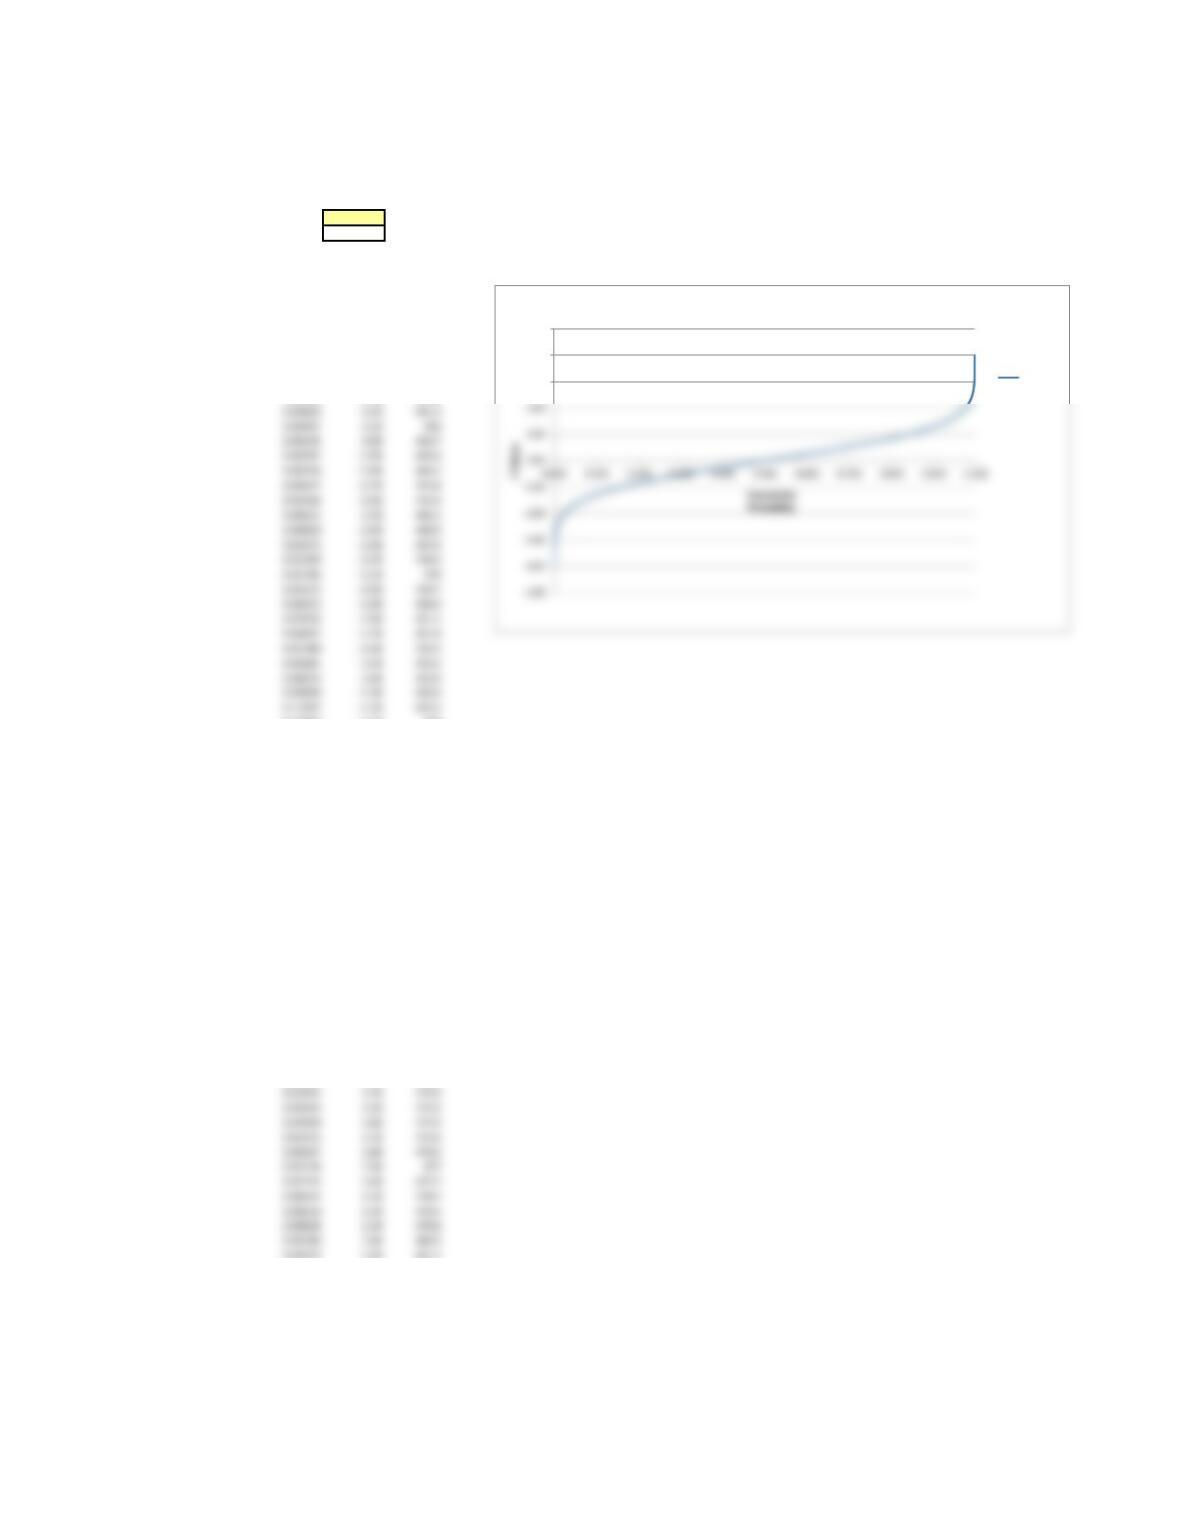
This spreadsheet is designed to calculate the z-value based on probability of values equal to, or less than,
an equivalent x-value of a normally distributed variable. It uses the inverse of the cumulative normal distribution.
Enter the desired probability of the Z-value or less in the shaded cell D8, below.
The calculated z-value will be seen in cell D9. 0.99000
2.33
Probability of x-value, or less
Calculated z-value Calculated Equivalent
Probability Z Values x-values
0.00003 -4.00 435.7
0.00005 -3.90 436.4
0.00007 -3.80 437.1
0.00011 -3.70 437.8
0.00016 -3.60 438.5
0.00023 -3.50 439.2
0.00034 -3.40 439.9
0.00048 -3.30 440.6
0.13567 -1.10 456
0.15866 -1.00 456.7
0.18406 -0.90 457.4
0.21186 -0.80 458.1
0.24196 -0.70 458.8
0.27425 -0.60 459.5
0.30854 -0.50 460.2
0.34458 -0.40 460.9
0.38209 -0.30 461.6
0.42074 -0.20 462.3
0.46017 -0.10 463
0.50000 0.00 463.7
0.53983 0.10 464.4
0.57926 0.20 465.1
0.61791 0.30 465.8
0.65542 0.40 466.5
0.69146 0.50 467.2
0.72575 0.60 467.9
0.75804 0.70 468.6
0.78814 0.80 469.3
0.81594 0.90 470
0.84134 1.00 470.7
0.86433 1.10 471.4
0.88493 1.20 472.1
0.90320 1.30 472.8
0.91924 1.40 473.5
0.93319 1.50 474.2
0.94520 1.60 474.9
0.95543 1.70 475.6
0.96407 1.80 476.3
0.97128 1.90 477
0.97725 2.00 477.7
0.98214 2.10 478.4
0.98610 2.20 479.1
0.98928 2.30 479.8
0.99180 2.40 480.5
0.99379 2.50 481.2
0.99534 2.60 481.9
0.99653 2.70 482.6
0.99744 2.80 483.3
0.99813 2.90 484
0.99865 3.00 484.7
0.99903 3.10 485.4
0.99931 3.20 486.1
0.99952 3.30 486.8
0.99966 3.40 487.5
0.99977 3.50 488.2
3.00
4.00
5.00
Z Values vs. Probability
Z Values
0.00069 -3.20 441.3
0.00097 -3.10 442
0.00135 -3.00 442.7
0.00187 -2.90 443.4
0.00256 -2.80 444.1
0.00347 -2.70 444.8
0.00466 -2.60 445.5
0.00621 -2.50 446.2
0.00820 -2.40 446.9
0.01072 -2.30 447.6
0.01390 -2.20 448.3
0.01786 -2.10 449
0.02275 -2.00 449.7
0.02872 -1.90 450.4
0.03593 -1.80 451.1
0.04457 -1.70 451.8
0.05480 -1.60 452.5
0.06681 -1.50 453.2
0.08076 -1.40 453.9
0.09680 -1.30 454.6
0.11507 -1.20 455.3

0.99984 3.60 488.9
0.99989 3.70 489.6
0.99993 3.80 490.3
0.99997 4.00 491.7