Problem 6-8-Instructor Reserve
SelCells, Inc.
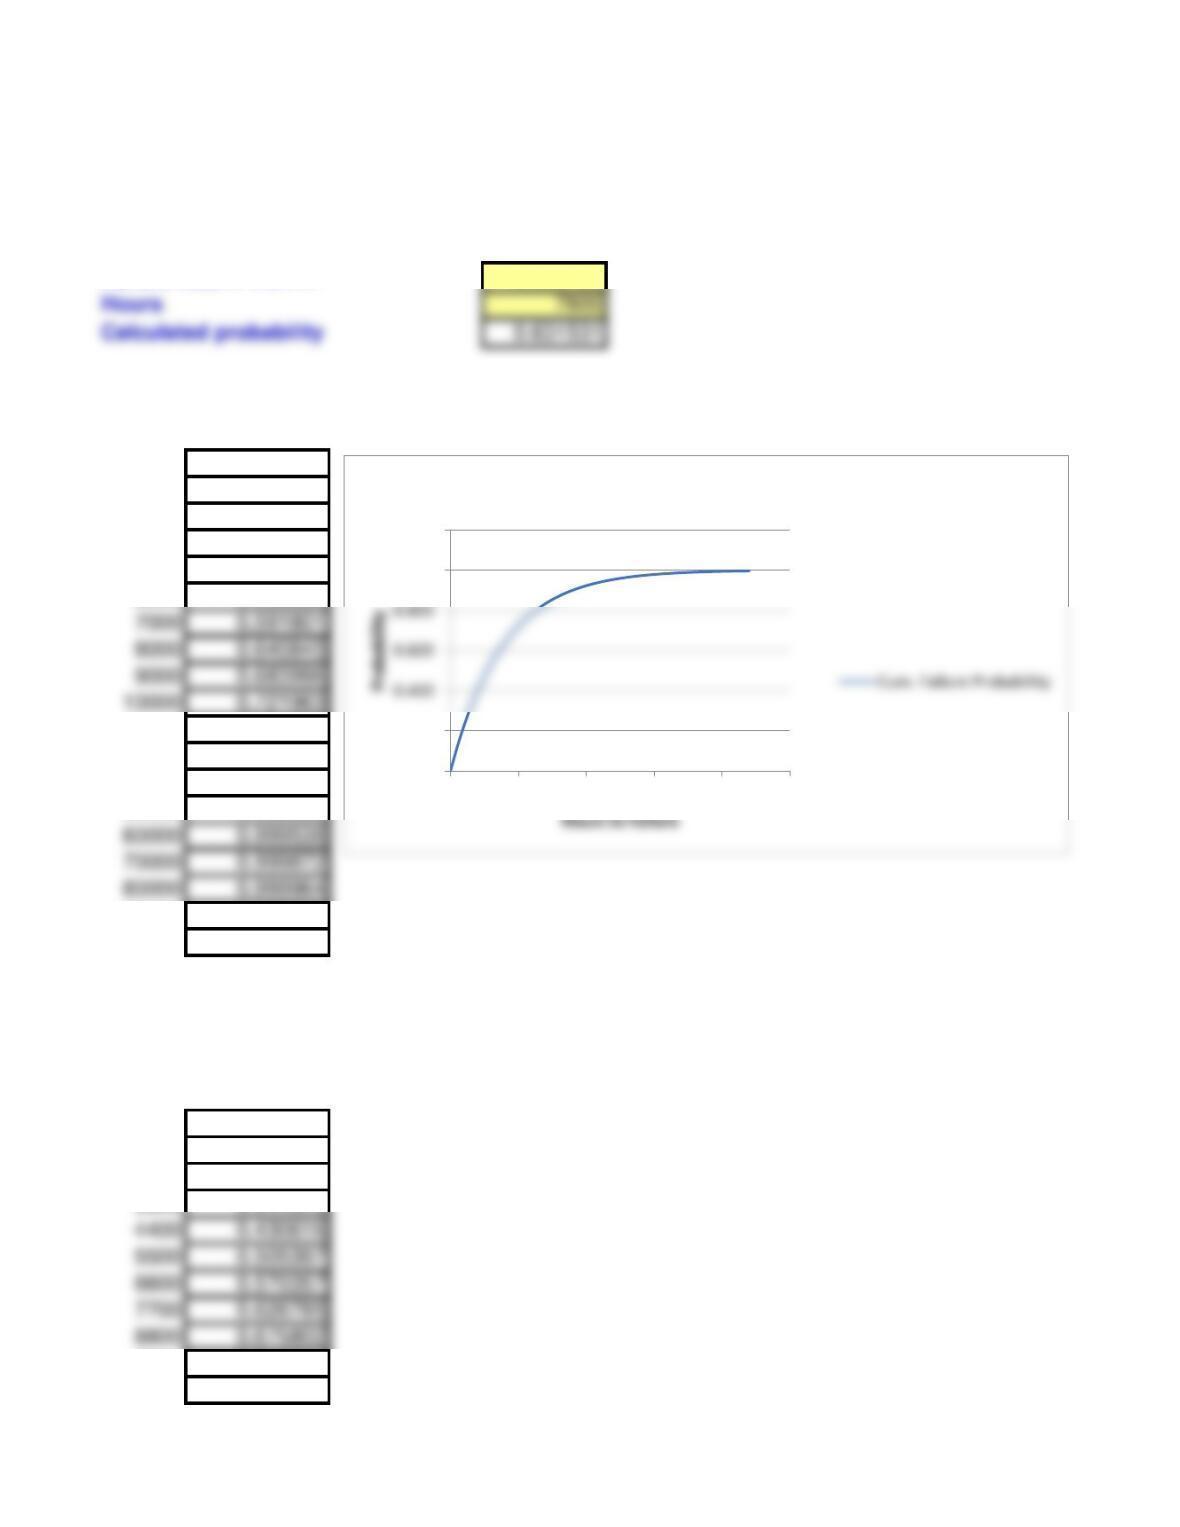
Exponential Probability Distribution
Enter data only in yellow-shaded cells.
Failure Rate = 1/MTTF 0.000128
T = x Cum. Failure
Hours
Probability F(x)
1000 0.120147
2000 0.225858
3000 0.318869
4000 0.400704
5000 0.472708
6000 0.536060
20000 0.922695
30000 0.978506
40000 0.994024
50000 0.998338
90000 0.999990
100000 0.999997
Table for chart construction
T = x Cum. Failure
Hours Probability
0 0.000000
1100 0.131337
2200 0.245425
3300 0.344528
9900 0.718381
11000 0.755368
0.000
0.200
1.000
1.200
0 10000 20000 30000 40000 50000
Cumulative Failure Probability
12100 0.787497
13200 0.815407
14300 0.839651
15400 0.860710
16500 0.879004
17600 0.894895
18700 0.908700
19800 0.920691
20900 0.931107
22000 0.940155
23100 0.948015
31900 0.983147
33000 0.985360
34100 0.987283
35200 0.988953
36300 0.990404
37400 0.991664
38500 0.992759