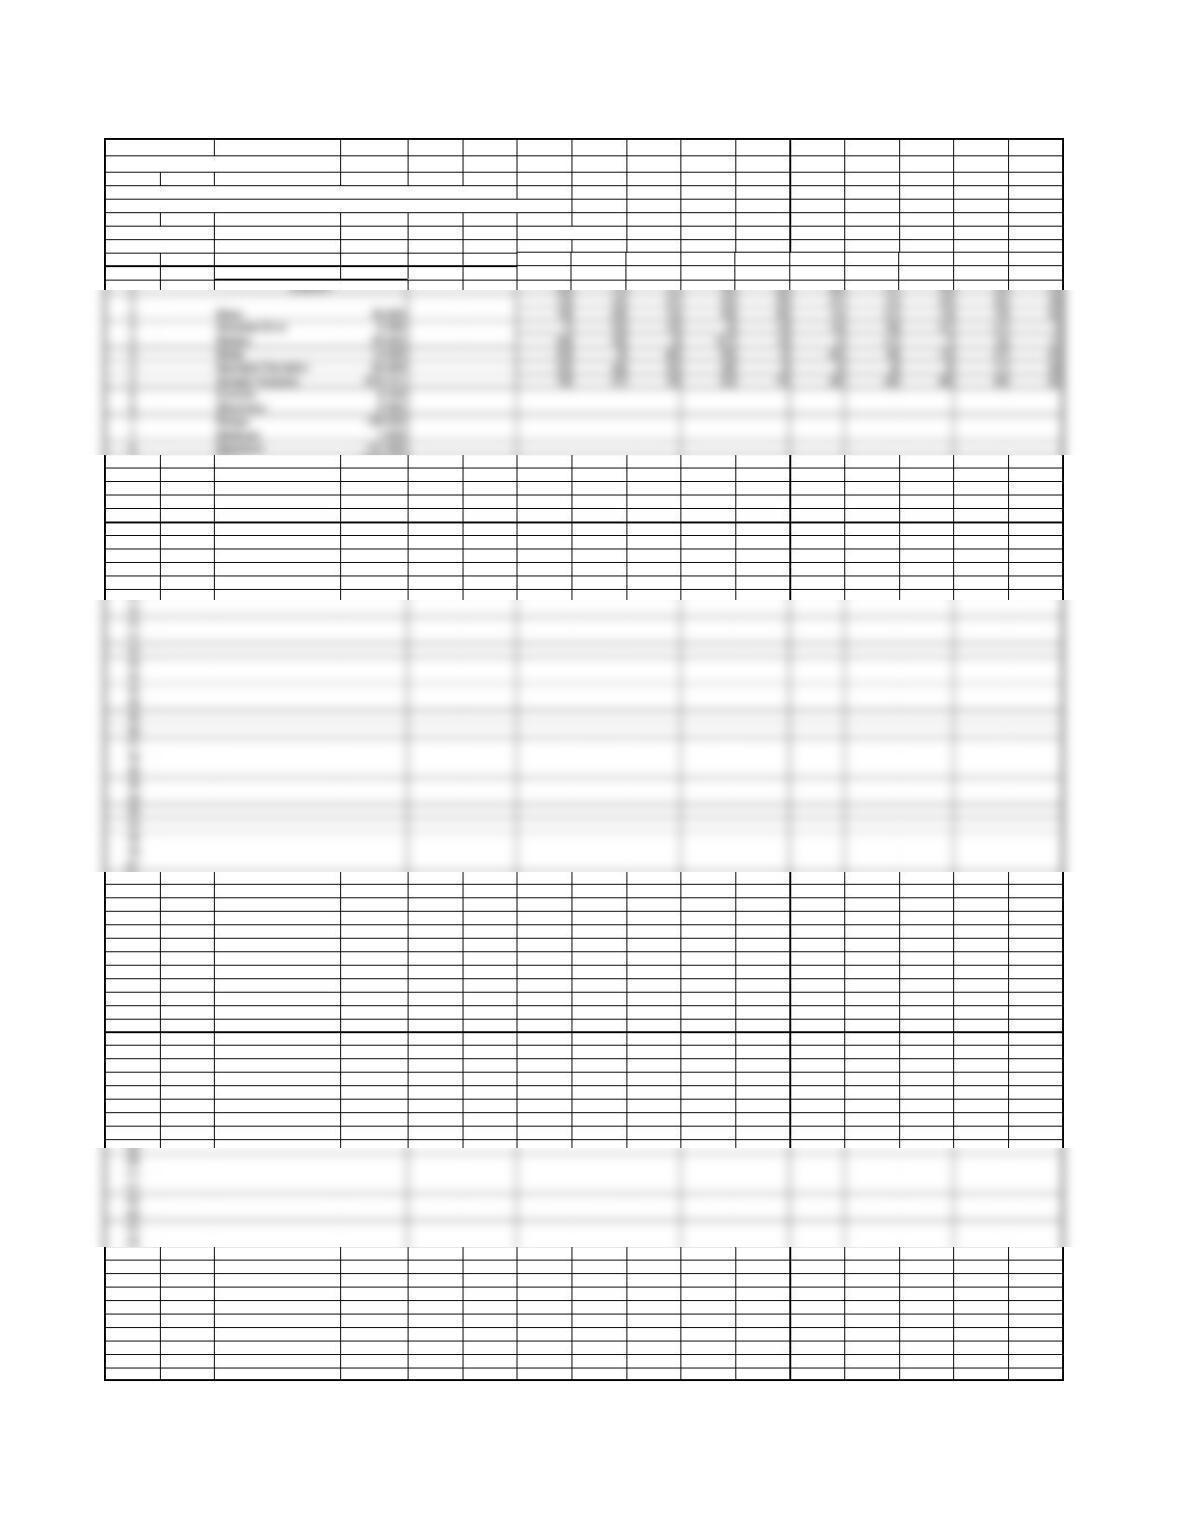
P6-11 Statistics
Problem 6-11
Twenty First Century Laundry
Summary Statistics Using Excel Data Analysis Tool – “Descriptive Statistics”
Note that the data must be put into a unidimensional array in order to run the summary statistics
Summary Data in Original Data
Ascending Order
69 3 1 72 93 380 6 5 36
142 264 44 15 77 49 85 82 102
8 Sum 3292.000
9 Count 100.000
9 Largest(1) 107.000
9 Smallest(1) 1.000
11 Confidence Level(95.0%) 5.139
12
12
13
13
13
14
14
14
14
14
15
15
15
16
16
16
17
18
18
18
19
19
19
19
19
21
21
21
23
25
25
26
27
27
28
29
30
30
31
31
32
34
35
35
36
38
39
39
41
41
42
42
44
45
45
49
49
49
49
52
53
53
55
58
Page 1
3 Median 25.500 94 19 6107 19 241 715 15
6 Kurtosis 0.233
6 Skewness 0.994
7 Range 106.000
7 Minimum 1.000
8 Maximum 107.000
P6-11 Statistics
59
62
94
102
107
Page 2
64
64
69
70
72
74
77
80
82
85
90
93
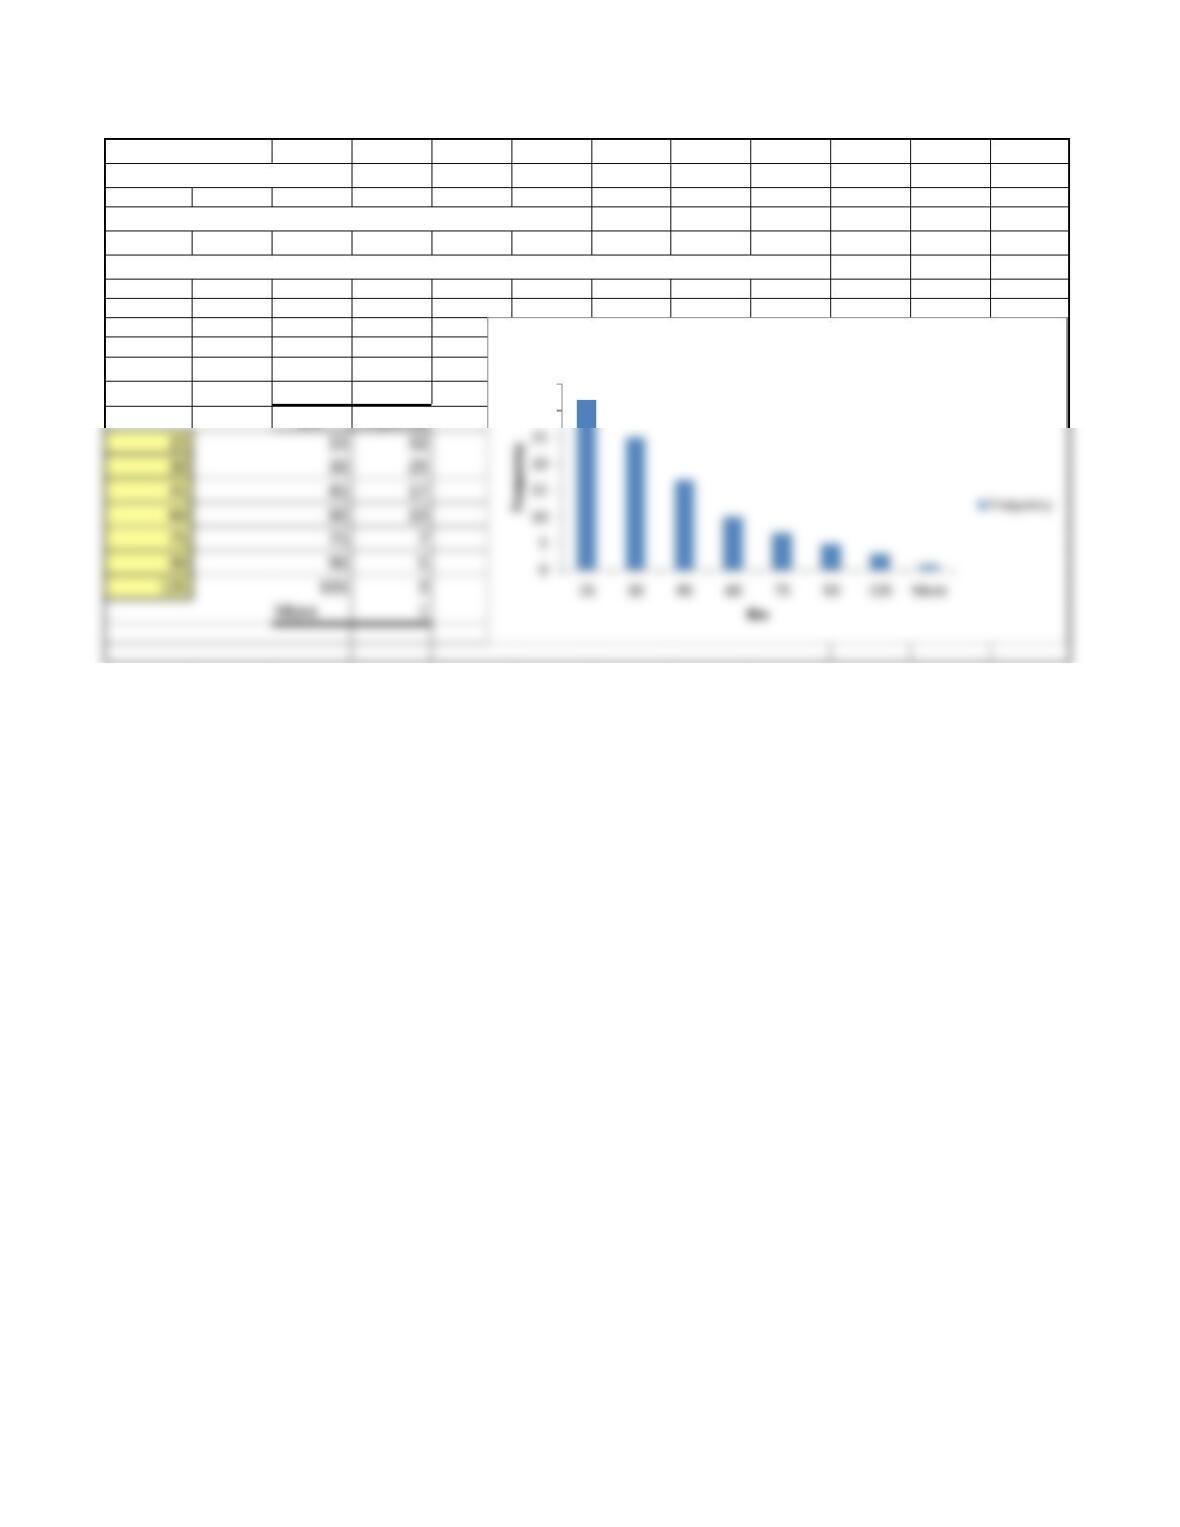
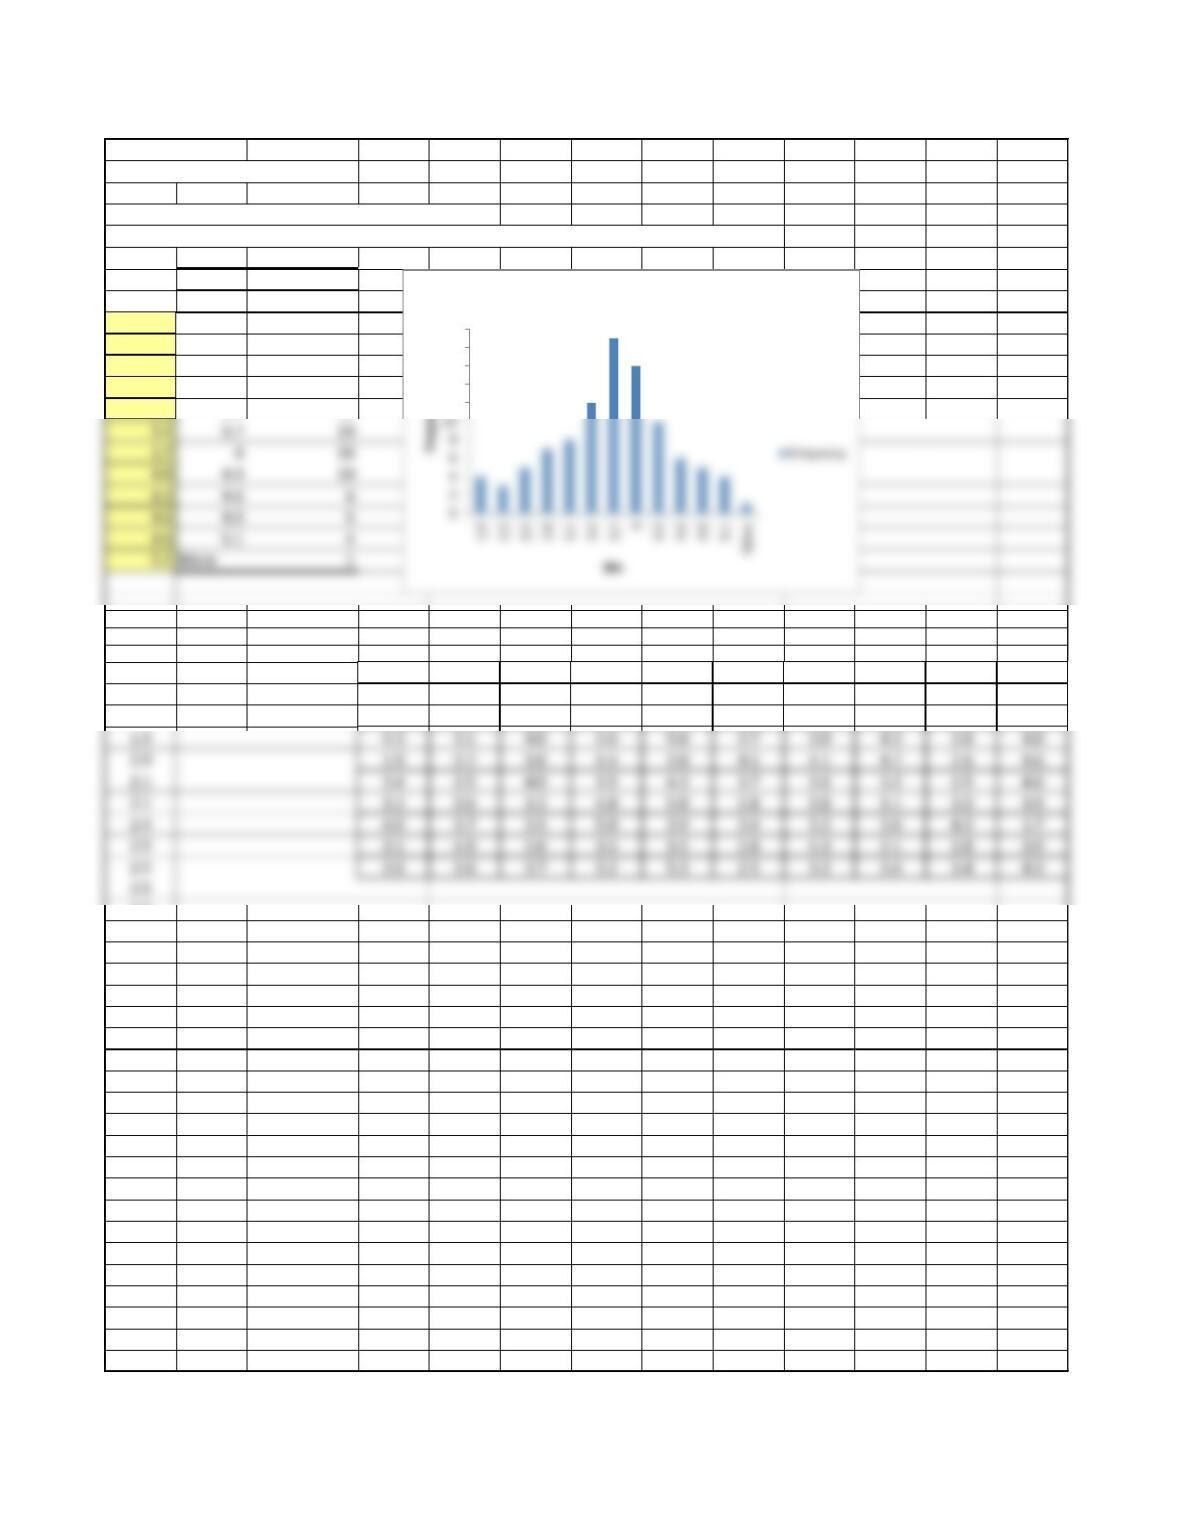
P6-11 Histogram
Problem 6-11
Twenty First Century Laundry
Histogram Using Excel Data Analysis Tool – “Histogram”
Note that bin data must be input into the Histogram module before analysis can proceed.
Input Bin
Data here
Bin
Frequency
30
35
Histogram
Page 3
Prob 6-12 Statistics
Blood Tests at Rivervalley Labs
Problem 6-12
Summary Statistics Using Excel Data Analysis Tool – “Descriptive Statistics”
Note that the data must be put into a unidimensional array in order to run the summary statistics
Summary Data in Original Data
Ascending Order
2.5 3.9 3.8 4.9 3.6 3.5 2.9 3.8 2.1 1.9
1.7 Column1 4.9 4.4 3.6 4.0 2.6 4.0 2.4 4.1 3.4 3.0
1.7 3.6 3.9 2.5 4.2 3.1 4.1 5.0 1.7 3.3 4.5
1.9 Mean 3.578 4.3 3.1 4.0 2.6 5.0 3.7 3.0 4.3 3.8 4.0
1.9 Standard Error 0.081 1.9 2.7 3.6 4.4 2.0 4.5 4.1 4.7 2.6 4.6
2.0 Median 3.600 3.4 3.5 4.0 3.5 4.3 3.7 3.6 3.2 2.5 4.6
2.9
3.0
3.0
3.0
3.1
3.1
3.1
3.1
3.2
3.2
3.2
3.2
3.2
3.2
3.3
3.4
3.4
3.4
3.4
3.4
3.5
3.5
3.5
3.5
3.5
3.5
3.6
3.6
3.6
3.6
3.6
3.6
3.6
3.6
3.6
3.7
3.7
3.7
3.7
3.8
3.8
3.8
3.8
3.8
3.9
3.9
3.9
3.9
3.9
4.0
4.0
4.0
4.0
4.0
4.0
4.1
Page 4
2.1 Mode 3.600 3.2 3.6 3.2 4.8 5.0 2.8 3.8 3.1 3.0 3.9
2.1 Standard Deviation 0.812 4.0 3.7 3.5 5.0 3.9 3.4 3.2 3.6 4.3 1.7
2.4 Sample Variance 0.660 3.1 4.9 2.6 3.5 3.5 2.8 4.3 2.1 3.8 3.9
2.5 Range 3.600
2.6 Sum 357.800
2.8
Prob 6-12 Statistics
4.1
4.1
4.2
4.3
4.3
4.3
4.3
4.3
4.3
4.4
4.4
4.5
4.5
4.6
4.6
4.7
4.8
4.9
4.9
4.9
5.0
5.0
5.0
5.0
5.3
Page 5
Prob 6-12 Histogram
Problem 6-12
Blood Tests at Rivervalley Labs
Histogram Using Excel Data Analysis Tool – “Histogram”
Note that bin data must be input into the Histogram module before analysis can proceed.
Input Bin Bin Frequency
Data Here
1.9 4
1.9 2.2 3
2.2 2.5 5
2.5 2.8 7
2.8 3.1 8
3.1 3.4 12
1.7 2.5 3.9 3.8 4.9 3.6 3.5 2.9 3.8 2.1 1.9
1.7 4.9 4.4 3.6 4.0 2.6 4.0 2.4 4.1 3.4 3.0
1.9 3.6 3.9 2.5 4.2 3.1 4.1 5.0 1.7 3.3 4.5
1.9 4.3 3.1 4.0 2.6 5.0 3.7 3.0 4.3 3.8 4.0
2.0 1.9 2.7 3.6 4.4 2.0 4.5 4.1 4.7 2.6 4.6
2.1 3.4 3.5 4.0 3.5 4.3 3.7 3.6 3.2 2.5 4.6
2.1 3.2 3.6 3.2 4.8 5.0 2.8 3.8 3.1 3.0 3.9
2.4 4.0 3.7 3.5 5.0 3.9 3.4 3.2 3.6 4.3 1.7
2.5 3.1 4.9 2.6 3.5 3.5 2.8 4.3 2.1 3.8 3.9
2.5 3.6 3.6 3.7 3.2 5.3 2.5 3.2 3.4 3.4 4.3
2.5
2.5
2.6
2.6
2.6
2.6
2.7
2.8
2.8
2.9
3.0
3.0
3.0
3.1
3.1
3.1
3.1
3.2
3.2
3.2
3.2
3.2
3.2
12
14
16
18
20
Histogram
Page 6
3.4 3.7 19
4.0 4.3 10
4.3 4.6 6
4.6 4.9 5
4.9 5.1 4
Prob 6-12 Histogram
3.3
3.4
3.4
3.4
3.4
3.4
3.5
3.5
3.5
3.5
3.5
3.5
3.6
3.6
3.6
3.6
3.6
3.6
3.6
3.6
3.6
3.7
3.7
3.7
3.7
3.8
3.8
3.8
3.8
3.8
3.9
3.9
3.9
3.9
3.9
4.0
4.0
4.0
4.0
4.0
4.0
4.1
4.1
4.1
4.2
4.3
4.3
4.3
4.3
4.3
4.3
4.4
4.4
4.5
4.5
4.6
4.6
Page 7

Prob 6-12 Histogram
4.7
4.8
4.9
4.9
4.9
5.0
5.0
5.0
5.0
5.3
Page 8
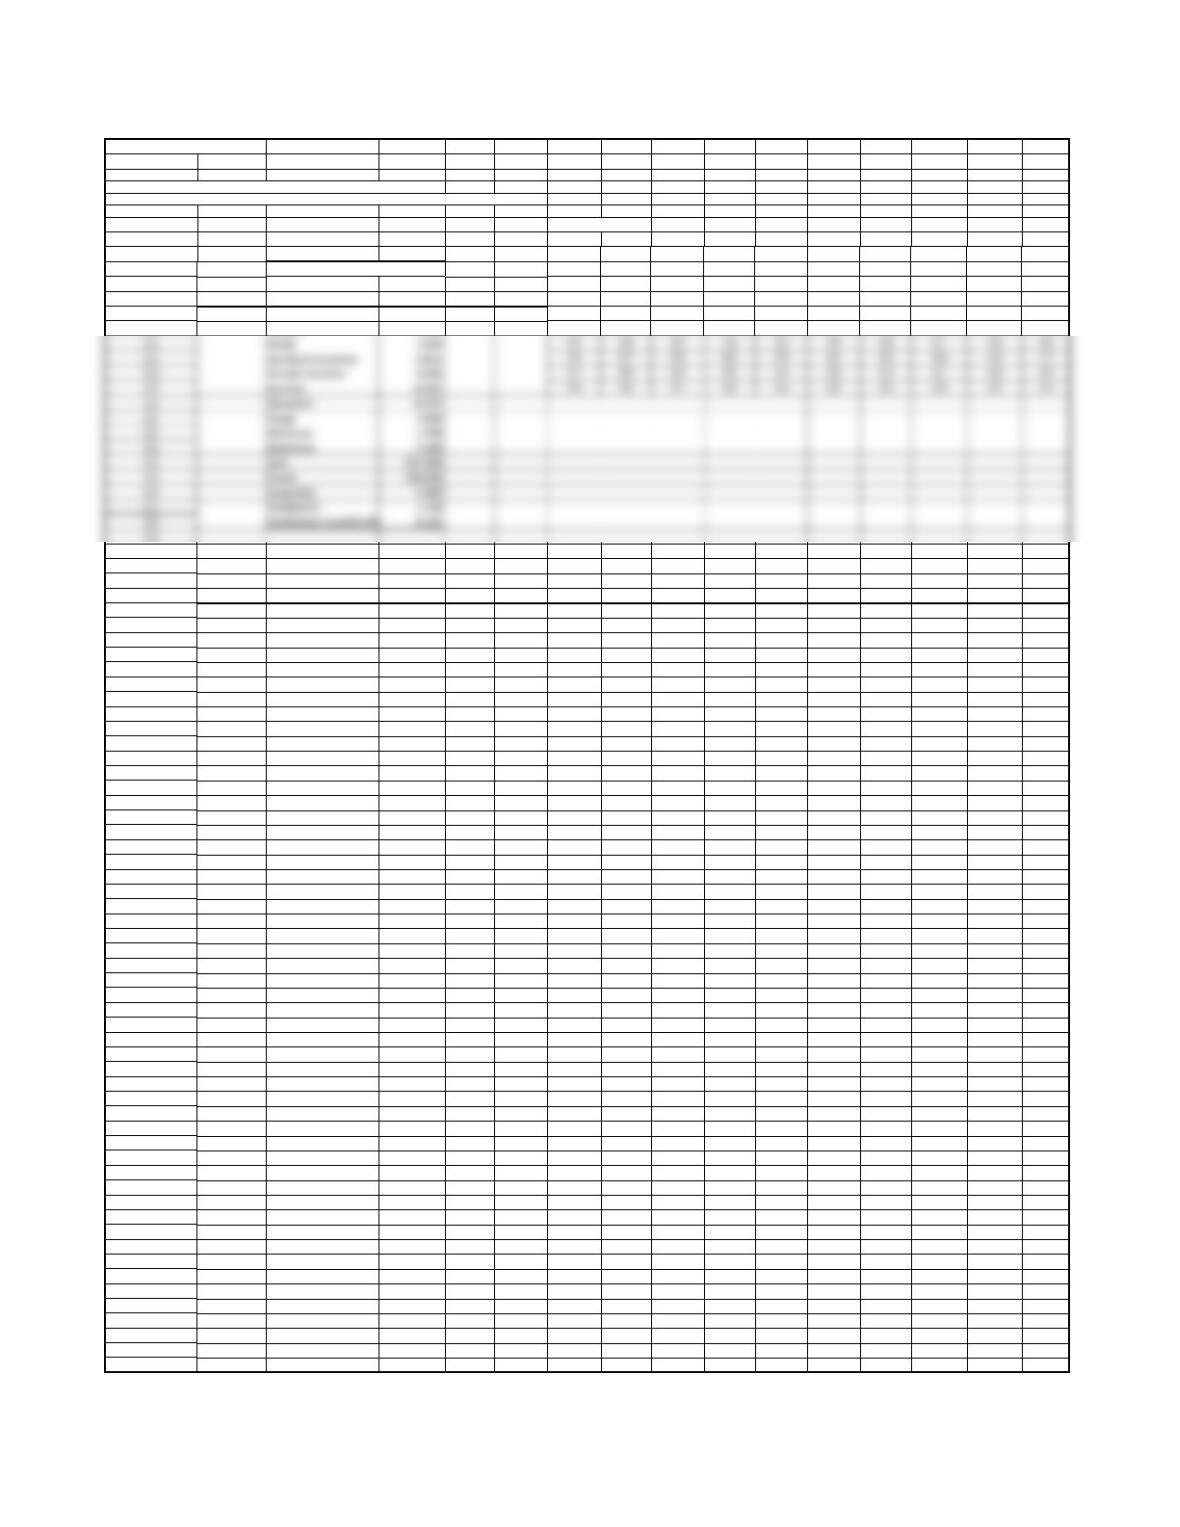
Problem 6- 13
Fillmore Metalwork Foundry
Descriptive Statistics and Frequency Chart
This spreadsheet is designed for up to 100 pieces of data Enter data ONLY in yellow-shaded cells.
Note: The Histogram macro and the Descriptive Statistics macro have been used to develop this solution.
They can be loaded into the Tools menu during standard setup of Excel.
If available, they will show up as the Data Analysis label on the Tools menu.
DATA (x – x-bar)^2
138.1 0.306916
Calculation of mean & Sample Standard Deviation
238.1 0.306916
338.5 0.023716 Mean (x-bar) = 38.6540
438.5 0.023716 Sample Standard deviation = 0.3060
538.7 0.002116
638.8 0.021316
738.6 0.002916
838.3 0.125316 Check on the above formula – By using Excel Descriptive Statistics, below
938.3 0.125316
10 38.3 0.125316
11 38.5 0.023716 Column B Original Data set
35 38.6 0.002916
36 38.6 0.002916
37 38.6 0.002916
38 38.1 0.306916
39 38.1 0.306916
40 38.1 0.306916
41 38.4 0.064516
42 38.6 0.002916
43 38.7 0.002116
44 38.7 0.002116
45 38.9 0.060516
46 38.6 0.002916
47 38.5 0.023716
48 38.4 0.064516
49 38.5 0.023716
50 38.5 0.023716
51 39.2 0.298116
52 38.6 0.002916
53 38.7 0.002116
54 38.8 0.021316
55 38.7 0.002116
56 38.7 0.002116
57 38.6 0.002916
58 39.5 0.715716
59 39.6 0.894916
60 39.3 0.417316
61 38.9 0.060516
62 38.9 0.060516
63 38.9 0.060516
64 38.9 0.060516
65 38.9 0.060516
66 39.0 0.119716
67 38.7 0.002116
68 38.8 0.021316
69 38.7 0.002116
70 39.0 0.119716
71 38.5 0.023716
72 38.8 0.021316
73 38.6 0.002916
74 38.7 0.002116
75 38.5 0.023716
76 38.7 0.002116
77 38.7 0.002116
12 38.8 0.021316
13 38.5 0.023716 Mean 38.6540
15 38.6 0.002916 Median 38.6000 38.1 38.8 38.6 38.6 38.6 38.6 38.9 38.8 39.0 38.6
16 38.6 0.002916 Mode 38.6000 38.5 38.5 38.8 38.7 38.7 38.7 38.9 38.6 39.1 38.7
17 38.6 0.002916 Standard Deviation 0.3060 38.5 38.6 38.5 38.5 38.7 38.8 38.9 38.7 38.7 38.6
18 38.6 0.002916 Sample Variance 0.0936 38.7 38.6 38.7 38.6 38.9 38.7 38.9 38.5 38.6 38.5
19 38.6 0.002916 Kurtosis 4.1122 38.8 38.6 38.4 38.6 38.6 38.7 39.0 38.7 38.7 38.5
20 38.6 0.002916 Skewness -0.3236 38.6 38.6 38.5 38.6 38.5 38.6 38.7 38.7 39.1 38.6
21 38.3 0.125316 Range 2.3000 38.3 38.6 38.4 38.1 38.4 39.5 38.8 38.8 39.1 38.6
22 38.6 0.002916 Minimum 37.3000 38.3 38.6 38.4 38.1 38.5 39.6 38.7 38.8 39.2 38.8
23 38.8 0.021316 Maximum 39.6000 38.3 38.6 38.4 38.1 38.5 39.3 39.0 38.8 39.2 38.7
24 38.5 0.023716 Sum 3865.4000
25 38.7 0.002116 Count 100.0000
26 38.4 0.064516 Largest(1) 39.6000
27 38.5 0.023716 Smallest(1) 37.3000
28 38.4 0.064516
29 38.4 0.064516
30 38.4 0.064516
31 37.3 1.833316
32 38.6 0.002916
33 38.7 0.002116
34 38.5 0.023716
78 38.8 0.021316
79 38.8 0.021316
80 38.8 0.021316
81 39.0 0.119716
82 39.0 0.119716
83 39.1 0.198916
84 38.7 0.002116
85 38.6 0.002916
86 38.7 0.002116
87 39.1 0.198916
88 39.1 0.198916
89 39.2 0.298116
90 39.2 0.298116
91 38.6 0.002916
92 38.6 0.002916
93 38.7 0.002116
94 38.6 0.002916
95 38.5 0.023716
96 38.5 0.023716
97 38.6 0.002916
98 38.6 0.002916
99 38.8 0.021316