Chapter 5S – Problems 1-7 Note: This worksheet displays results only, you must copy the shaded
<Back area into the corresponding template to make additional calculations.
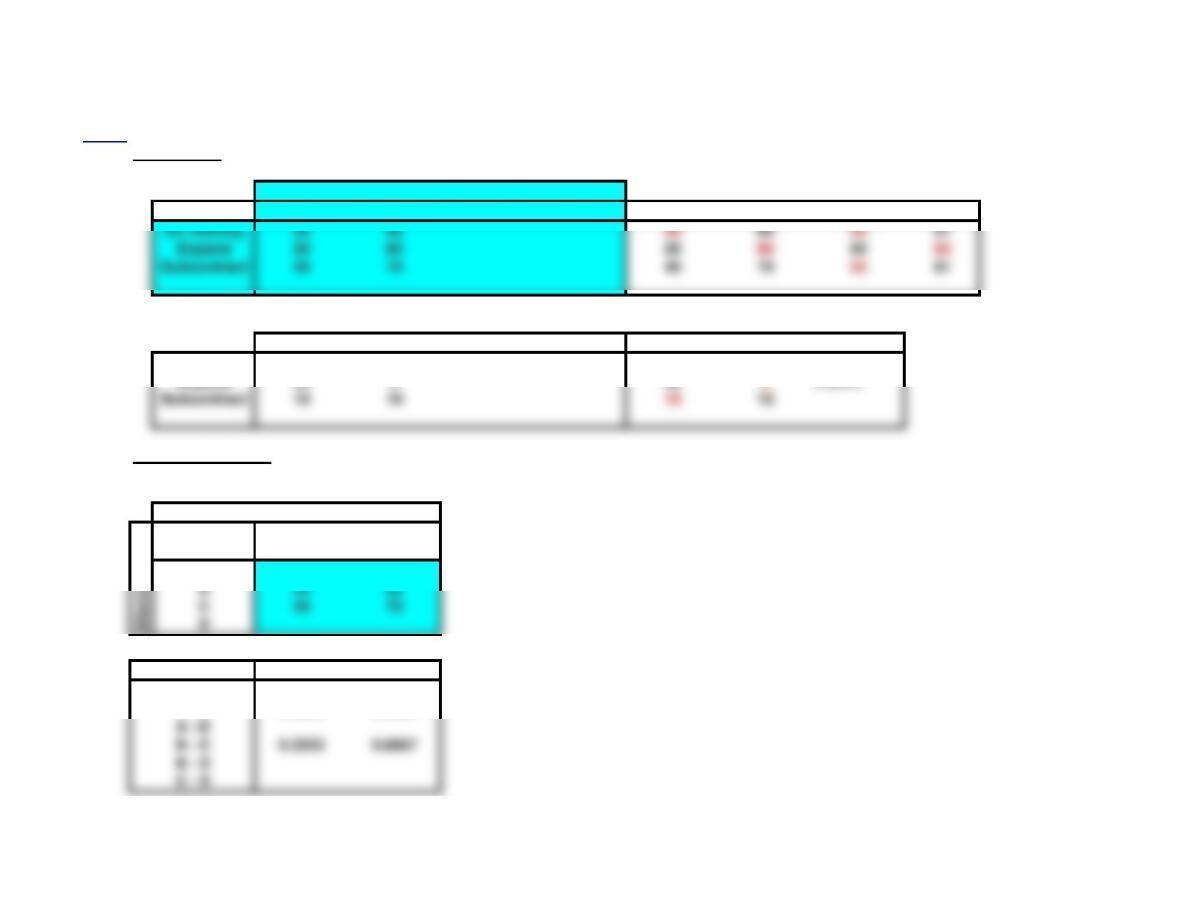
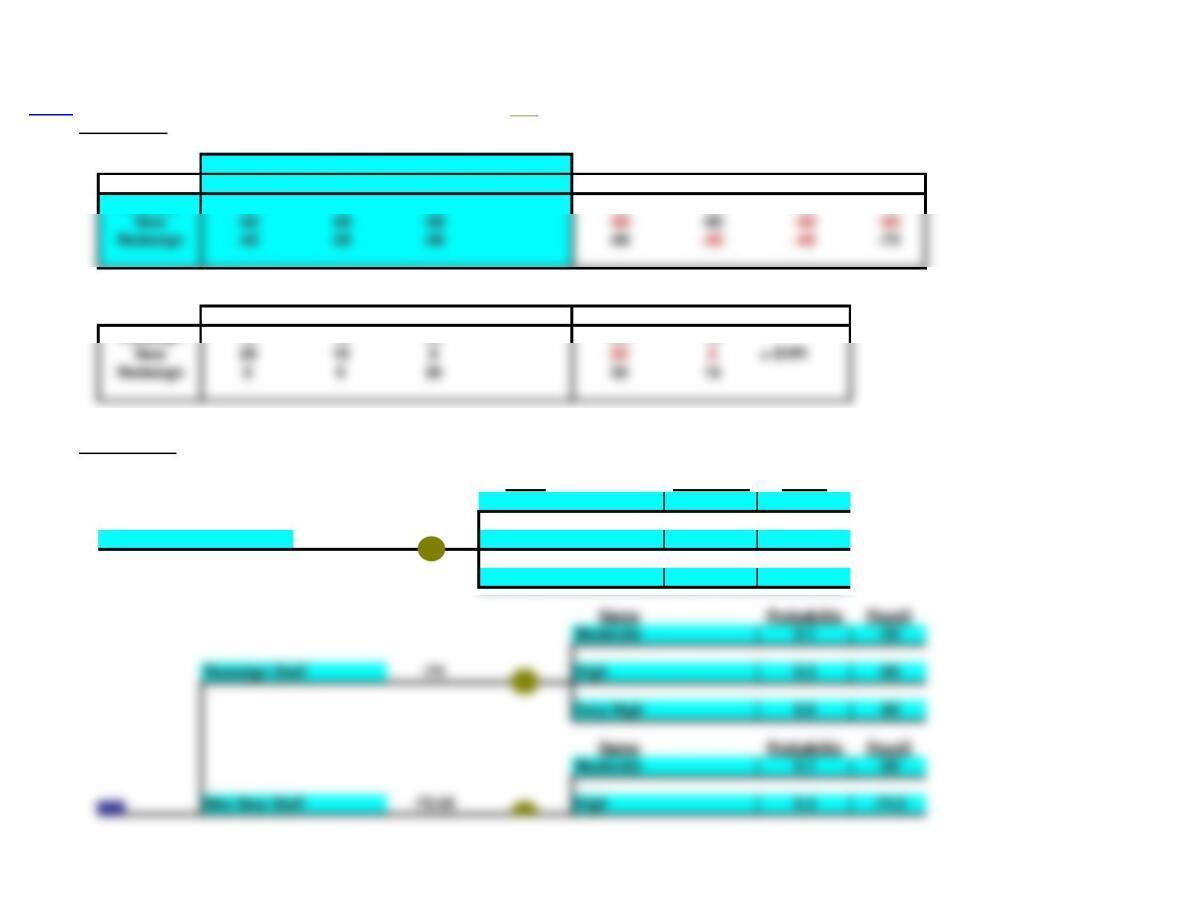
1,2. Payoff Table
Low High
Probability = 0.3 0.7 Min Max Avg EMV
Opportunity Loss Table
Low High Max EOL
Do nothing 0 20 20 14
Expand 30 030 9= EVPI
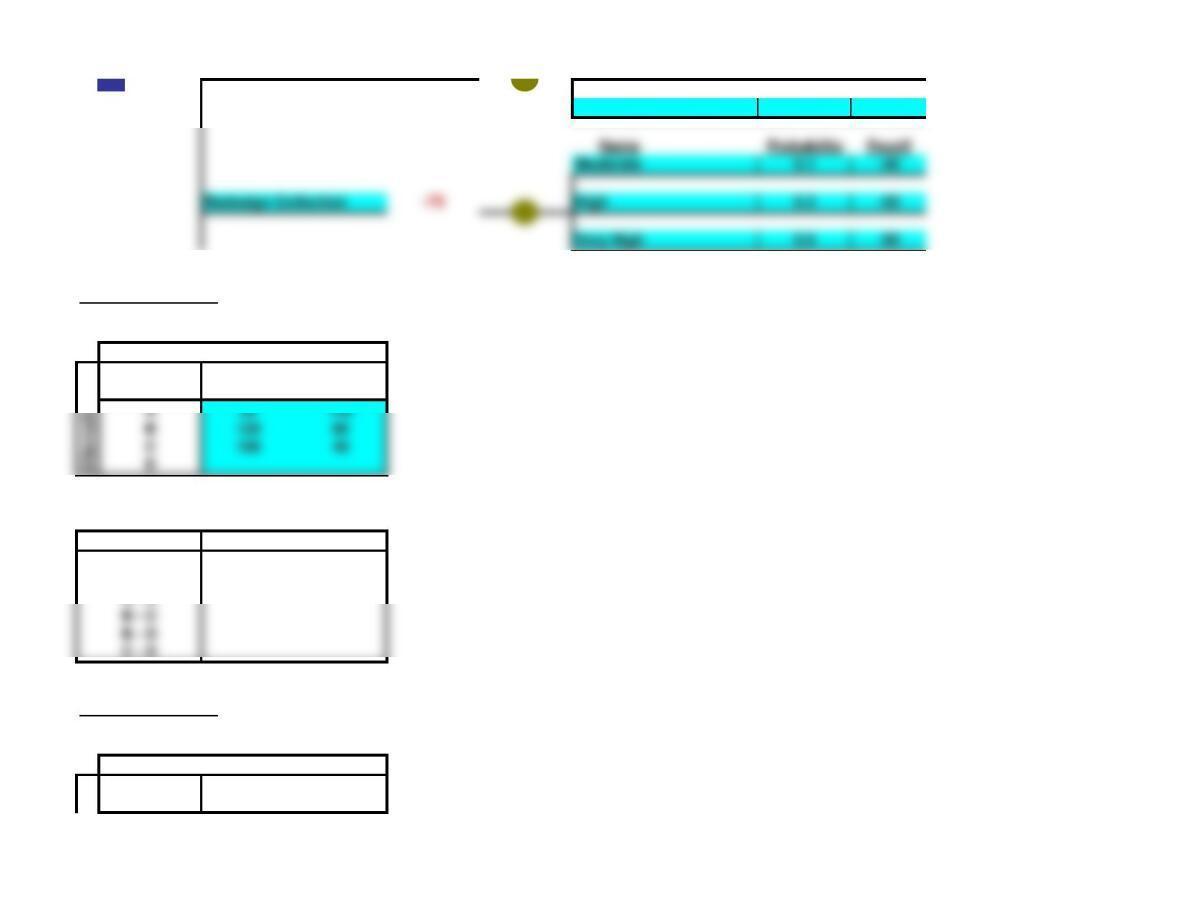
3. Sensitivity Analysis
Payoff Table
States of Nature
S1 S2
A50 60
Intersection P(S1) P(S2)
A – B 0.4000 0.6000
A – C 0.5000 0.5000
A – D
B – C 0.3333 0.6667
B – D
Do nothing 50 60 50 60 55 57
Expand 20 80 20 80 50 62
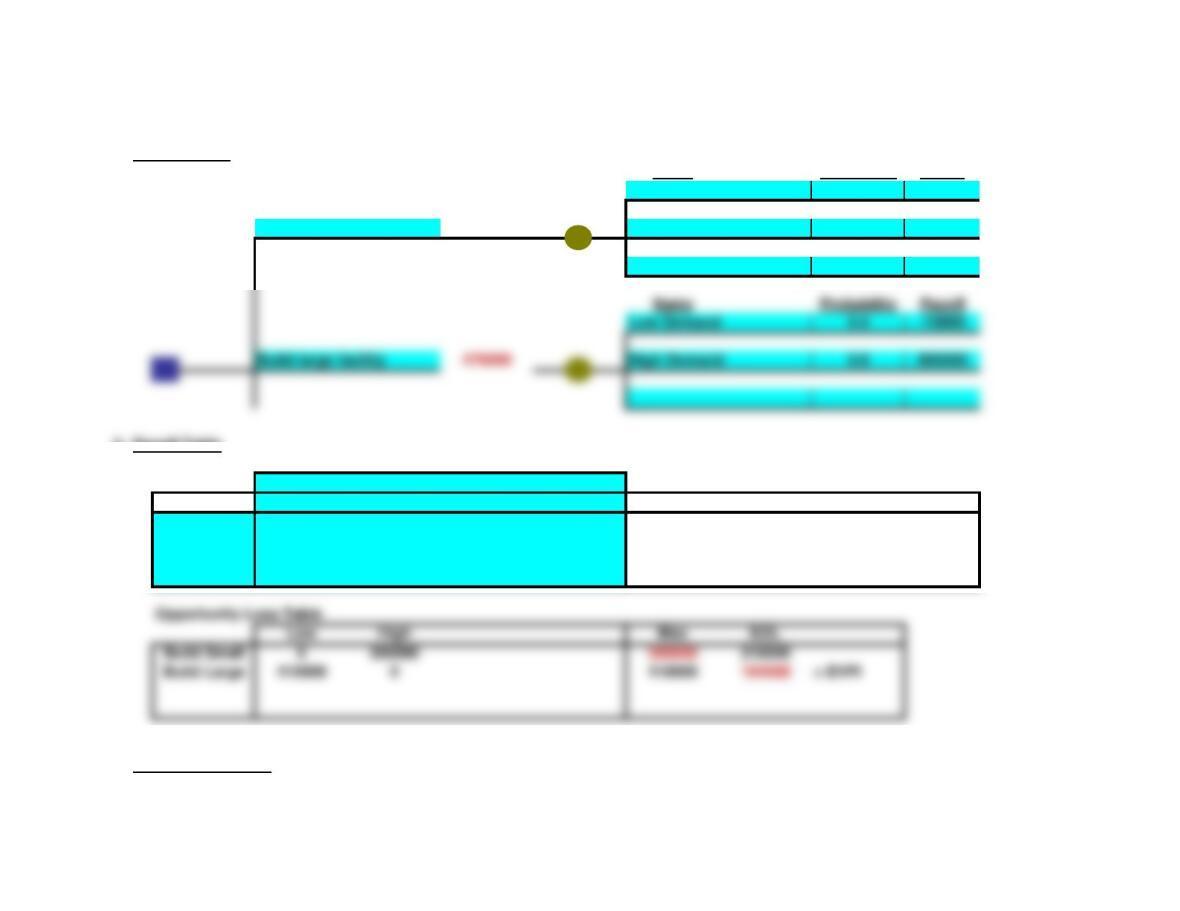
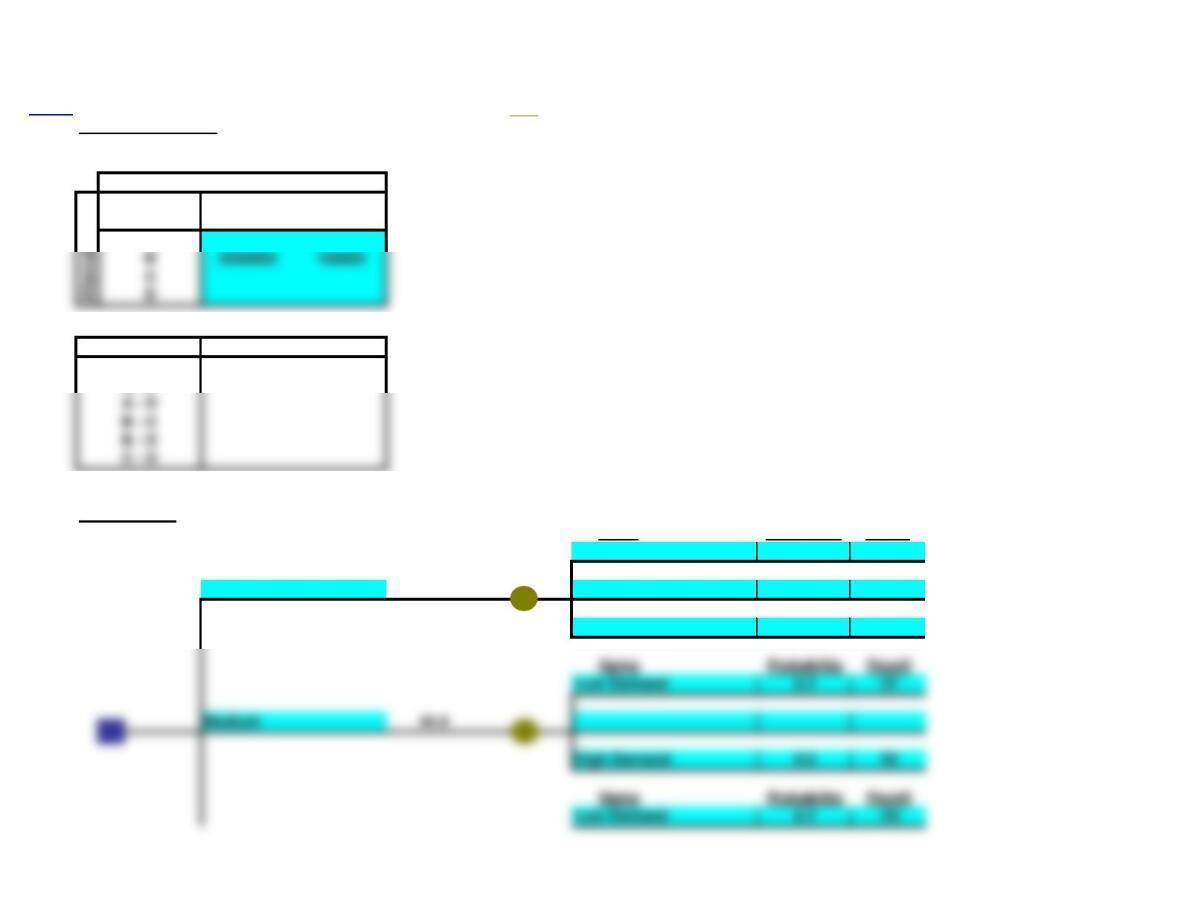
4a. Decision Tree
Name Probability Payoff
Low Demand 0.4 400000
Build small facility 430000 High Demand 0.6 450000
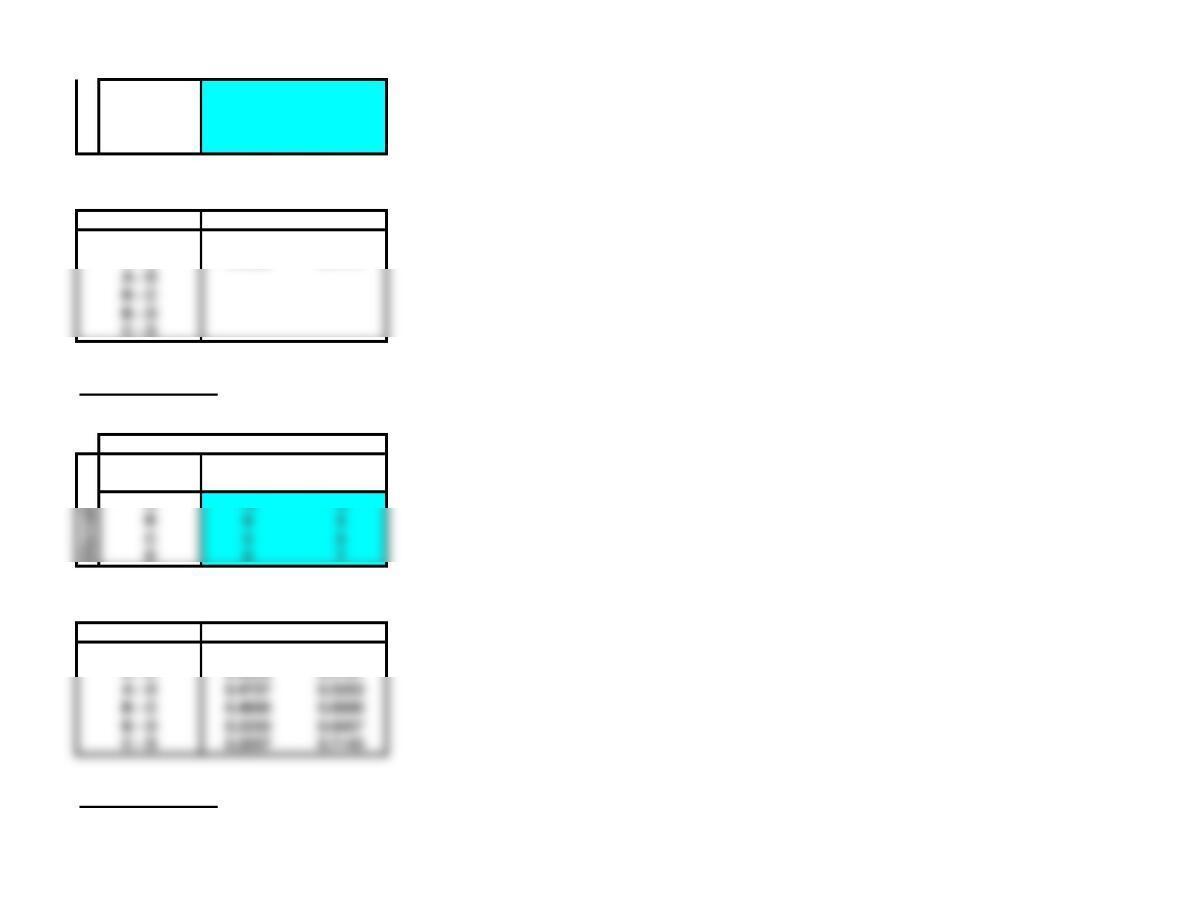
b. Payoff Table
Low High
Probability = 0.4 0.6 Min Max Avg EMV
Build Small 400000 450000 400000 450000 425000 430000
Build Large -10000 800000 -10000 800000 395000 476000
Low High Max EOL
Build Small 0 350000 350000 210000
Build Large 410000 0410000 164000 = EVPI
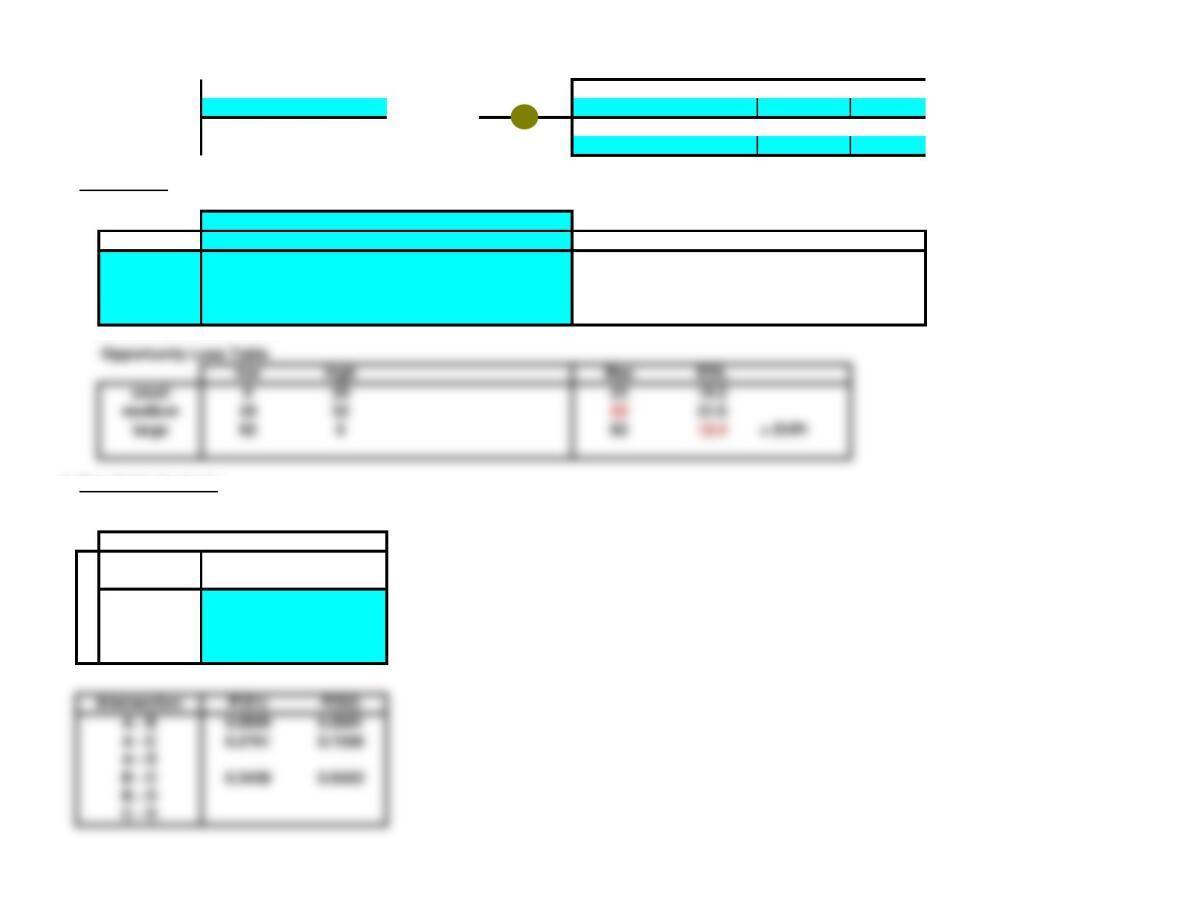
c. Sensitivity Analysis
Name Probability Payoff
Low Demand 0.4 -10000
Build large facility 476000 High Demand 0.6 800000
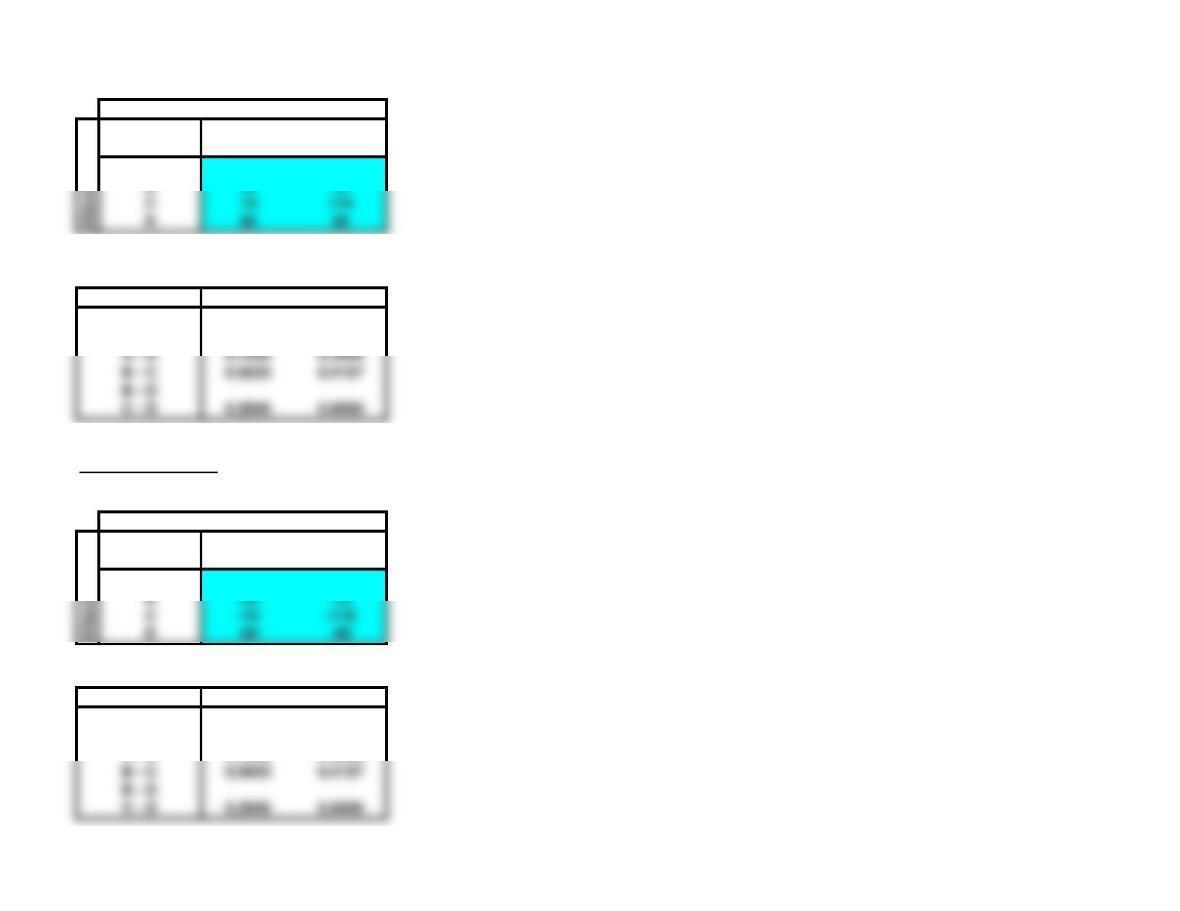
Payoff Table
States of Nature
S1 S2
A400000 450000
B -10000 800000
Intersection P(S1) P(S2)
A – B 0.4605 0.5395
A – C
A – D
B – C
B – D
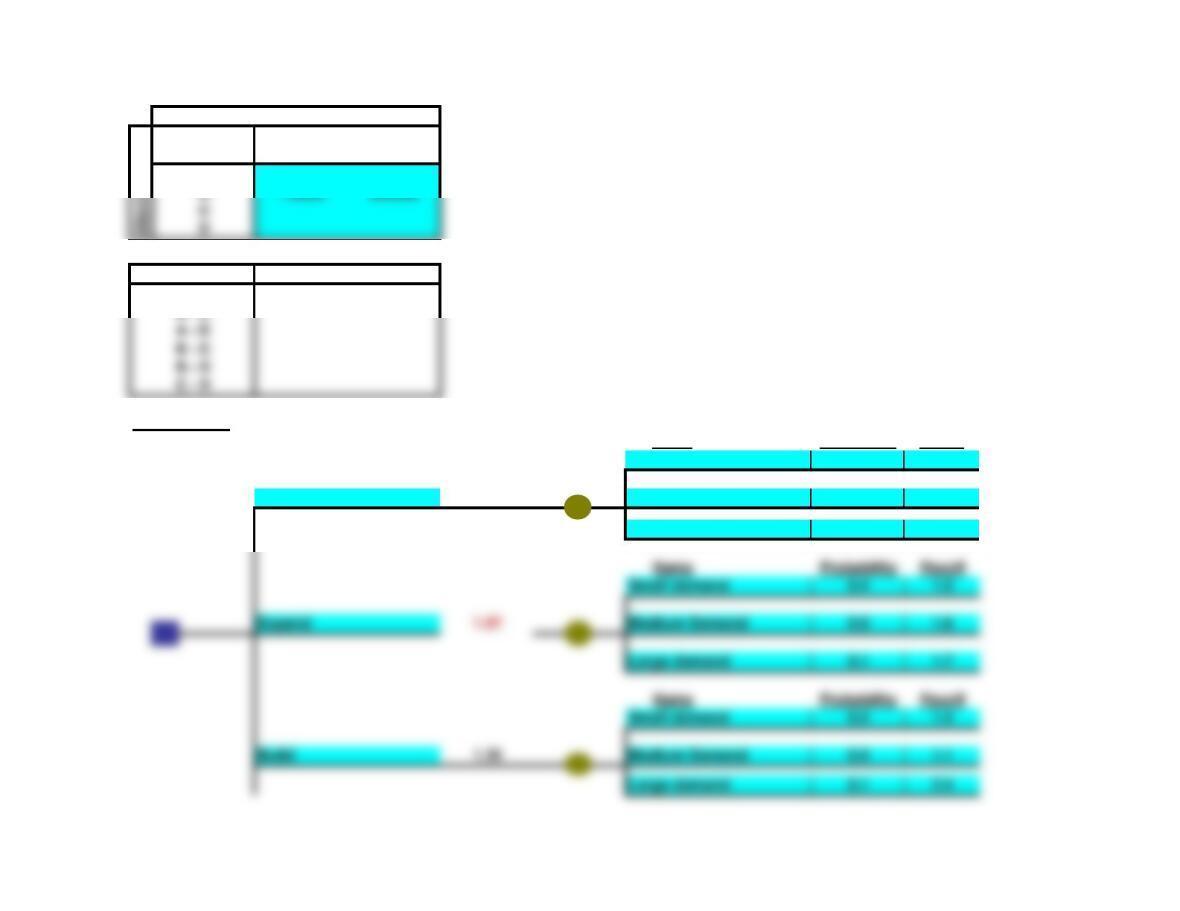
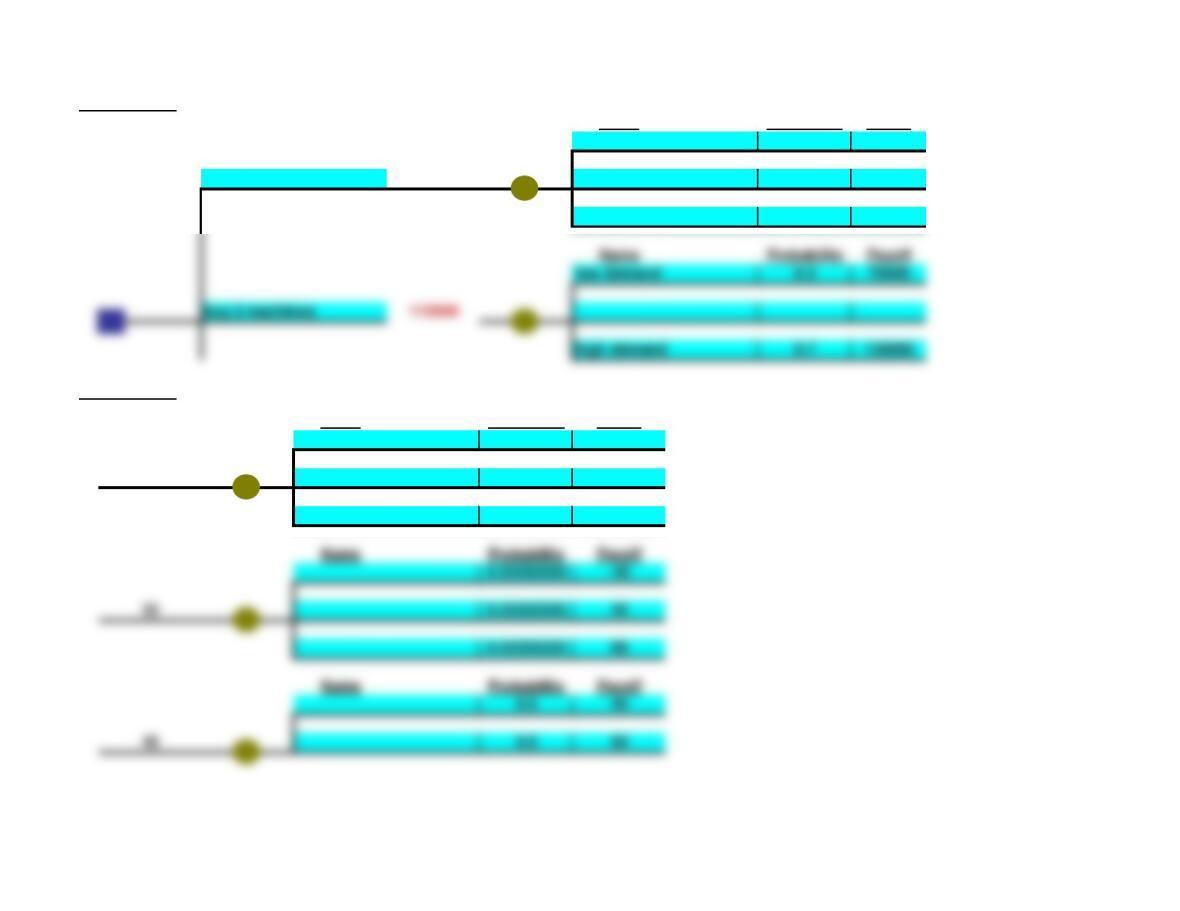
5. Decision Tree
Name Probability Payoff
Small demand 0.4 1
Subcontract 1.23 Medium Demand 0.5 1.3
Large demand 0.1 1.8
Name Probability Payoff
Small demand 0.4 1.5
Name Probability Payoff
Small demand 0.4 1.4
C
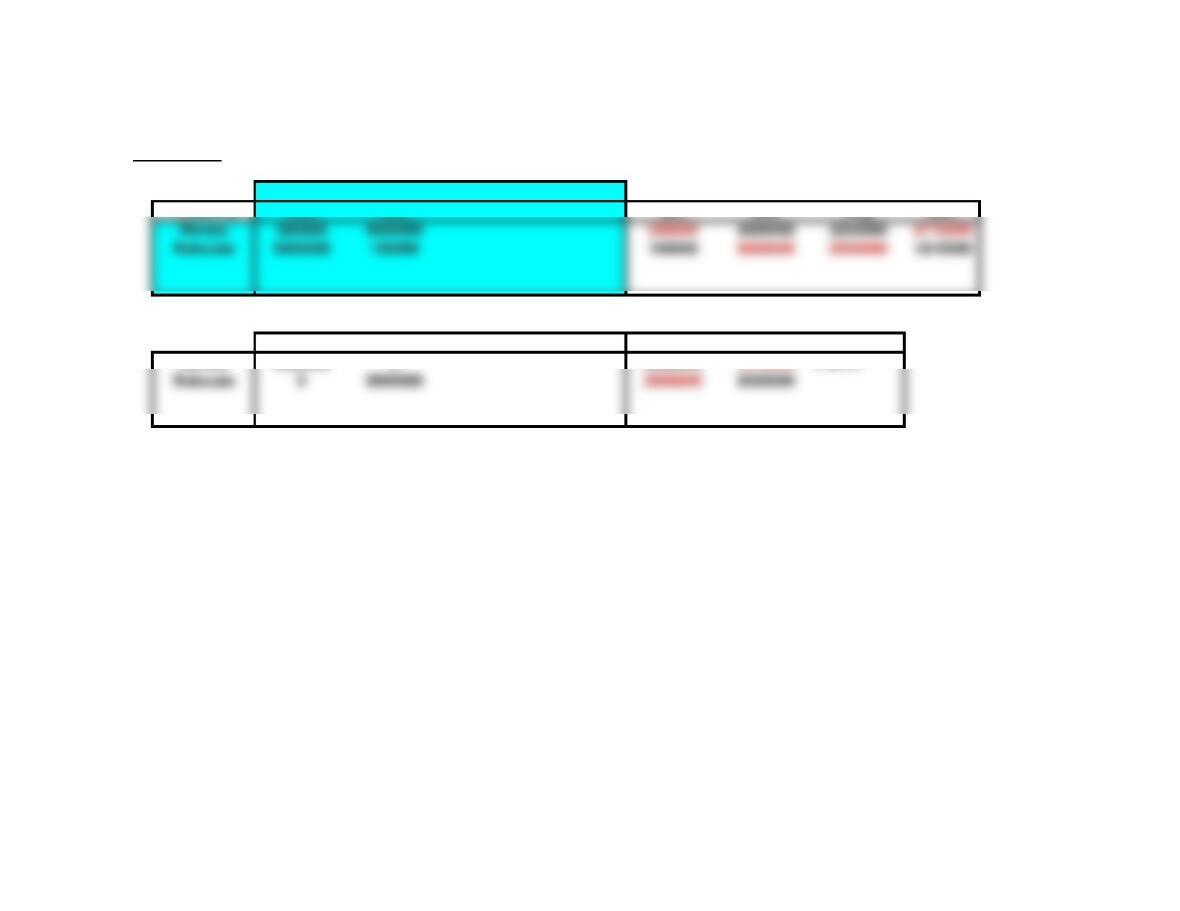
6,7. Payoff Table
Approved Rejected
Probability = 0.35 0.65 Min Max Avg EMV
Opportunity Loss Table
Approved Rejected Max EOL
Renew 4500000 04500000 1575000 = EVPI
Chapter 5S – Problems 8-12 Note: This worksheet displays results only, you must copy the shaded
<Back area into the corresponding template to make additional calculations.
8. Sensitivity Analysis
Payoff Table
States of Nature
S1 S2
A500000 4000000
Intersection P(S1) P(S2)
A – B 0.4643 0.5357
A – C
A – D
B – C
B – D
9a. Decision Tree
Name Probability Payoff
Low Demand 0.2 42
Small 46.8
High Demand 0.8 48
Name Probability Payoff
Low Demand 0.2 22
Name Probability Payoff
Large 53.6
High Demand 0.8 72
b,c. Payoff Table
low high
Probability = 0.2 0.8 Min Max Avg EMV
small 42 48 42 48 45 46.8
medium 22 50 22 50 36 44.4
large -20 72 -20 72 26 53.6
d. Sensitivity Analysis
Payoff Table
States of Nature
S1 S2
A42 48
B22 50
C -20 72
D
Alternative
medium 20 22 22 21.6
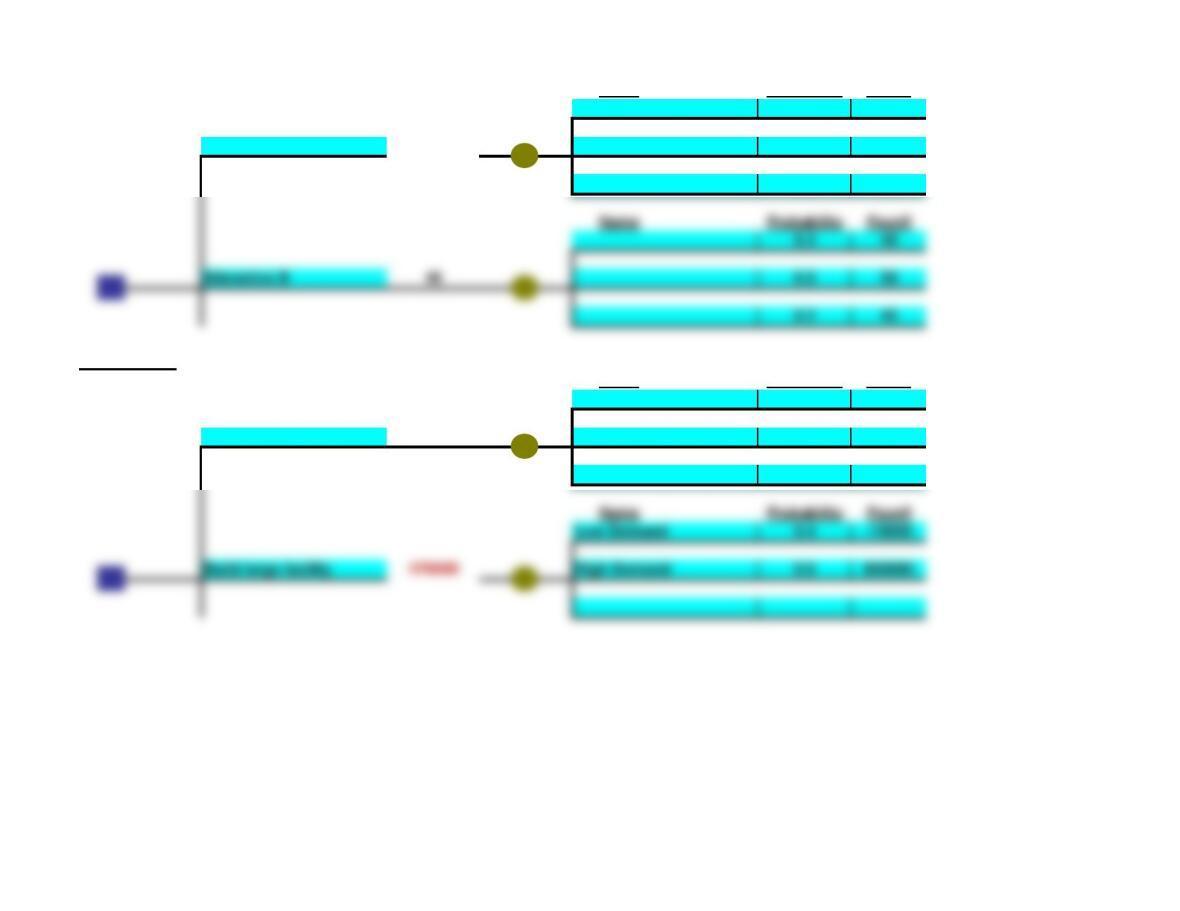
10. Decision Tree
Name Probability Payoff
low demand 0.3 90000
buy 1 machine 104000
high demand 0.7 110000
Decision Tree
Name Probability Payoff
0.33333333 0
50 0.33333333 60
0.33333333 90
Name Probability Payoff
33 0.33333333 45
0.33333333 99
Name Probability Payoff
Name Probability Payoff
buy 2 machines 113500
high demand 0.7 130000
Name Probability Payoff
0.3 50
Alternative A 49 0.5 44
0.2 60
12. Decision Tree
Name Probability Payoff
Low Demand 0.4 400000
Build small facility 430000 High Demand 0.6 450000
Name Probability Payoff
Low Demand 0.4 -10000
Build large facility 476000 High Demand 0.6 800000
Name Probability Payoff
0.3 40
0.2 45
Chapter 5S – Problems 13-19 Note: This worksheet displays results only, you must copy the shaded
<Back area into the corresponding template to make additional calculations.
13,14. Payoff Table
Moderate High Very High
Probability = 0.1 0.3 0.6 Min Max Avg EMV
Reassign -50 -60 -85 -85 -50 -65 –74
Opportunity Loss Table
Moderate High Very High Max EOL
Reassign 10 10 25 25 19
15. Decision Tree
Name Probability Payoff
Moderate 0.1 -40
Hire Second New Staff -74.5 High 0.3 -75
Very High 0.6 -80
Very High 0.6 -74.5
16. Sensitivity Analysis
Payoff Table
States of Nature
S1 S2
Intersection P(S1) P(S2)
A – B 0.3750 0.6250
A – C 0.5556 0.4444
A – D
B – C
B – D
17. Sensitivity Analysis
Payoff Table
States of Nature
S1 S2
ative
Very High 0.6 -90
A -20 -140
B -120 -80
C -100 -40
D
Intersection P(S1) P(S2)
A – B 0.3750 0.6250
A – C 0.5556 0.4444
18. Sensitivity Analysis
Payoff Table
States of Nature
S1 S2
A10 -2
Intersection P(S1) P(S2)
A – B 0.7143 0.2857
A – C 0.5833 0.4167
A – D 0.4737 0.5263
B – C 0.4000 0.6000
B – D 0.3333 0.6667
19a. Sensitivity Analysis
Alternative
Alternative
B – C
B – D
Payoff Table
States of Nature
S1 S2
A120 20
B60 40
Intersection P(S1) P(S2)
A – B 0.2500 0.7500
A – C 0.4500 0.5500
A – D 0.7000 0.3000
B – C 0.5833 0.4167
B – D
19b. Sensitivity Analysis
Payoff Table
States of Nature
S1 S2
A -120 -20
Intersection P(S1) P(S2)
A – B 0.2500 0.7500
A – C 0.4500 0.5500
A – D 0.7000 0.3000
B – C 0.5833 0.4167
B – D
C10 110