*** Problem Set Key: Do Not Post or Distribute ***
Chapter 5: Managing Quality
Introduction to Operations & Supply Chain Management (Bozarth & Handfield, 3rd Edition)
DIRECTIONS To generate the key, put the same 4-digit number in the space below that was
used in printing out the original assignment.
Name: *** KEY ***
20
Buff n’ Tuff Products produces bottles of free-range steroids.
In order to assess the accuracy of the bottle filling process, Buff n’ Tuff took 10
samples of 6 observations each when the process was working as expected.
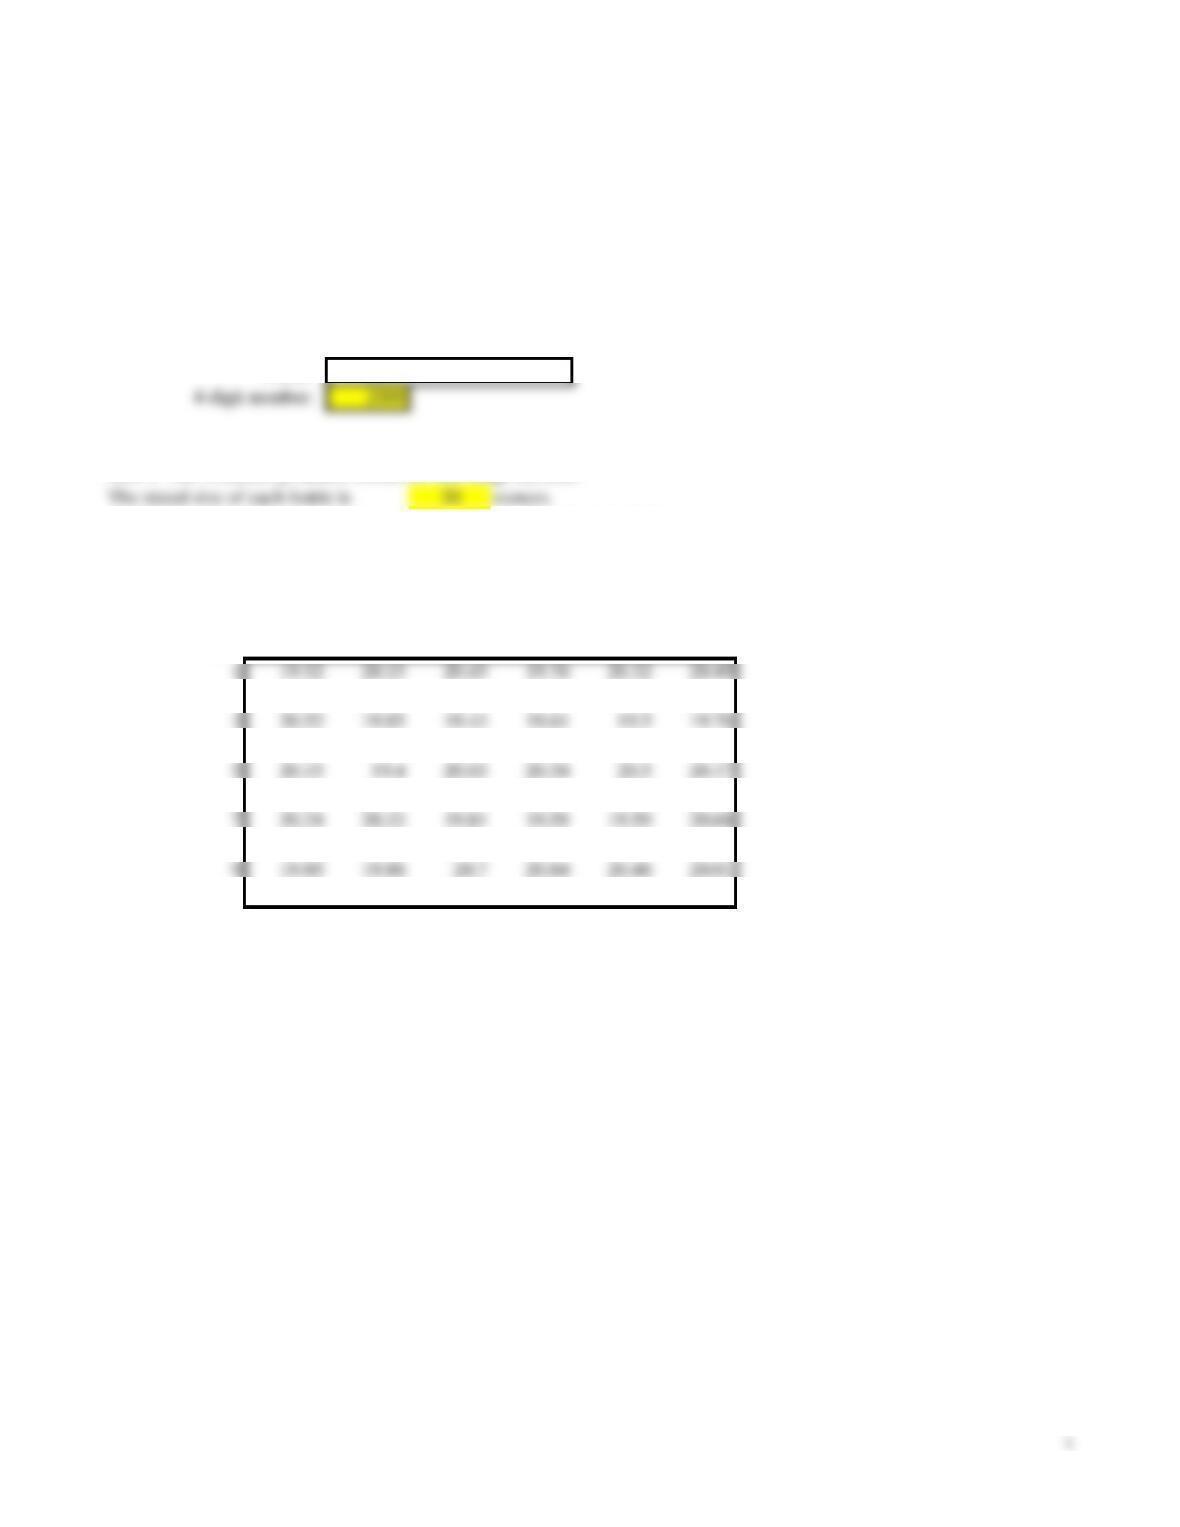
The table below shows the weight (in ounces) for each sample bottle.
*************** Observations ******************
Sample 1 2 3 4 5 6
2 20.26 20.45 19.99 20.56 19.68 20.29
4 20.07 20.04 20.31 20.37 19.52 19.86
6 19.98 19.87 19.21 20.14 20.5 20.32
8 20.21 20.08 19.89 20.38 20.2 20.04
10 20.07 19.8 19.89 19.98 20.65 20.16
Chapter 4: Managing Quality
*** KEY ***
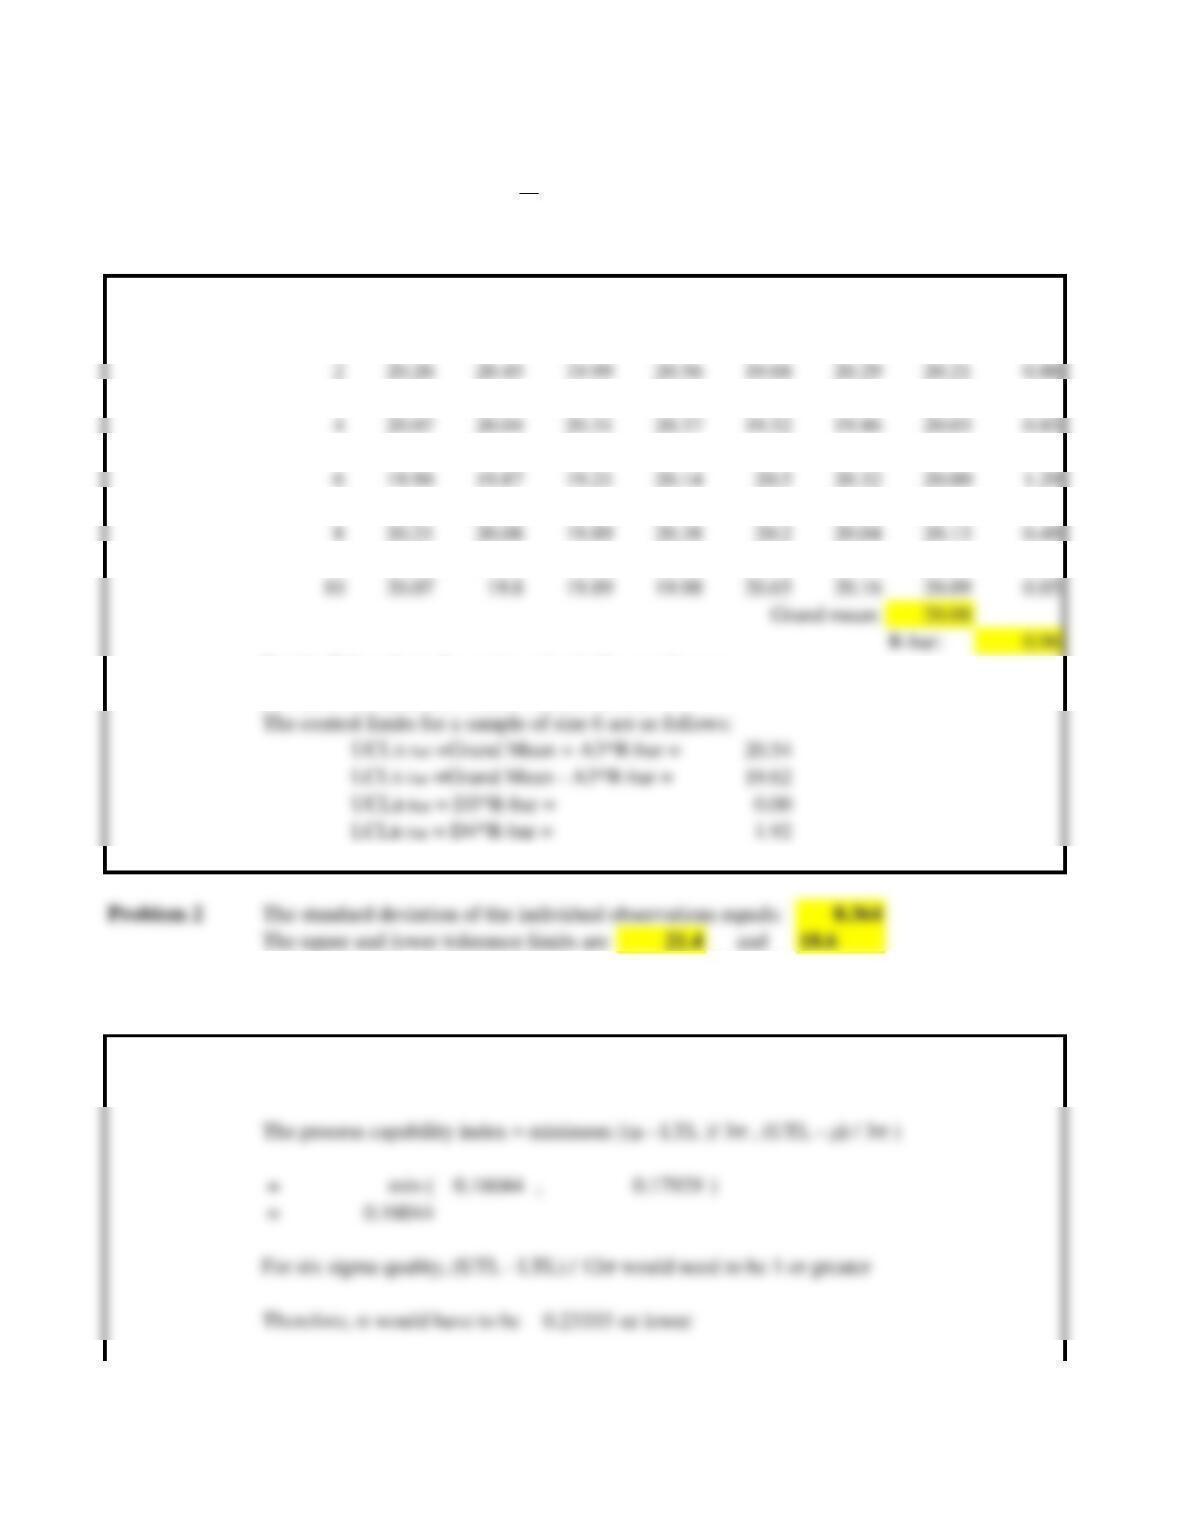
Problem 1 In the space below, set up the X and R charts for the Buff n’ Tuff filling process,
Show how you calculated the upper and lower control limits for each chart.
*************** Observations ******************
Sample 1 2 3 4 5 6 X-bar R
1 19.52 20.15 20.45 19.76 20.32 20.49 20.12 0.97
3 20.52 19.85 19.43 19.61 19.5 19.76 19.78 1.09
5 20.15 19.4 20.03 20.34 20.5 20.17 20.10 1.10
7 20.24 20.32 19.81 19.58 19.59 20.68 20.04 1.10
9 19.85 19.86 20.7 20.84 20.46 20.01 20.29 0.99
For the X-bar chart, the center value is the grand mean
For the R-bar chart, the center value is R-Bar
In the space below, calculate the process capability index for the process.
Also, what would the standard deviation have to be in order to support
six sigma quality levels? Show all work.
Our estimate of m is the grand mean from Prob. 1: 20.08
The process capability index = minimum [(m – LTL )/ 3s , (UTL – m) / 3s )
For six sigma quality, (UTL – LTL) / 12s would need to be 1 or greater
Therefore, s would have to be 0.23333 or lower
2

Chapter 4: Managing Quality
Chapter 4: Managing Quality
*** KEY ***
Duff Gardens Amusement Park likes to track customer satisfaction levels.
Over a course of 15 days, management asked a random sample of
guests whether they were happy or unhappy with their overall experience.
The sample results are shown below:
No. of
Sample unhappy
Sample Size guests
1 30 2
2 30 1
3 30 1
4 30 1
5 30 1
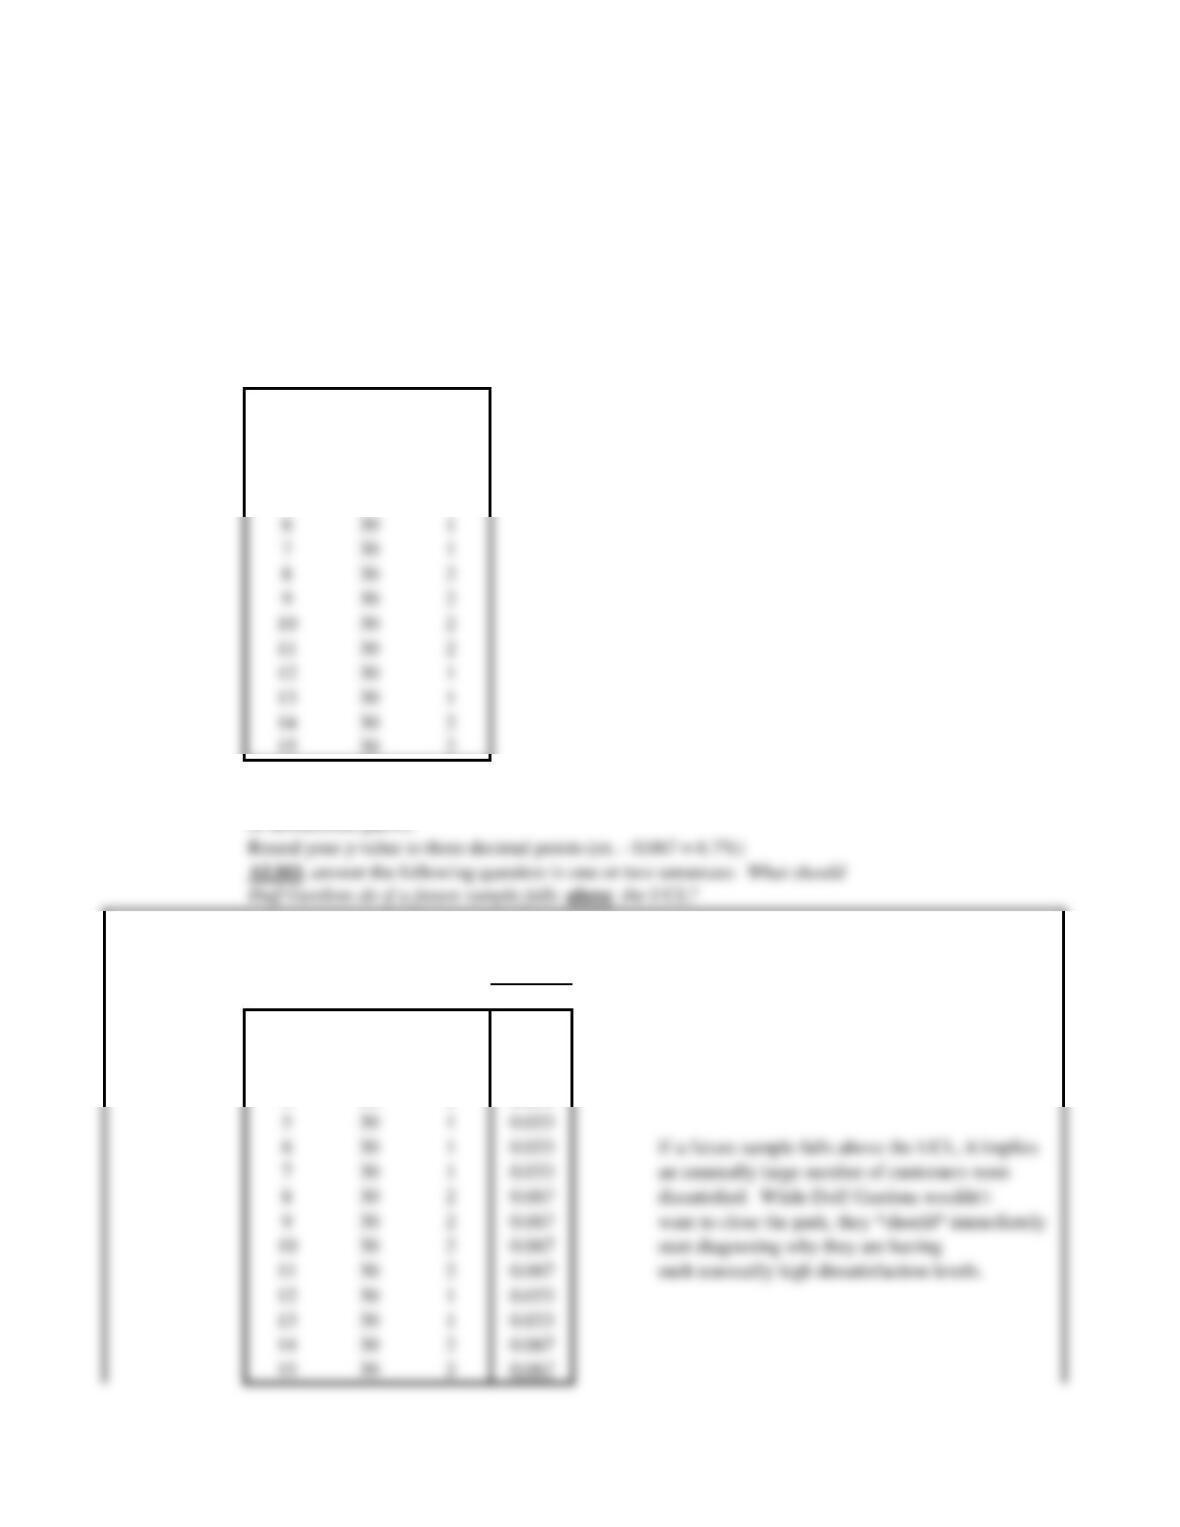
Problem 3 In the space below, set up the p chart required to track the proportion
of dissatisfied guests.
No. of
Sample unhappy
Sample Size guests p Sp = 0.039
1 30 2 0.067
2 30 1 0.033 UCLp = p-bar + 3*Sp = 0.167
3 30 1 0.033 LCLp = p-bar – 3*Sp= 0
4 30 1 0.033
4

Chapter 4: Managing Quality
5