
Excel Templates to accompany Operations Management, Eleventh Edition
created by Lee Tangedahl
Copyright © 2012 by The McGraw Hill Companies, Inc. All rights reserved.
Chapter Five – Strategic Capacity Planning for Products and Services
Templates: Efficiency (B) Solved Problems Solved Problem 1
Breakeven Analysis (B) Solved Problem 4
Comparative Breakeven Analysis (B)
Problems Problems 1-8
(B) – includes Basic template Problems 9-12
Lecture Suggestions
Example 2
Example 3
Example 4
See Instructions template for complete instructions.
Process Requirements (B) Solved Problem 2
Efficiency Basic
<Back
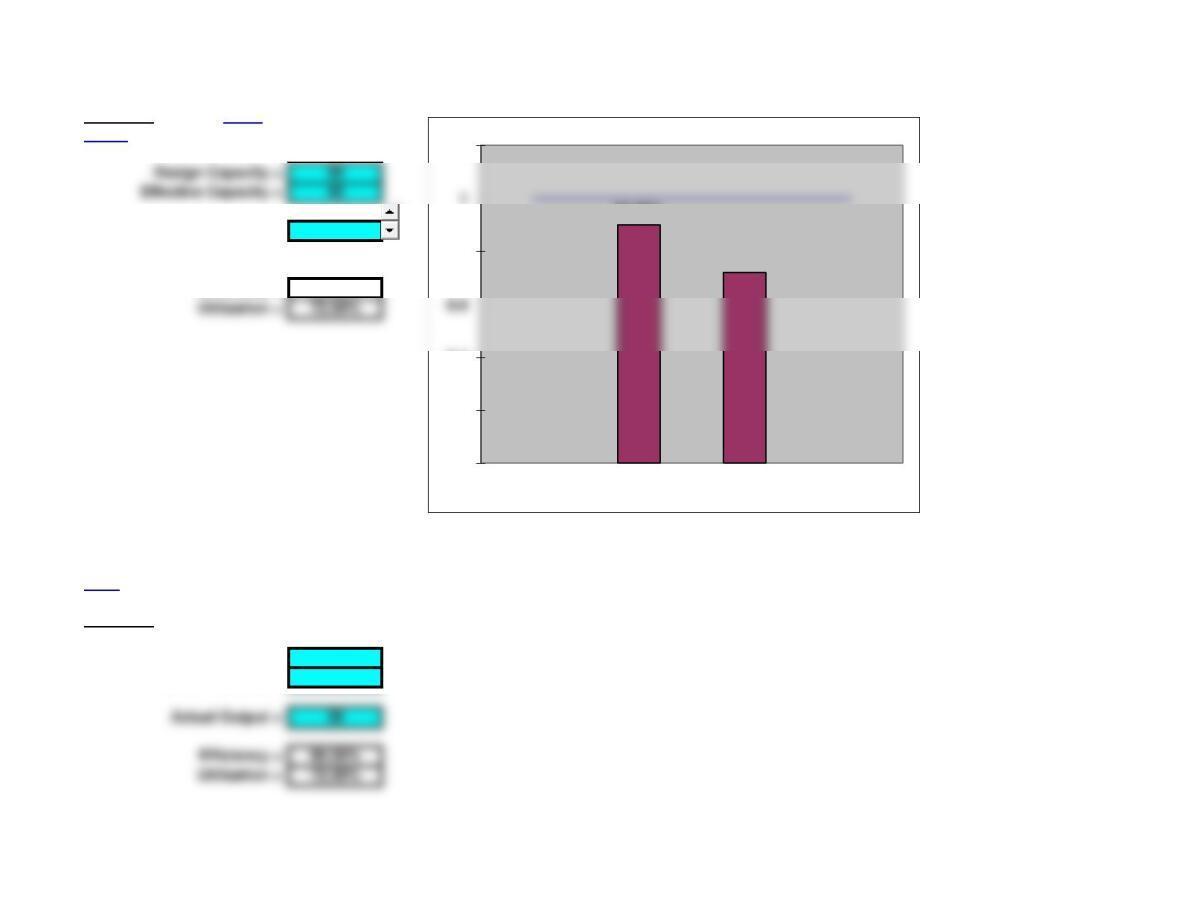
Actual Output = 36
Efficiency = 90.00% 1
Basic Template: You can simply copy the basic template below and paste into another worksheet.
^Top
Efficiency
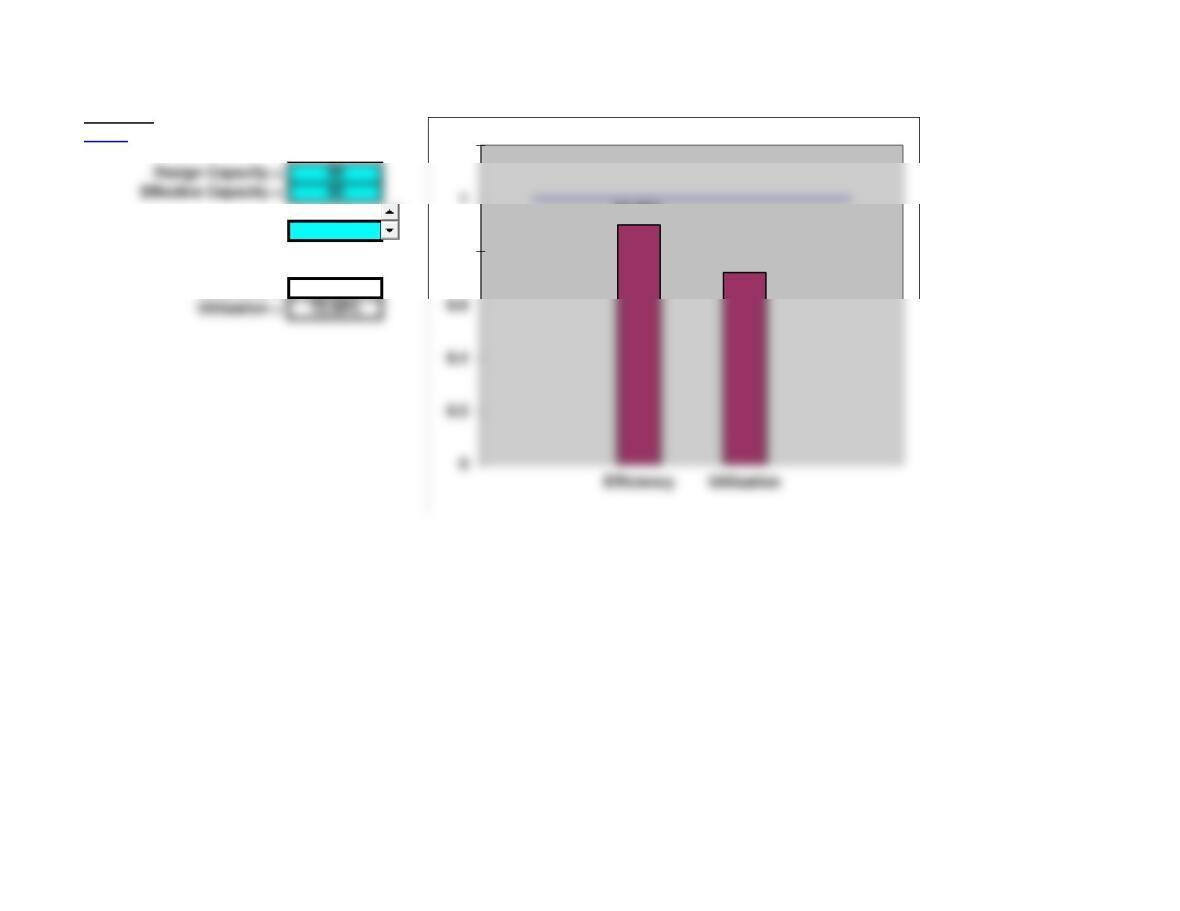
Design Capacity = 50
Effective Capacity = 40
Actual Output = 36
90.00%
72.00%
0
0.2
0.4
0.8
1.2
Efficiency Utilization
Design Capacity = 50
Effective Capacity = 40
Process Requirements Basic
<Back
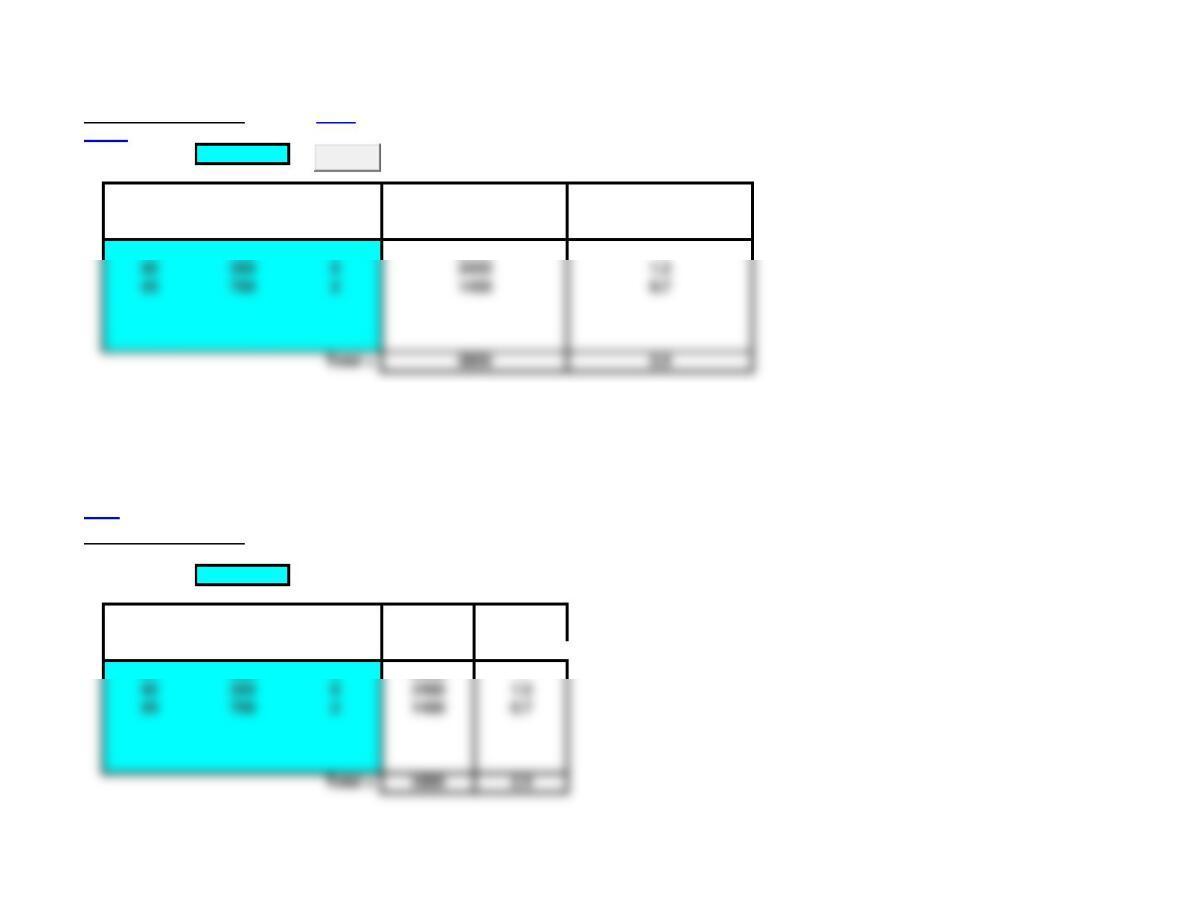
Capacity = 2000
Standard Processing
Annual Processing Time Process
Product Demand Time Needed Requirements
#1 400 52000 1
Basic Template: You can simply copy the basic template below and paste into another worksheet.
^Top
Process Requirements
Capacity = 2000
Standard Processing
Annual Processing Time Process
Product Demand Time Needed Requirements
#1 400 52000 1
#2 300 82400 1.2
#3 700 21400 0.7
Clear
#2 300 82400 1.2
#3 700 21400 0.7
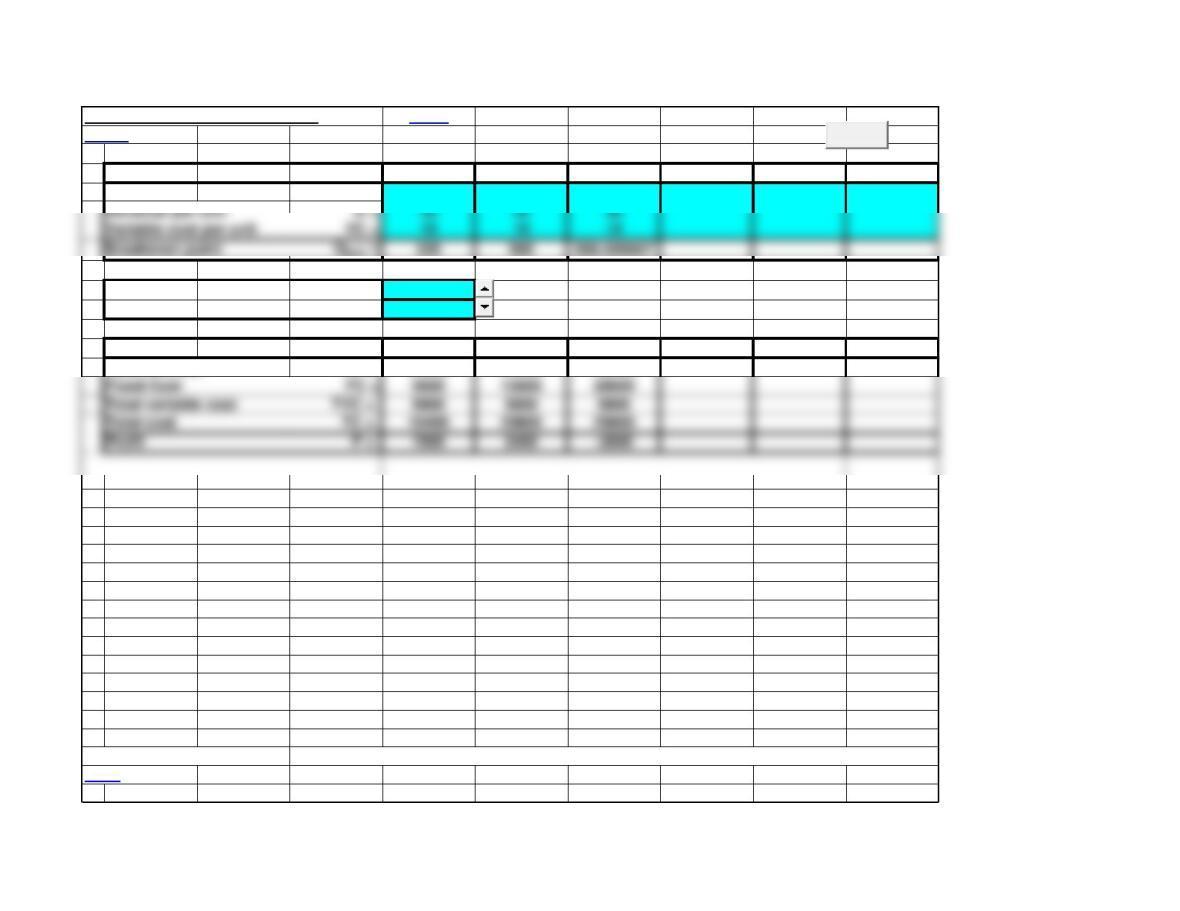
Breakeven 1
Breakeven Analysis Basic Chart Settings:
<Back Start = 0 Step = 200
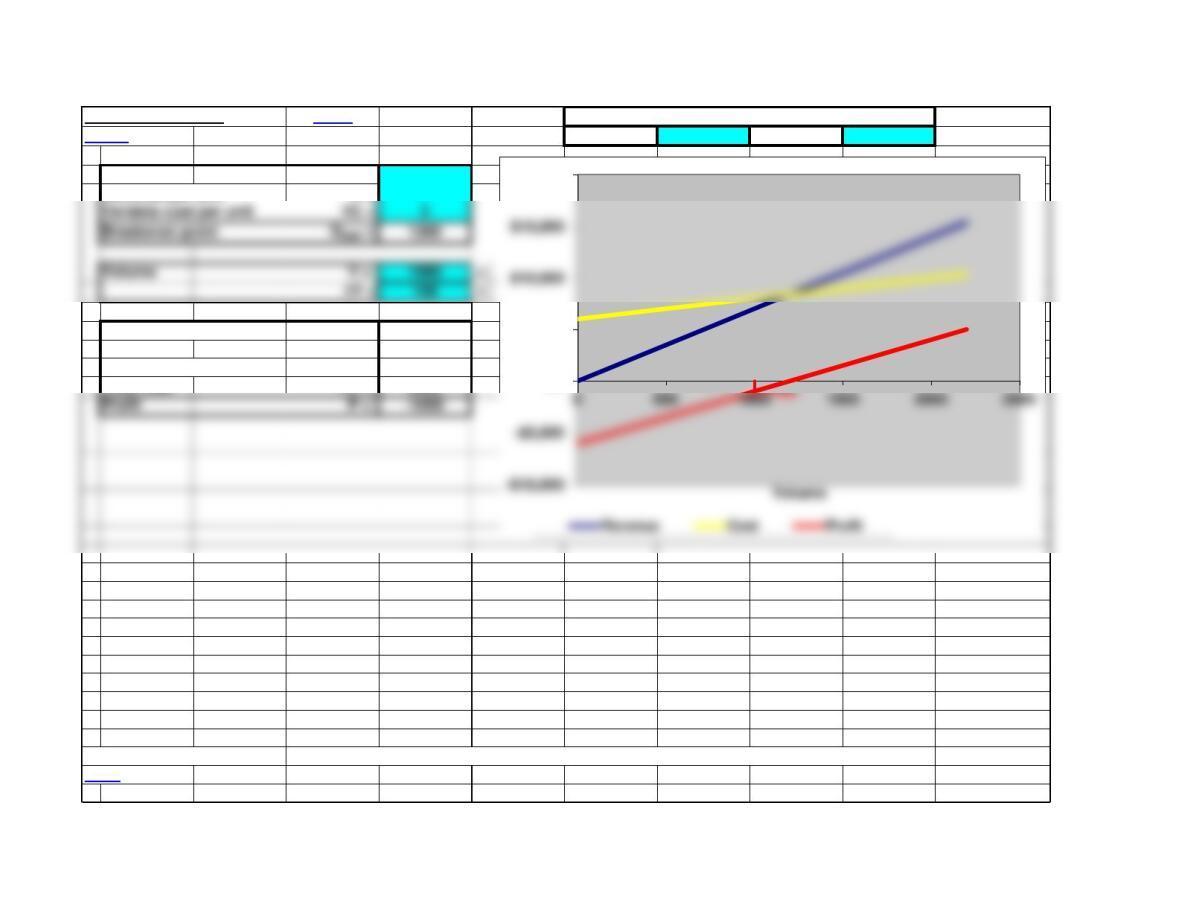
Fixed Cost FC = 6000 Volume Revenue Cost Profit
Revenue per unit R = 7 0 0 6000 -6000
1200 8400 8400 0
Total revenue TR = 7000 1400 9800 8800 1000
Fixed Cost FC = 6000 1600 11200 9200 2000
Total variable cost TVC = 2000 1800 12600 9600 3000
Total cost TC = 8000 2000 14000 10000 4000
Profit P = -1000 2200 15400 10400 5000
Basic Template: You can simply copy the basic template below and paste into another worksheet.
^Top
$0
$5,000
$20,000
Page 4
Variable cost per unit VC = 2 200 1400 6400 -5000
Volume V = 1000 800 5600 7600 -2000
Breakeven 1
Breakeven Analysis
Fixed Cost FC = 6000
Volume V = 1000
DV = 100
Total revenue TR = 7000
Fixed Cost FC = 6000
Total variable cost TVC = 2000
Total cost TC = 8000
Profit P = -1000
Page 5
Revenue per unit R = 7
Variable cost per unit VC = 2
Breakeven 2
Comparative Breakeven Analysis Basic
<Back
Process 1 2 3 4 5 6
Fixed Cost FC = 9600 15000 20000
Volume V = 580
DV = 10
Process 1 2 3 4 5 6
Total revenue TR = 23200 23200 23200
Fixed Cost FC = 9600 15000 20000
Total variable cost TVC = 5800 5800 5800
Total cost TC = 15400 20800 25800
Profit P = 7800 2400 -2600
Basic Template: You can simply copy the basic template below and paste into another worksheet.
^Top
Clear
Page 6
Revenue per unit R = 40 40 40
Variable cost per unit VC = 10 10 10
Breakeven 2
Comparative Breakeven Analysis
Process 1 2 3 4 5 6
Fixed Cost FC = 9600 15000 20000
Revenue per unit R = 40 40 40
Volume V = 580
Process 1 2 3 4 5 6
Total revenue TR = 23200 23200 23200
Fixed Cost FC = 9600 15000 20000
Total variable cost TVC = 5800 5800 5800
Total cost TC = 15400 20800 25800
Profit P = 7800 2400 -2600
Page 7
Variable cost per unit VC = 10 10 10
Lecture Suggestions – Chapter 5
<Back
Example 3: Breakeven analysis
1. Select the Example 3 worksheet.
3. You may want to demonstrate adjusting the graph settings (upper right hand corner) by entering
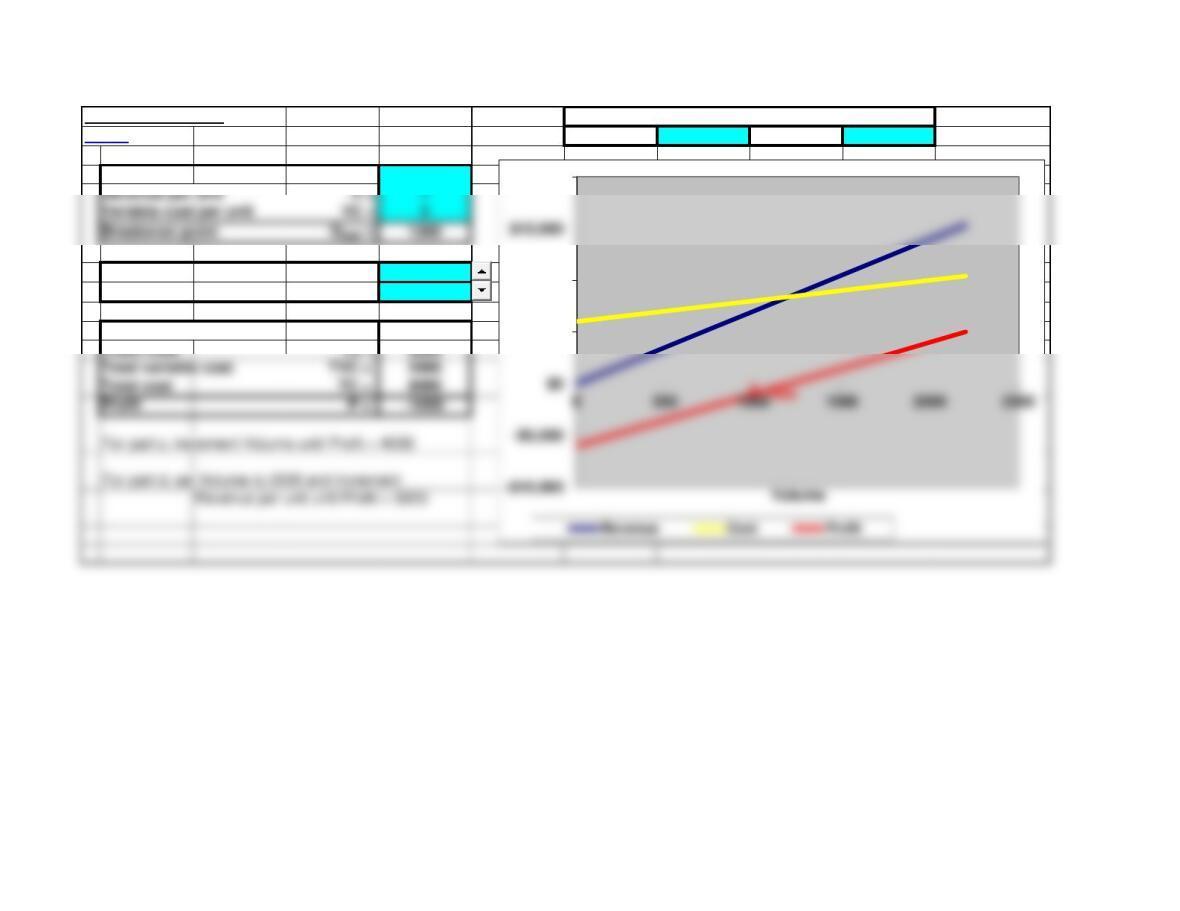
4. Part a: the template computes the breakeven point at V = 1,200. Point out on the graph that
is the point where the cost and revenue lines cross and the profit line crossed the x-axis.
5. Part b: enter the volume V = 1000 and note that the profit P = -1,000, also note that this point is
indicated on the graph.
6. Part c: enter DV = 100 and use the spinner button to change V until profit P = 4,000 at V = 2000.
2. Data: Fixed Cost = 6000
Efficiency
<Back
Actual Output = 36
Efficiency = 90.00% 1
90.00%
72.00%
0.8
1.2
Process Requirements
<Back
Capacity = 2000
Standard Processing
Annual Processing Time Process
Product Demand Time Needed Requirements
#1 400 52000 1
Clear
#2 300 82400 1.2
#3 700 21400 0.7
Example 3
Breakeven Analysis Chart Settings:
<Back Start = 0 Step = 200
Fixed Cost FC = 6000 Volume Revenue Cost Profit
600 4200 7200 -3000
Volume V = 1000 800 5600 7600 -2000
DV = 100 1000 7000 8000 -1000
1200 8400 8400 0
Total revenue TR = 7000 1400 9800 8800 1000
Fixed Cost FC = 6000 1600 11200 9200 2000
Total variable cost TVC = 2000 1800 12600 9600 3000
Total cost TC = 8000 2000 14000 10000 4000
Profit P = -1000 2200 15400 10400 5000
$5,000
$10,000
$20,000
Page 11
Revenue per unit R = 7 0 0 6000 -6000
Variable cost per unit VC = 2 200 1400 6400 -5000