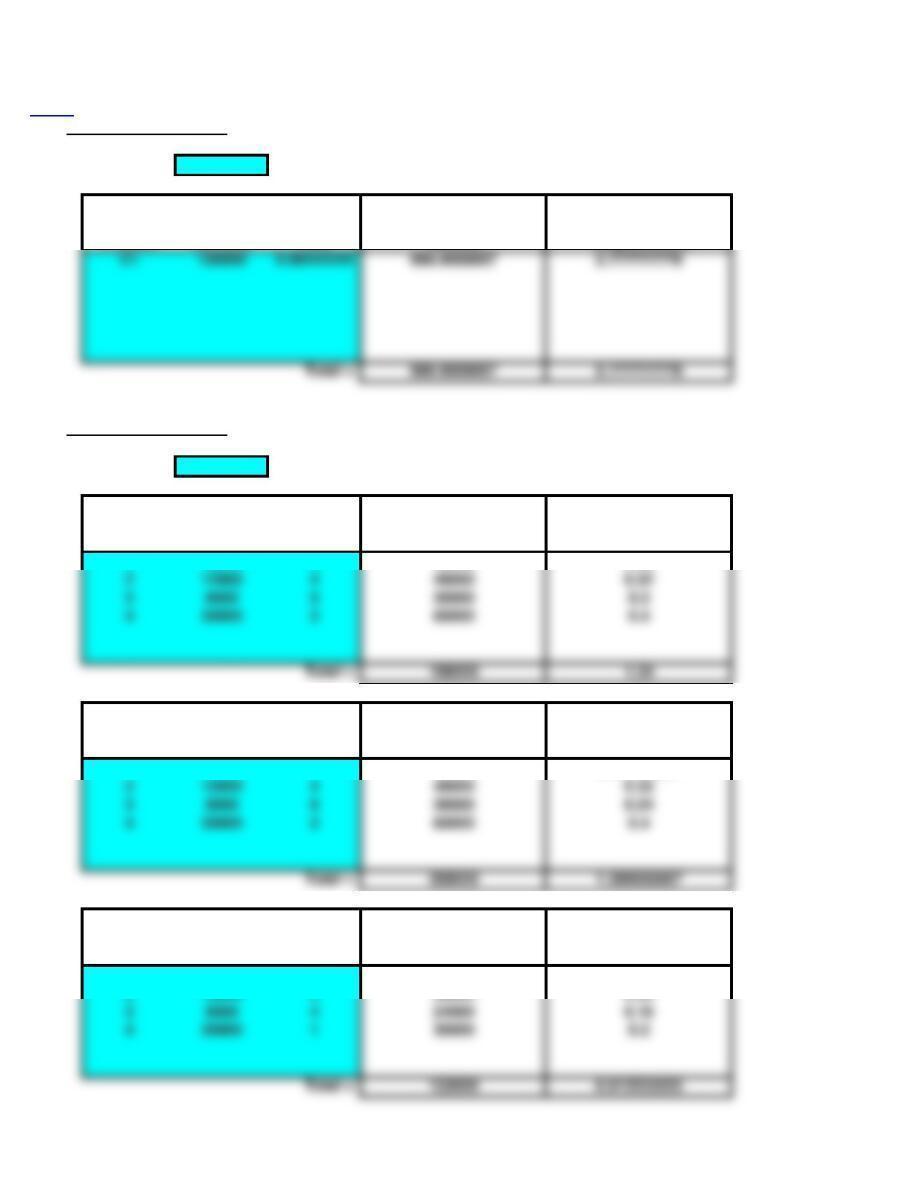
Example 4
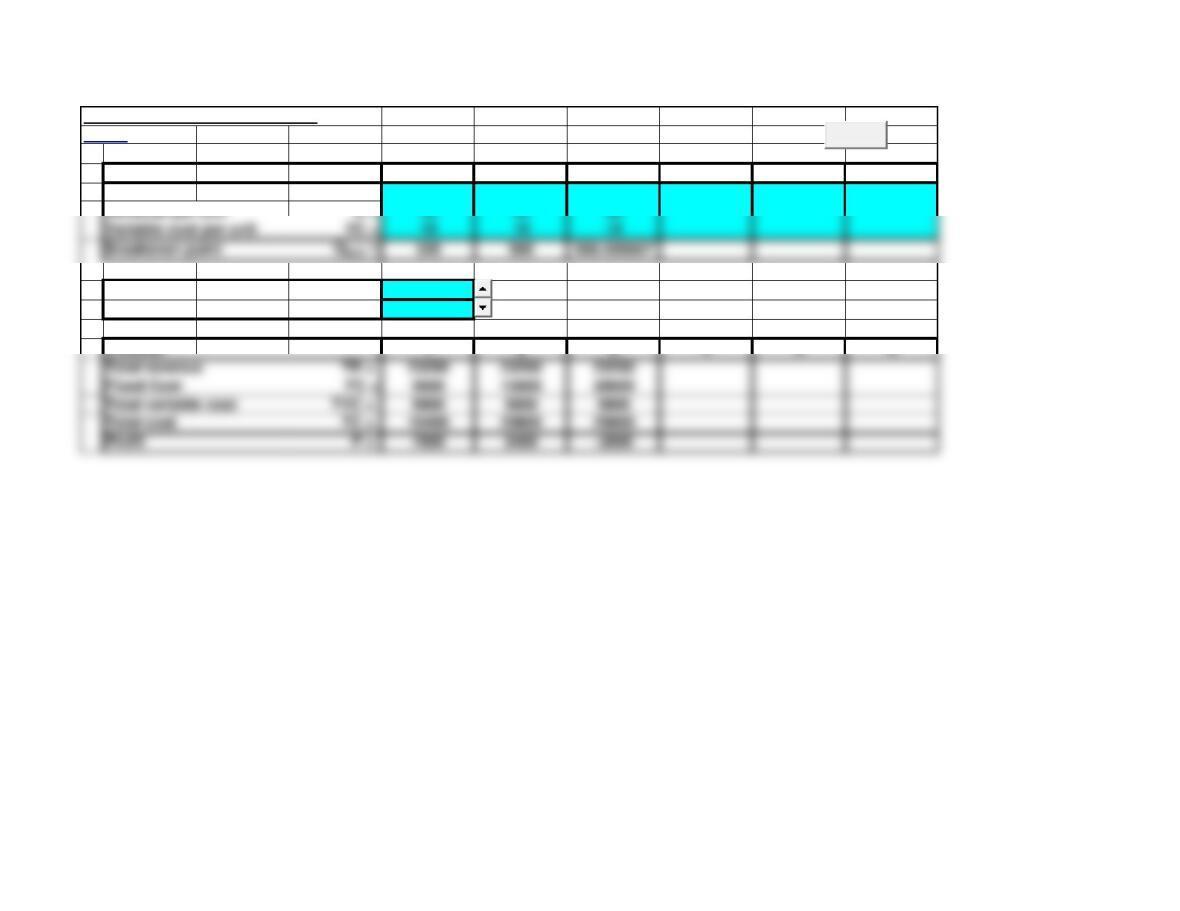
Comparative Breakeven Analysis
<Back
Process 1 2 3 4 5 6
Fixed Cost FC = 9600 15000 20000
Revenue per unit R = 40 40 40
Volume V = 580
DV = 10
Process 1 2 3 4 5 6
Total revenue TR = 23200 23200 23200
Fixed Cost FC = 9600 15000 20000
Total variable cost TVC = 5800 5800 5800
Total cost TC = 15400 20800 25800
Profit P = 7800 2400 -2600
Clear
Page 12
Variable cost per unit VC = 10 10 10
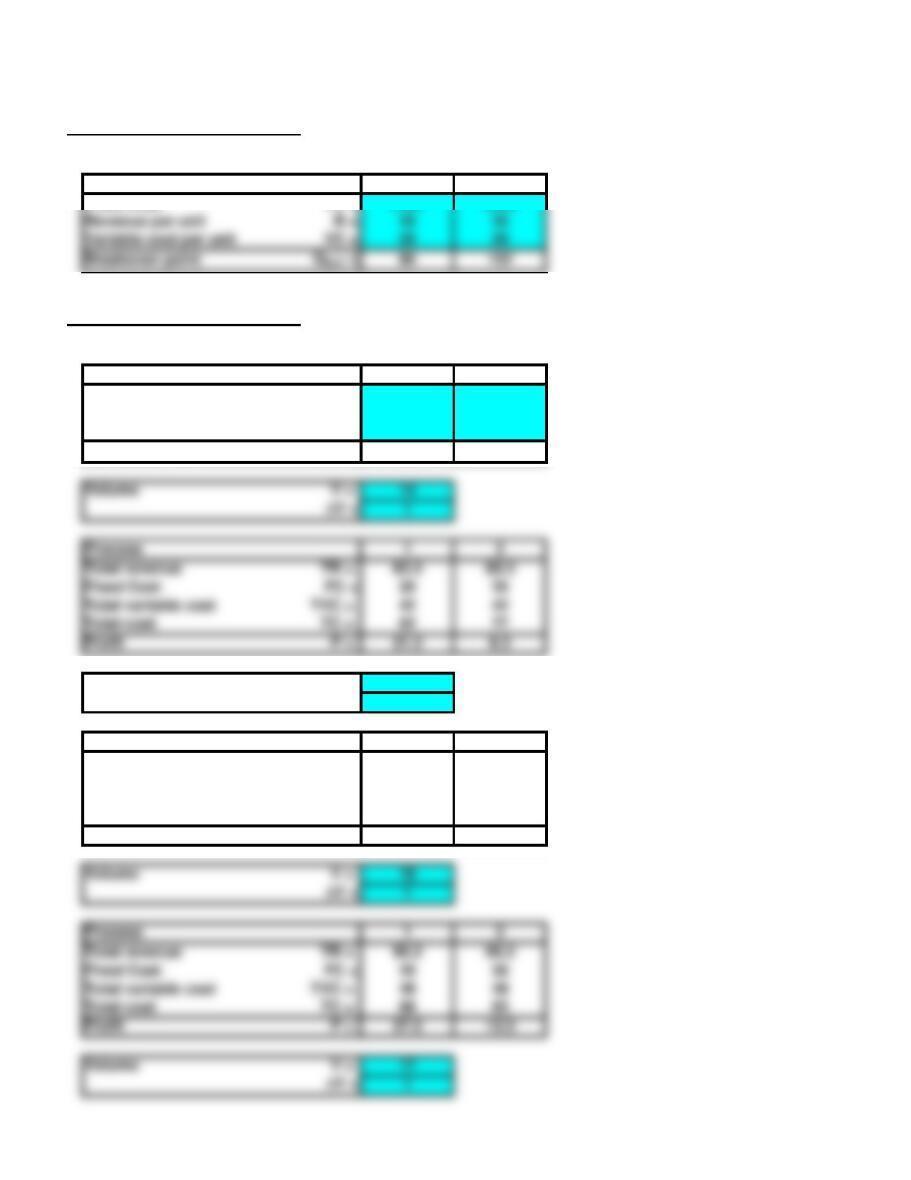
Solved Problem 1
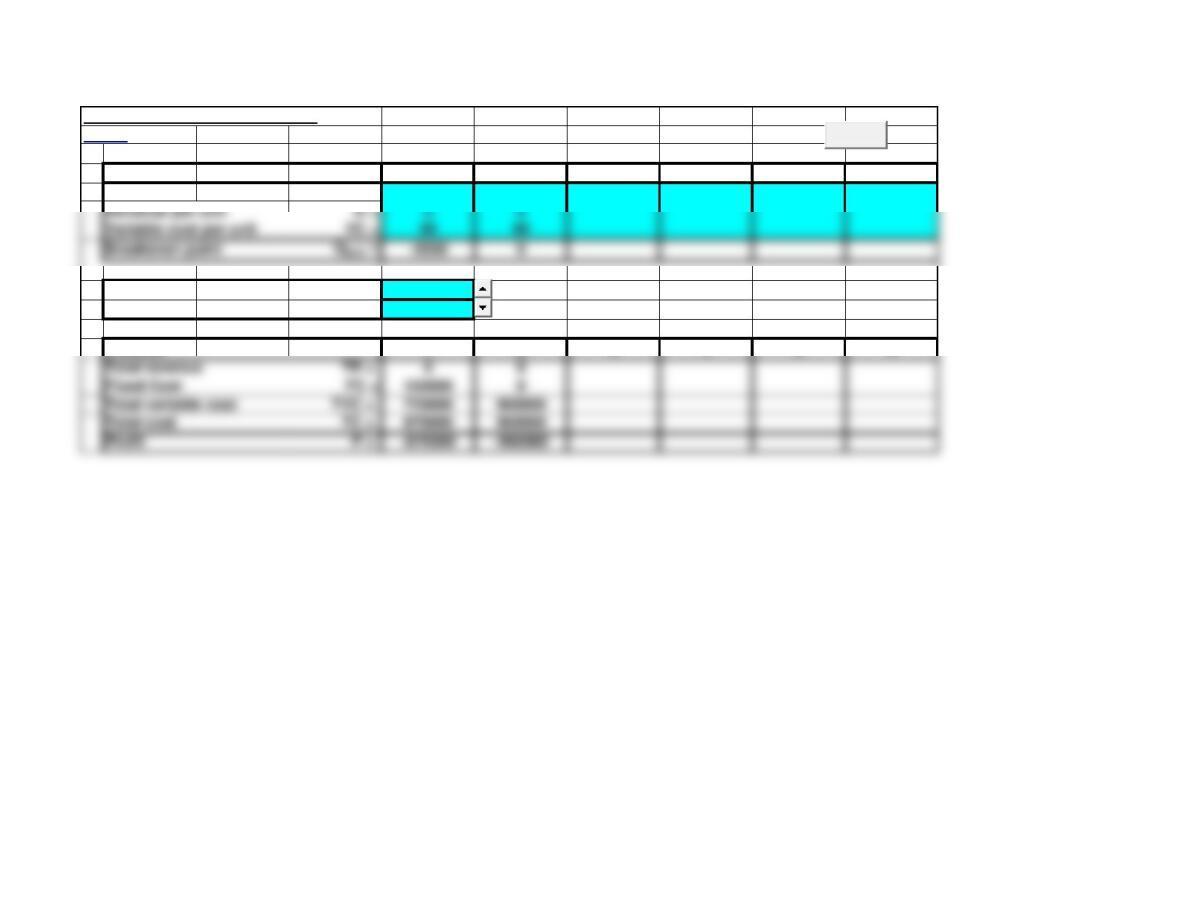
Comparative Breakeven Analysis
<Back
Process 1 2 3 4 5 6
Fixed Cost FC = 150000 0
Volume V = 12000
DV = 1500
Process 1 2 3 4 5 6
Total revenue TR = 0 0
Fixed Cost FC = 150000 0
Total variable cost TVC = 720000 960000
Total cost TC = 870000 960000
Profit P = -870000 -960000
Clear
Page 13
Revenue per unit R = 0 0
Variable cost per unit VC = 60 80
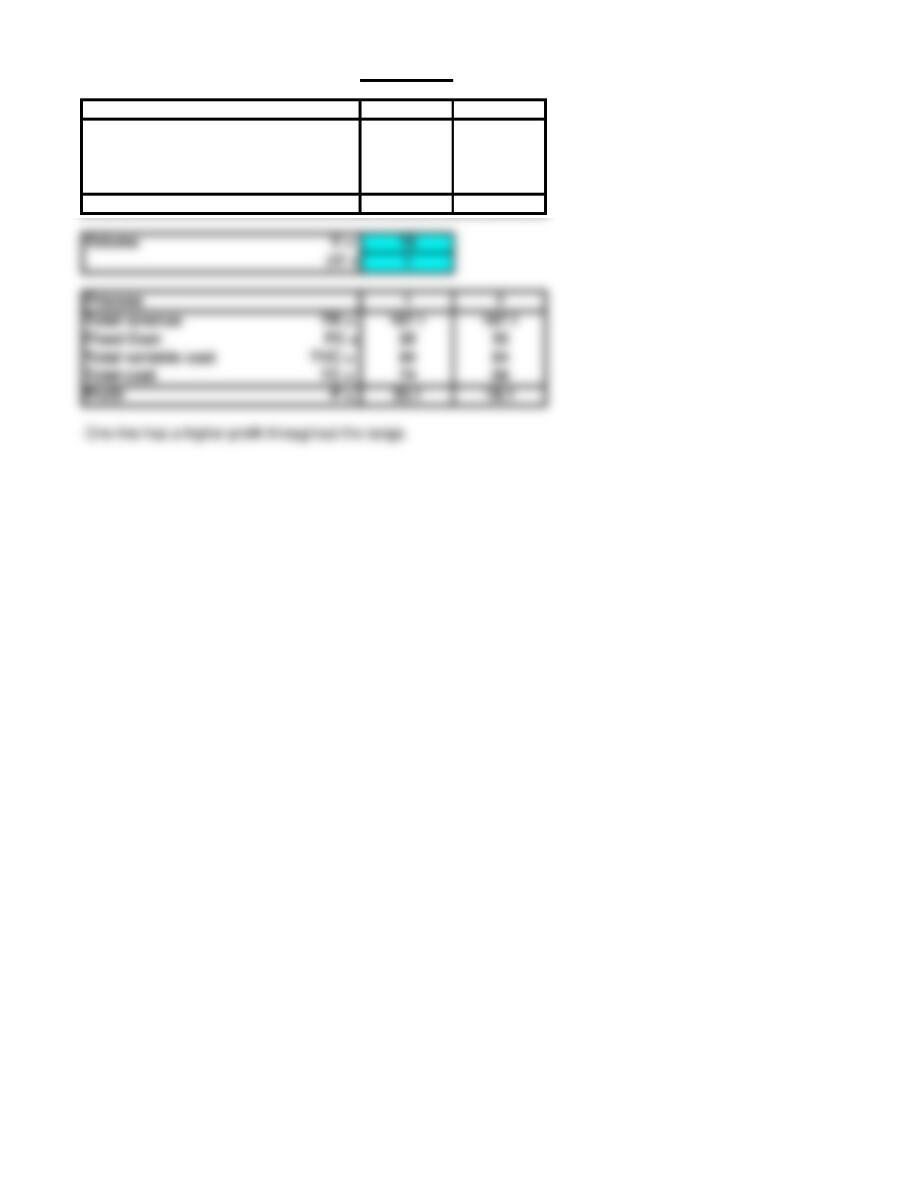
Solved Problem 2
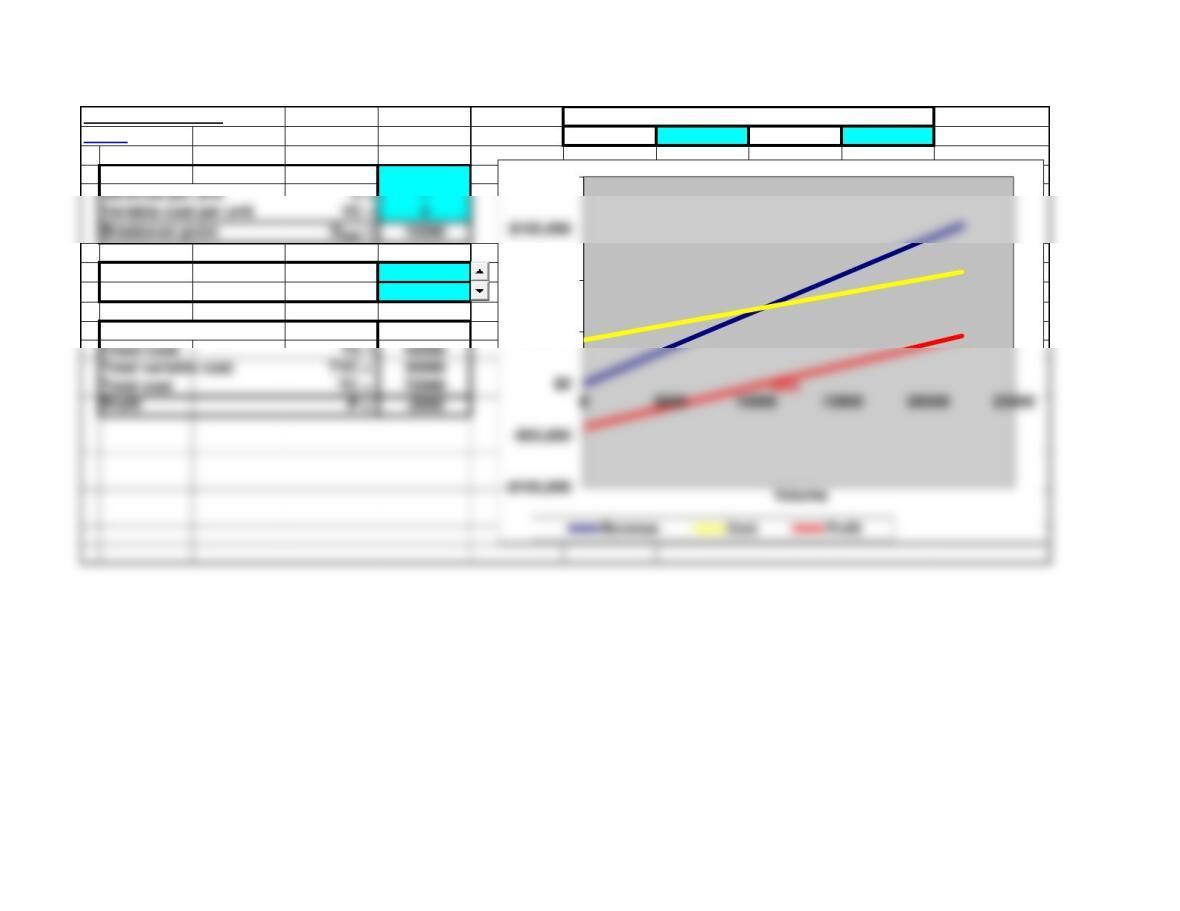
Breakeven Analysis Chart Settings:
<Back Start = 0 Step = 2000
Fixed Cost FC = 42000 Volume Revenue Cost Profit
6000 42000 60000 -18000
Volume V = 10000 8000 56000 66000 -10000
DV = 1000 10000 70000 72000 -2000
12000 84000 78000 6000
Total revenue TR = 70000 14000 98000 84000 14000
Fixed Cost FC = 42000 16000 112000 90000 22000
Total variable cost TVC = 30000 18000 126000 96000 30000
Total cost TC = 72000 20000 140000 102000 38000
Profit P = -2000 22000 154000 108000 46000
$50,000
$100,000
$200,000
Page 14
Revenue per unit R = 7 0 0 42000 -42000
Variable cost per unit VC = 3 2000 14000 48000 -34000
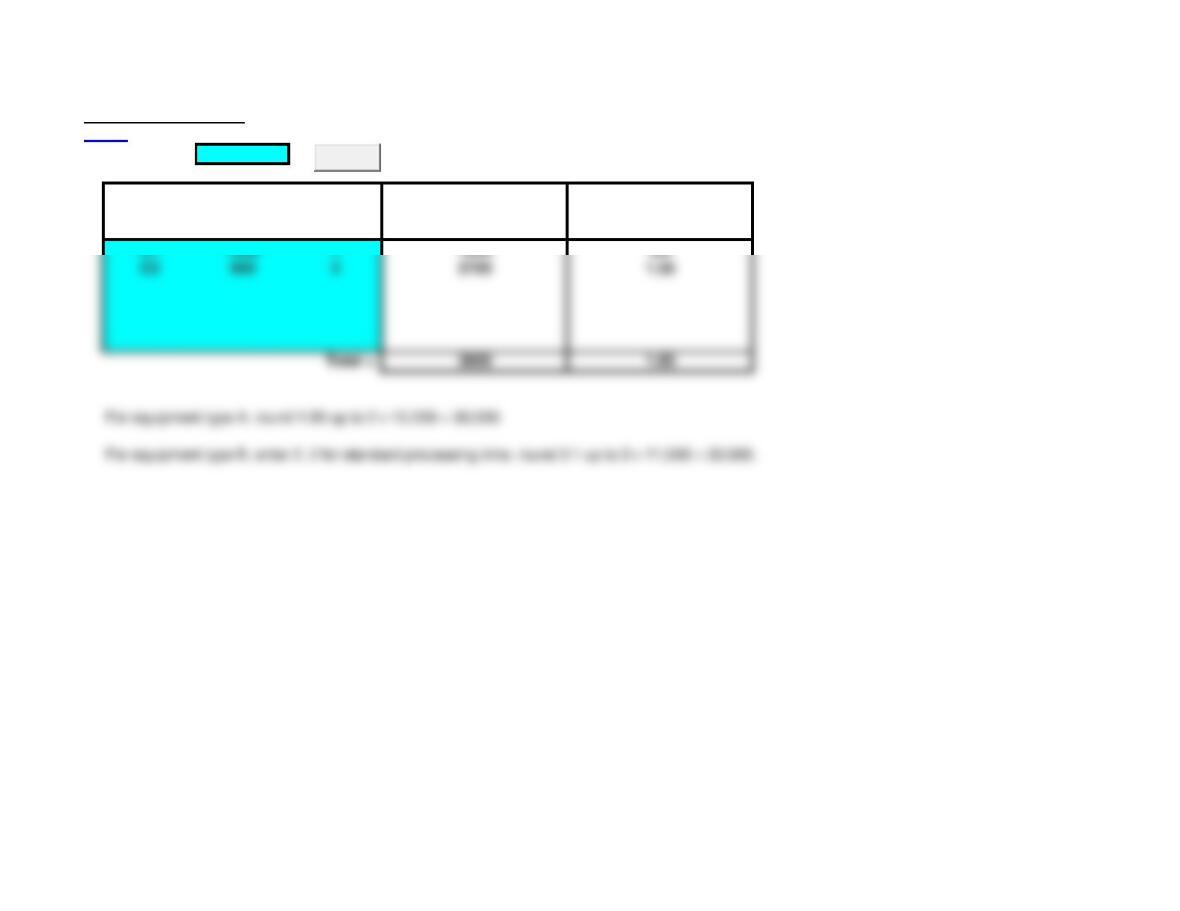
Process Requirements
<Back
Capacity = 2000
Standard Processing
Annual Processing Time Process
Product Demand Time Needed Requirements
Clear
Chapter 5 – Problems 1-8 Note: This worksheet displays results only, you must copy the shaded
<Back
area into the corresponding template to make additional calculations.
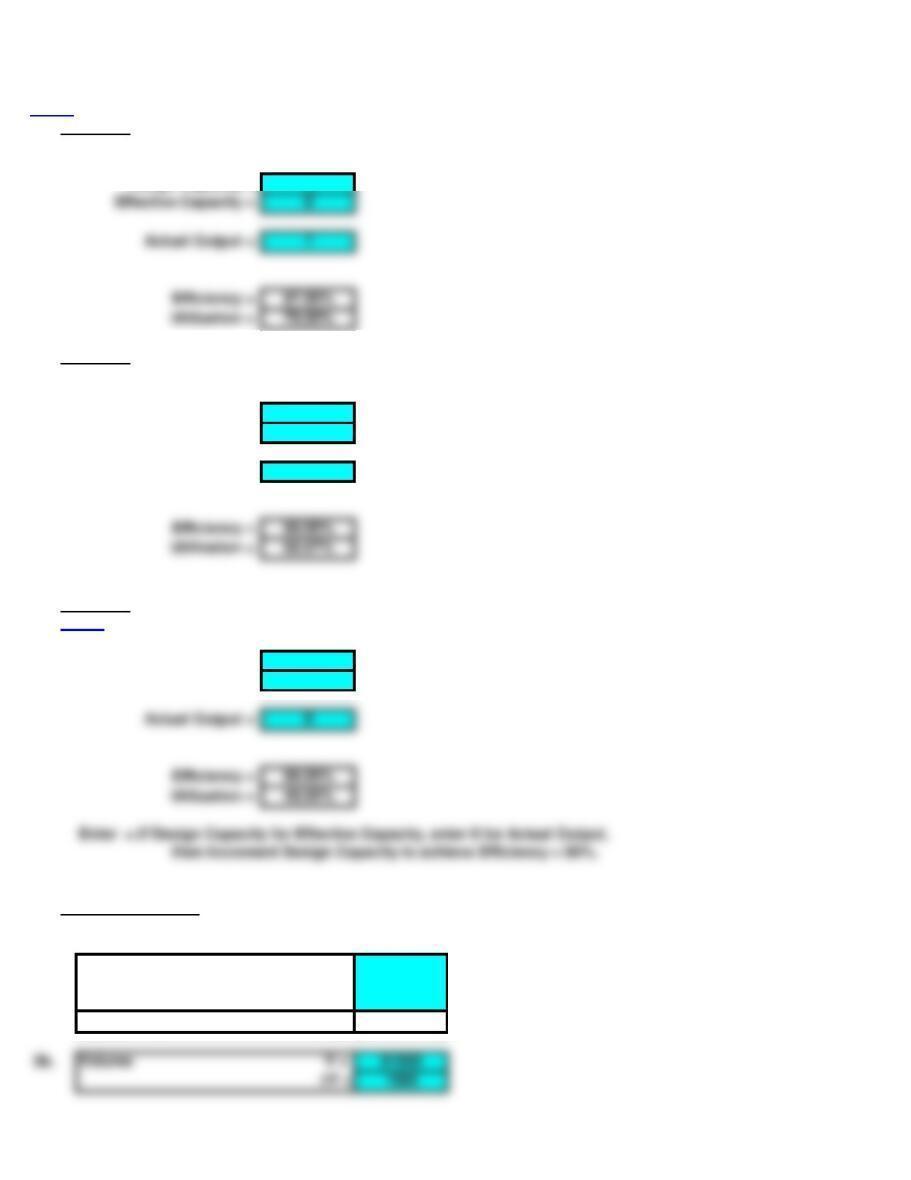
1a. Efficiency
Design Capacity = 10
1b. Efficiency
Design Capacity = 6
Effective Capacity = 5
Actual Output = 4
2. Efficiency
<Back
Design Capacity = 20
Effective Capacity = 10
Actual Output = 8
Enter =.5*Design Capacity for Effective Capacity, enter 8 for Actual Output,
Breakeven Analysis
3a. Fixed Cost FC = 9200
Revenue per unit R = 0.9
Variable cost per unit VC = 0.7
Breakeven point
QBEP = 46000
Effective Capacity = 8
Actual Output = 7
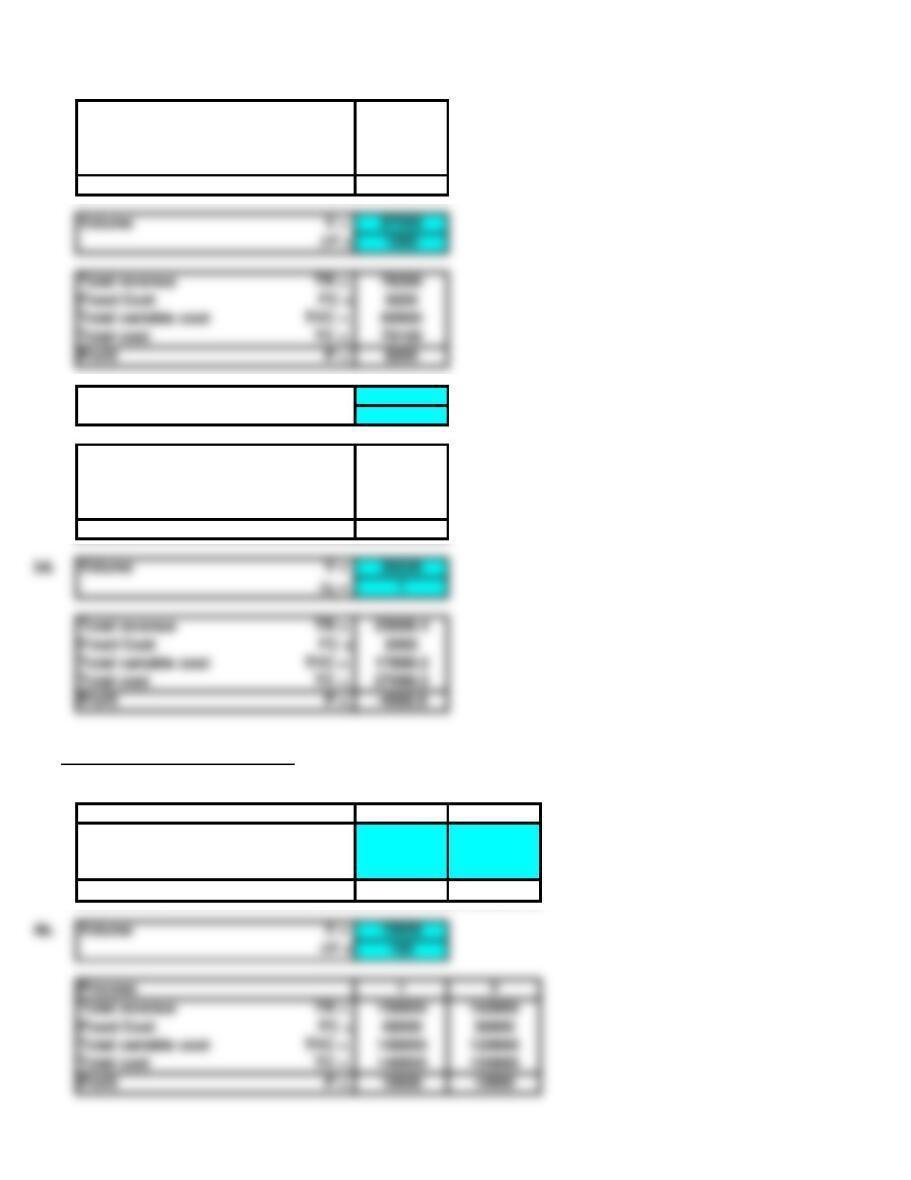
Total revenue TR = 54900
Fixed Cost FC = 9200
Total variable cost TVC = 42700
Total cost TC = 51900
Profit P = 3000
3c. Volume V = 126000
DV = 1000
Total revenue TR = 113400
Fixed Cost FC = 9200
Total variable cost TVC = 88200
Total cost TC = 97400
Profit P = 16000
Total revenue TR = 23000.4
Fixed Cost FC = 9200
Total variable cost TVC = 17889.2
Total cost TC = 27089.2
Profit P = -4088.8
4a. Comparative Breakeven Analysis
Process 1 2
Fixed Cost FC = 40000 30000
Revenue per unit R = 15 16
Variable cost per unit VC = 10 12
Breakeven point
QBEP = 8000 7500
DV = 100
Process 1 2
Total revenue TR = 150000 160000
Fixed Cost FC = 40000 30000
Total variable cost TVC = 100000 120000
Volume V = 87000
DV = 1000
Total revenue TR = 78300
Fixed Cost FC = 9200
Total variable cost TVC = 60900
Total cost TC = 70100
4c. Volume V = 12000
DV = 1000
Process 1 2
Total revenue TR = 180000 192000
Fixed Cost FC = 40000 30000
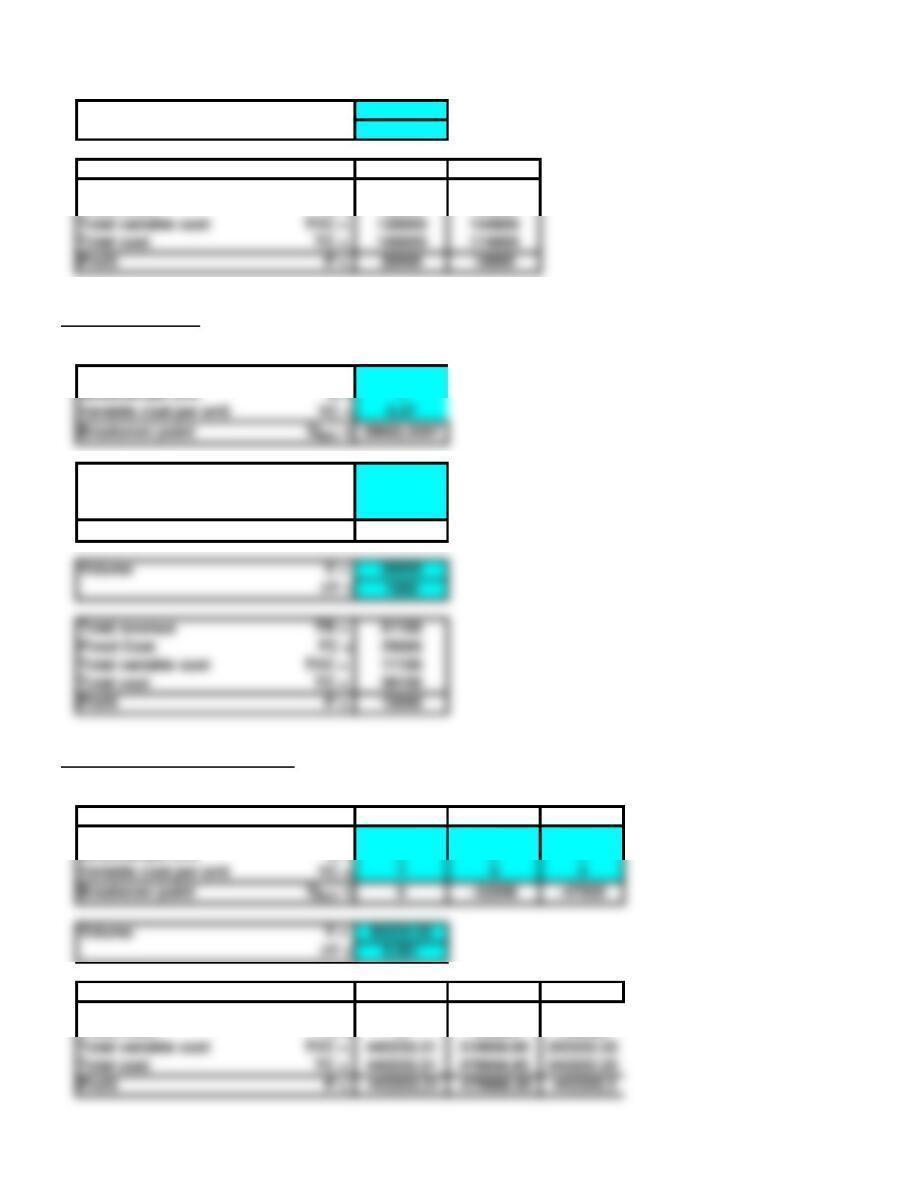
5a. Breakeven Analysis
Fixed Cost FC = 25000
Revenue per unit R = 1
Variable cost per unit VC = 0.37
QBEP = 39682.5397
5b. Fixed Cost FC = 25000
Revenue per unit R = 1.70333333
Variable cost per unit VC = 0.37
Breakeven point
QBEP = 18750
Volume V = 30000
DV = 1000
Total revenue TR = 51100
Fixed Cost FC = 25000
Total variable cost TVC = 11100
Total cost TC = 36100
Profit P = 15000
7. Comparative Breakeven Analysis
Process 1 2 3
Fixed Cost FC = 0 160000 190000
Revenue per unit R = 0 0 0
Variable cost per unit VC = 7 5 4
QBEP = 0 -32000 -47500
Volume V = 63333.33
DV = 0.001
Process 1 2 3
Total revenue TR = 0 0 0
Fixed Cost FC = 0 160000 190000
Total variable cost TVC = 443333.31 316666.65 253333.32
Total variable cost TVC = 120000 144000
Total cost TC = 160000 174000
Profit P = 20000 18000
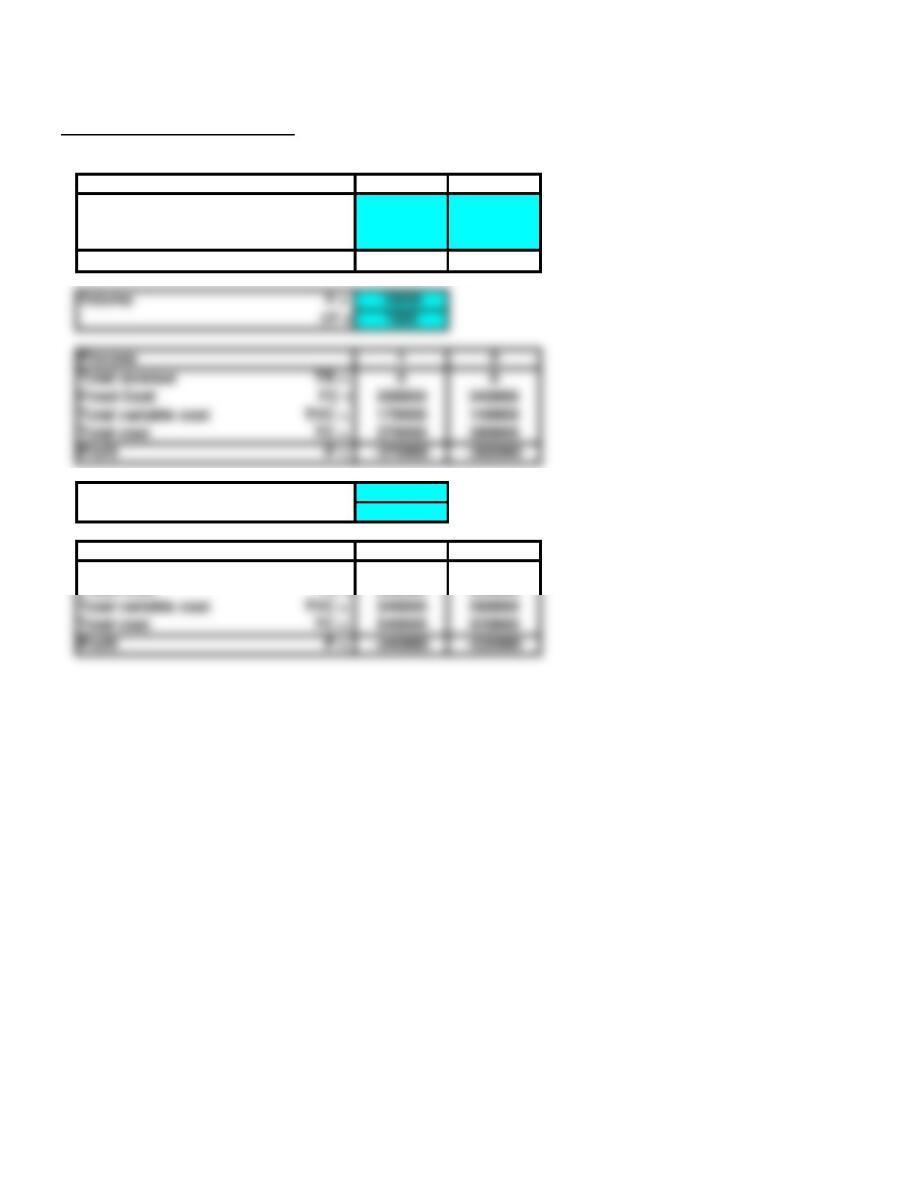
8. Comparative Breakeven Analysis
Process 1 2
Fixed Cost FC = 200000 240000
Revenue per unit R = 0 0
Variable cost per unit VC = 17 14
Breakeven point
QBEP = -11764.7059 -17142.8571
Volume V = 20000
DV = 1000
Process 1 2
Total revenue TR = 0 0
Fixed Cost FC = 200000 240000
Total variable cost TVC = 340000 280000
Total cost TC = 540000 520000
Profit P = -540000 -520000
Volume V = 10000
DV = 1000
Total revenue TR = 0 0
Fixed Cost FC = 200000 240000
Total variable cost TVC = 170000 140000
Total cost TC = 370000 380000
Profit P = -370000 -380000
Chapter 5 – Problems 9-12 Note: This worksheet displays results only, you must copy the shaded
<Back area into the corresponding template to make additional calculations.
9. Process Requirements
Capacity = 240
Standard Processing
Annual Processing Time Process
Product Demand Time Needed Requirements
10a. Process Requirements
Capacity = 150000
Standard Processing
Annual Processing Time Process
Product Demand Time Needed Requirements
116000 348000 0.32
212000 448000 0.32
430000 260000 0.4
Standard Processing
Annual Processing Time Process
Product Demand Time Needed Requirements
116000 464000 0.426666667
212000 448000 0.32
430000 260000 0.4
Standard Processing
Annual Processing Time Process
Product Demand Time Needed Requirements
116000 232000 0.213333333
212000 336000 0.24
430000 130000 0.2
11. Comparative Breakeven Analysis
Process 1 2
Fixed Cost FC = 2000 3800
12. Comparative Breakeven Analysis
Process 1 2
Fixed Cost FC = 20 35
Revenue per unit R = 5.95 5.95
Variable cost per unit VC = 3 3
Breakeven point
QBEP = 6.77966102 11.8644068
Volume V = 14
DV = 1
Process 1 2
Total revenue TR = 83.3 83.3
Fixed Cost FC = 20 35
Total variable cost TVC = 42 42
Total cost TC = 62 77
Profit P = 21.3 6.3
Volume V = 15
DV = 1
Process 1 2
Total revenue TR = 89.25 89.25
Fixed Cost FC = 20 35
Total variable cost TVC = 45 45
Total cost TC = 65 80
Profit P = 24.25 9.25
Volume V = 16
DV = 1
Process 1 2
Total revenue TR = 95.2 95.2
Fixed Cost FC = 20 35
Total variable cost TVC = 48 48
Total cost TC = 68 83
Revenue per unit R = 45 45
Variable cost per unit VC = 20 20
QBEP = 80 152
Process 1 2
Total revenue TR = 101.15 101.15
Fixed Cost FC = 20 35
Total variable cost TVC = 51 51
Total cost TC = 71 86
Profit P = 30.15 15.15
Volume V = 18
Total revenue TR = 107.1 107.1
Fixed Cost FC = 20 35
Total cost TC = 74 89
Profit P = 33.1 18.1