5-1
5 LINEAR EQUATIONS AND GRAPHS
EXERCISE 5-1
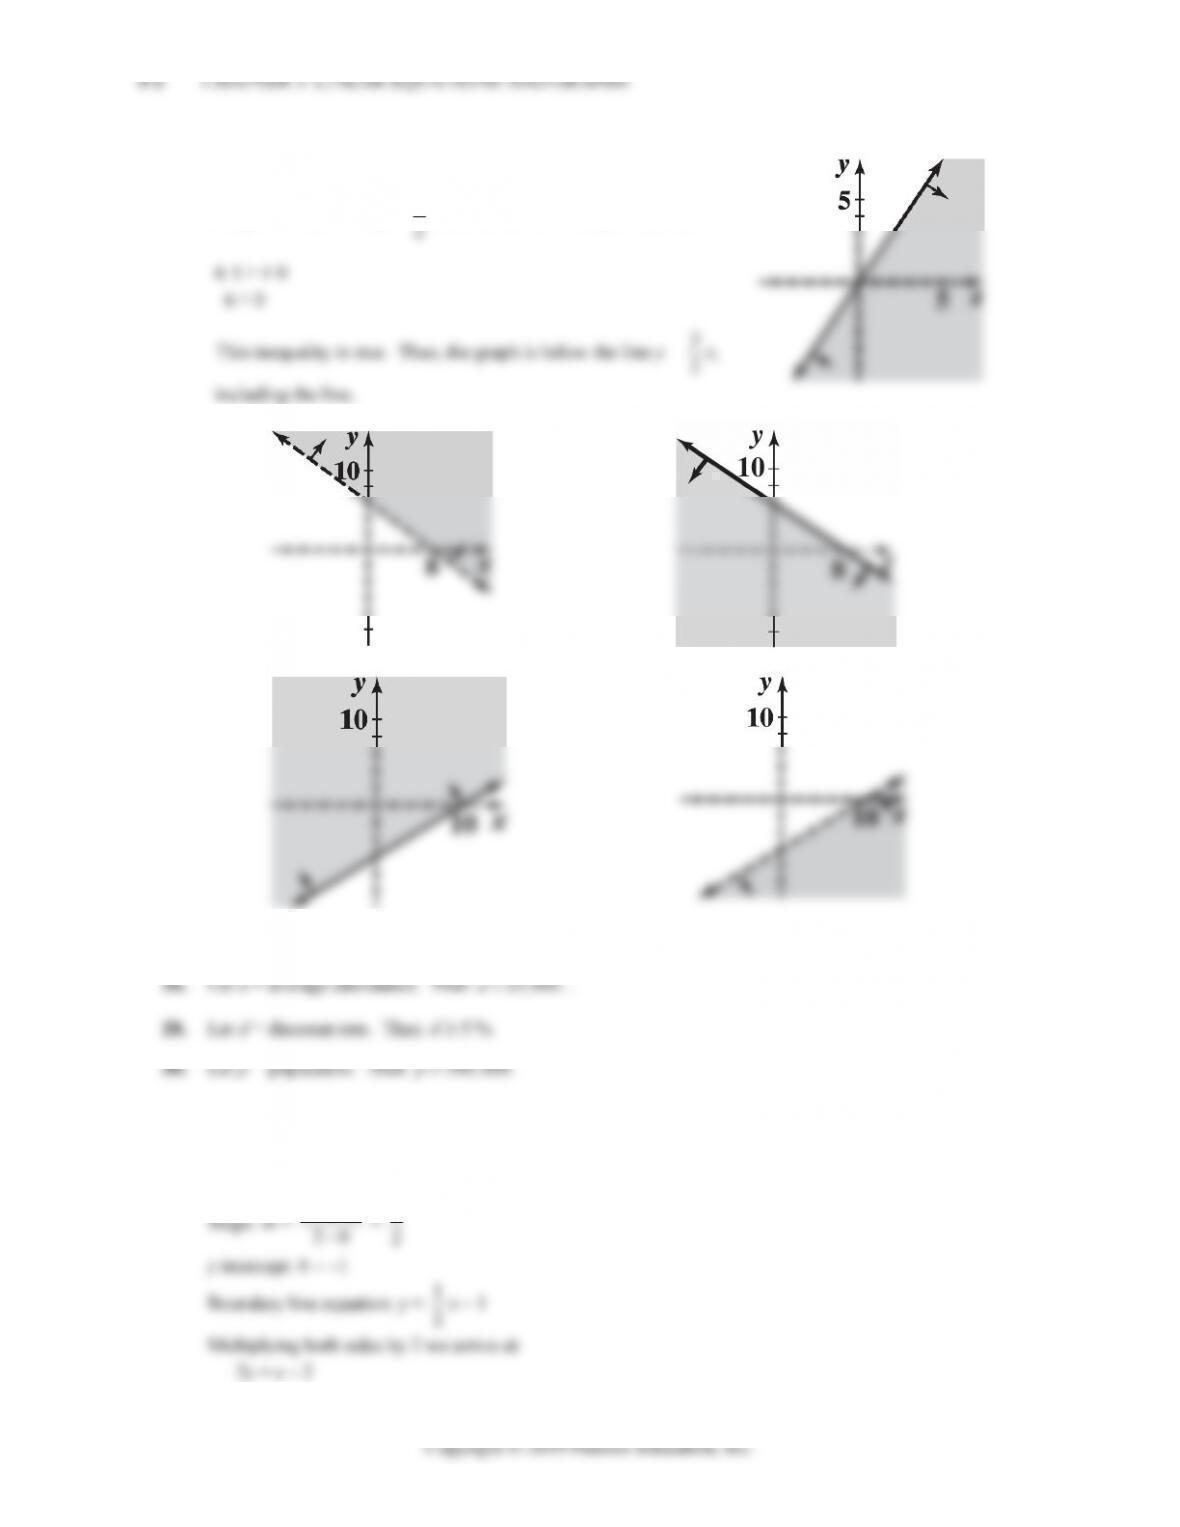
10. y > x + 1
Graph y = x + 1 as a broken line.
x
y
12. 2x – 5y ≤ 10
Graph the line 2x – 5y = 10 as a solid line.
Test point (0, 0):
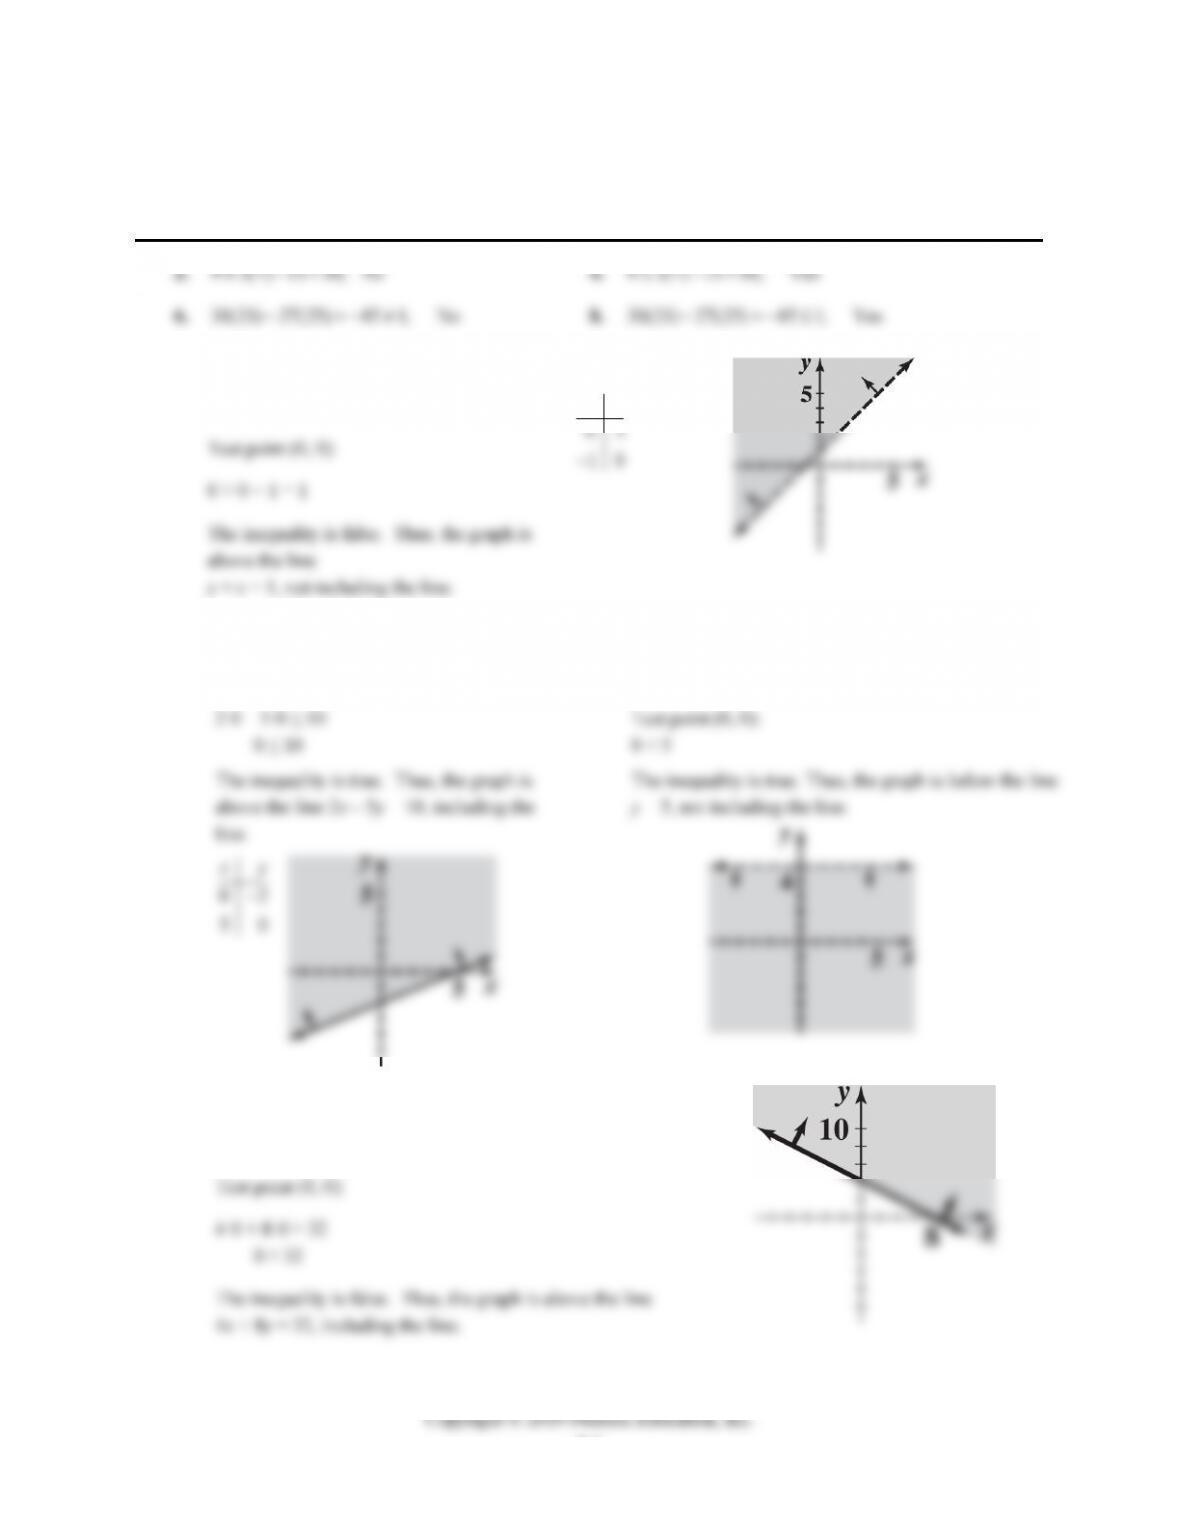
14. y < 5
Graph y = 5 [the horizontal line through (0, 5)] as a
broken line.
x
16. 4x + 8y ≥ 32
Graph 4x + 8y = 32 as a solid line.
Test point (0, 0):
4·0 + 8·0 ≥ 32
0 ≥ 32
The inequality is false. Thus, the graph is above the line
4x + 8y = 32, including the line.
EXERCISE 5-1 5-3
Copyright © 2019 Pearson Education, Inc.
or x – 2y = 2
Since (0, 0) is not in the shaded area and the boundary line is not solid, we have:
x – 2y > 2.
36. The boundary line passes through the point (–2, 0) and is parallel to the y axis. So, its equation is:
38. The boundary line passes through the points (0, 0) and (–1, 4).
We only need its slope, since it passes through the origin.
42. Let x = number of percentage points won by Democrat; let y = number of percentage points won by
46.
50.
52.
5-4 CHAPTER 5: LINEAR EQUATIONS AND GRAPHS
54.
56. Let x = number of acres planted with corn.
Let y = number of acres planted with soybeans.
120x + 100y ≤ 15,000, x ≥ 0, y ≥ 0
58. Let x = the number of pounds of brand A.
(B) 0.12x + 0.15y ≤ 60,
60. Let x = number of pounds of the standard blend.
Let y = number of pounds of the deluxe blend.
0, 0
xy
62.
Let x = number of weeks Plant A is operated.
Let y = number of weeks Plant B is operated.
EXERCISE 5-2 5-5
64. Let x = number of radio spots.
Let y = number of newspapers ads.
66. Let x = number of regular mattresses
covered per day.
EXERCISE 5-2
2. 4(4) 5 21 20; No
6. 5(5) 3 28 32, 7(5) 4(3) 47 45, 0, 0;xy Yes
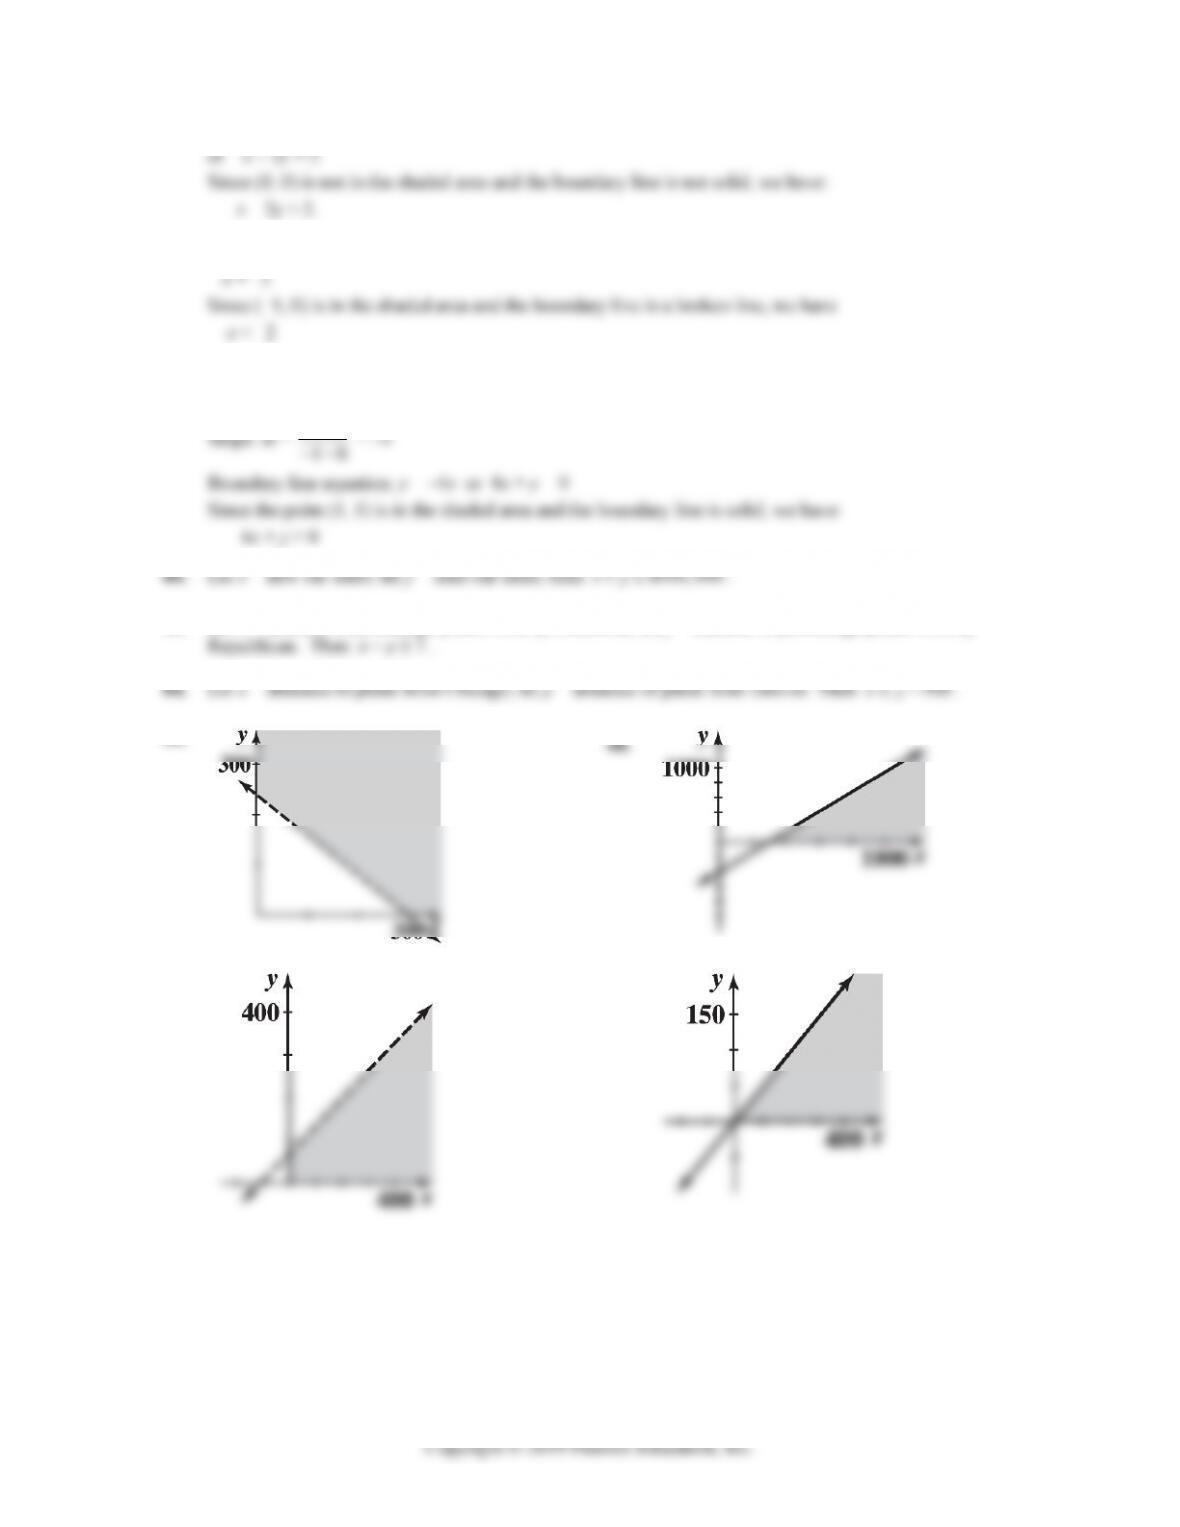
10. The graph of x + 2y ≥ 8 is the region above the line x + 2y = 8
[e.g., (0, 0) does not satisfy the inequality]. The graph of
12. The graph of x + 2y ≤ 8 is the region below the line x + 2y = 8
14.
5-6 CHAPTER 5: LINEAR EQUATIONS AND GRAPHS
16.
18. The graph of x + 3y ≤ 18 is the region below the line x + 3y = 18 and the graph of 2x + y ≤ 16 is the region
20. The graph of x + 3y ≥ 18 is the region above the line x + 3y = 18
22. Unbounded 24. Unbounded
26. Unbounded 28. Bounded
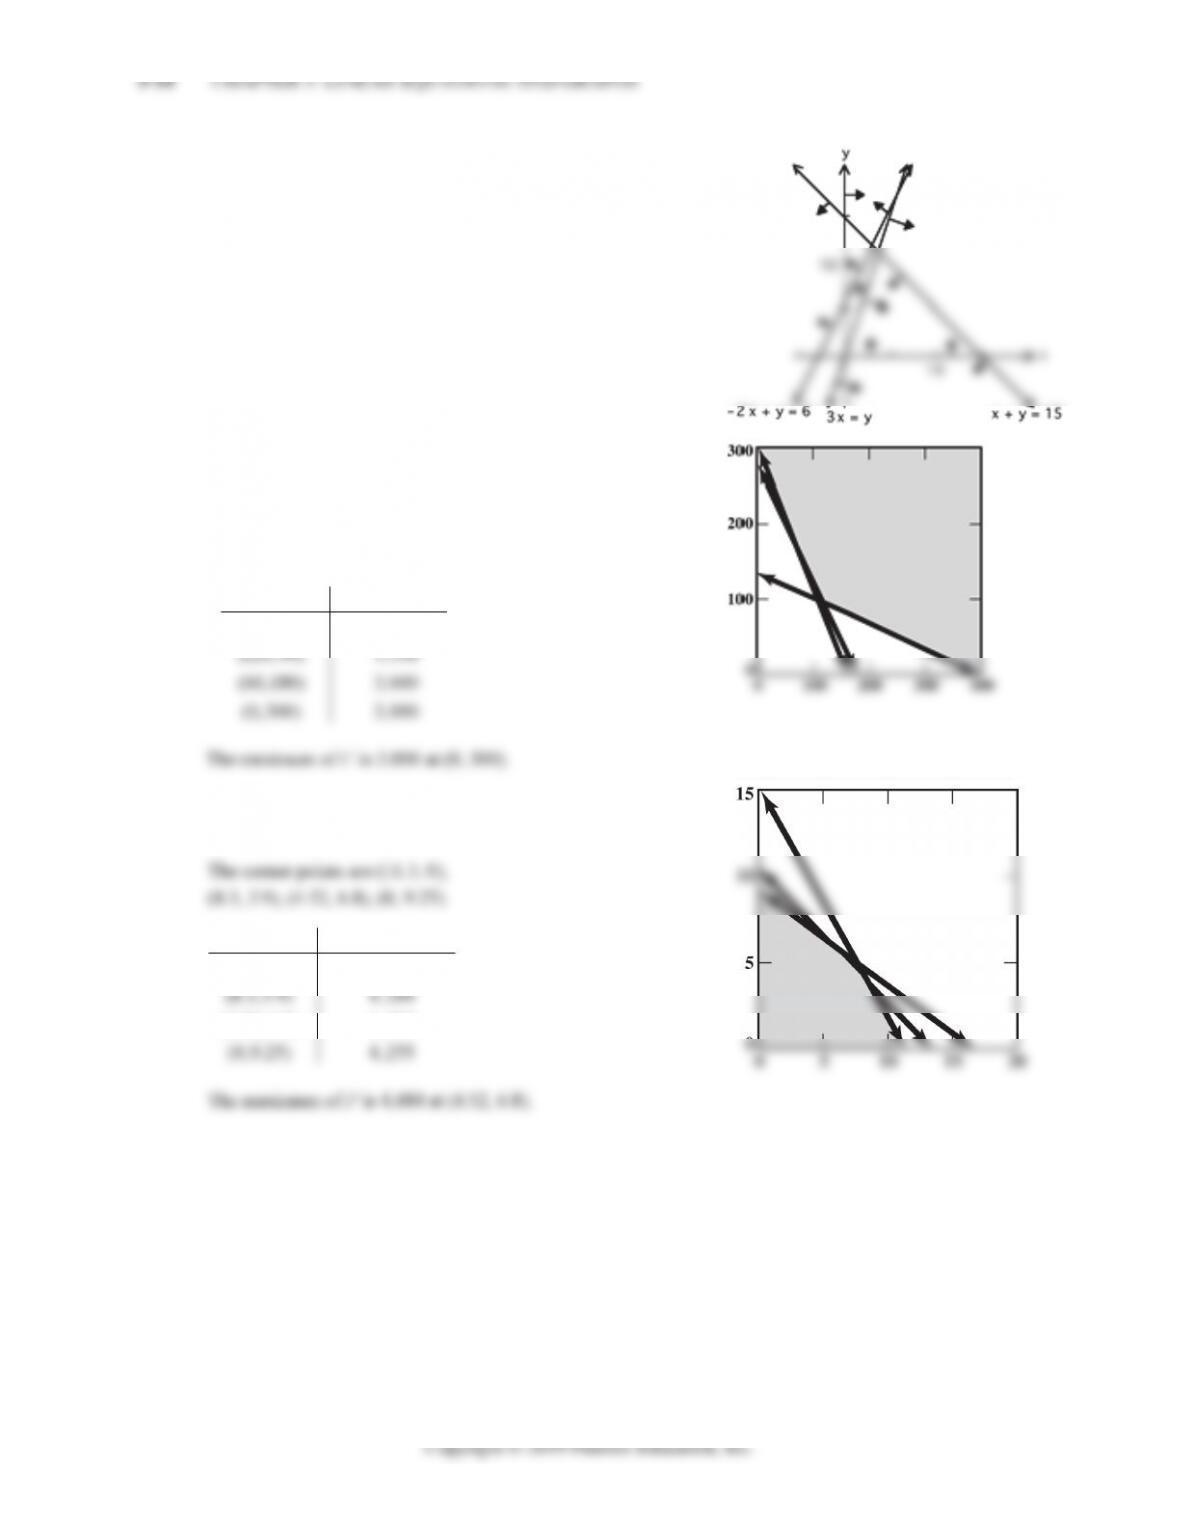
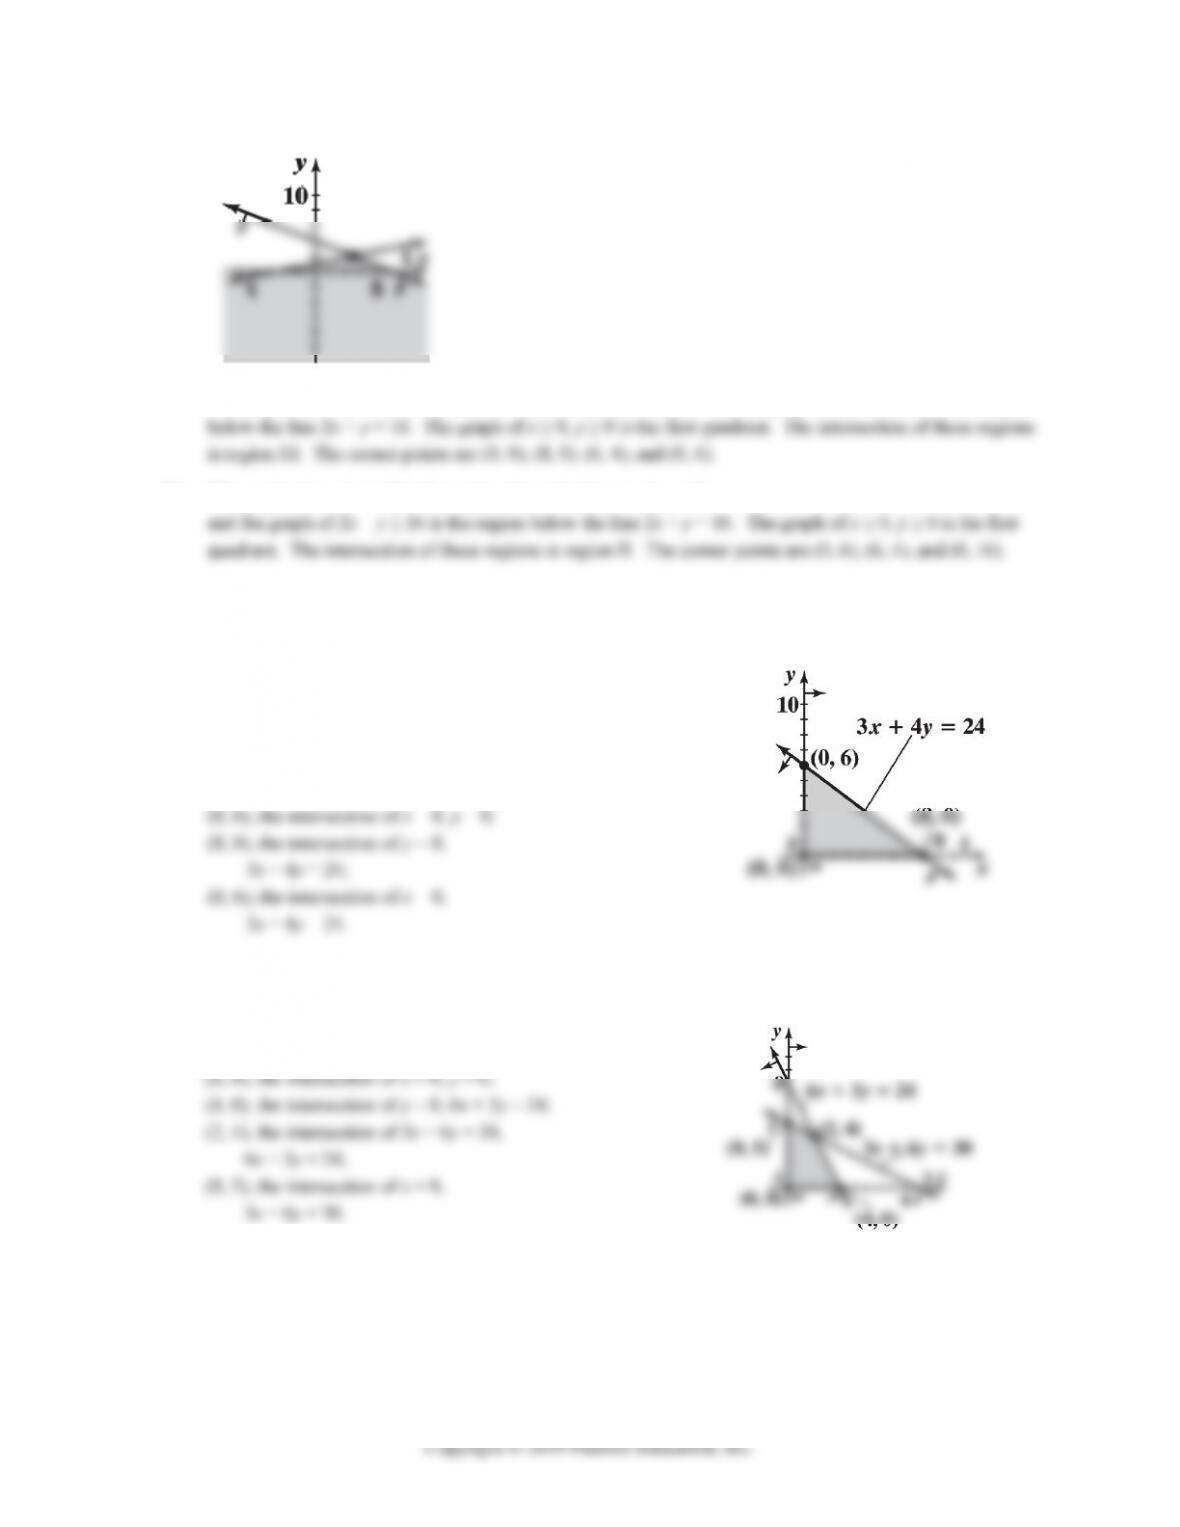
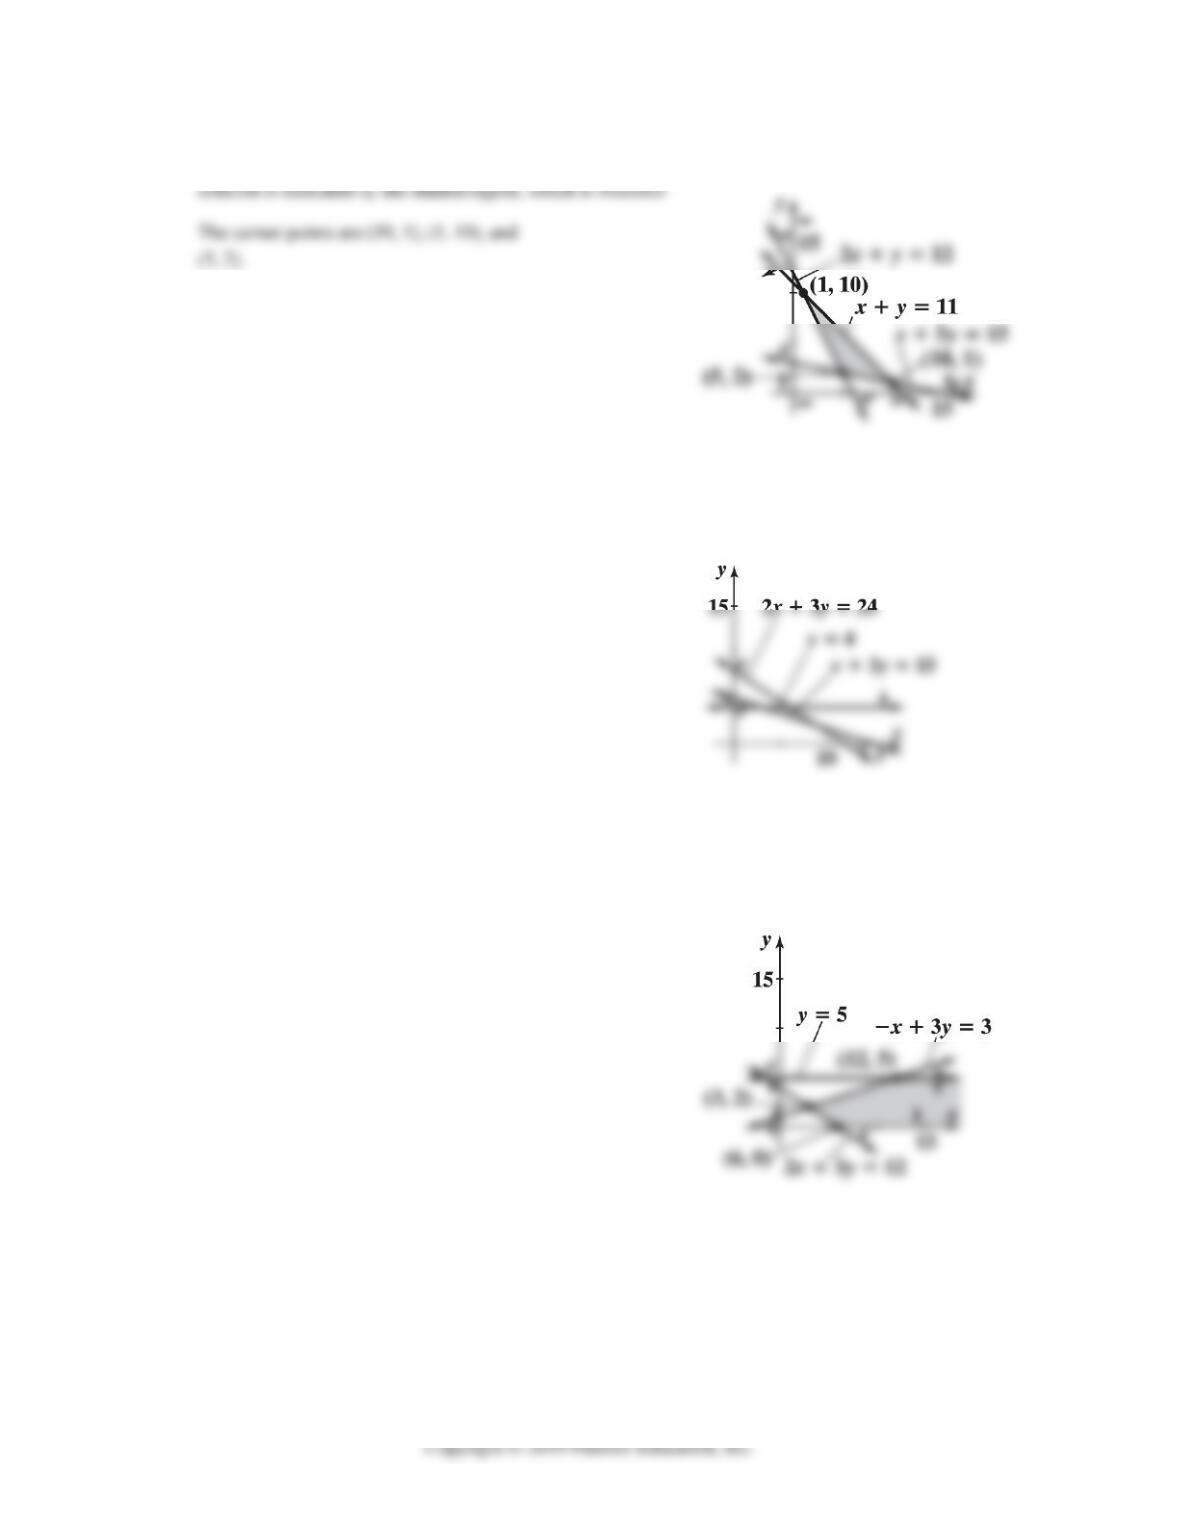
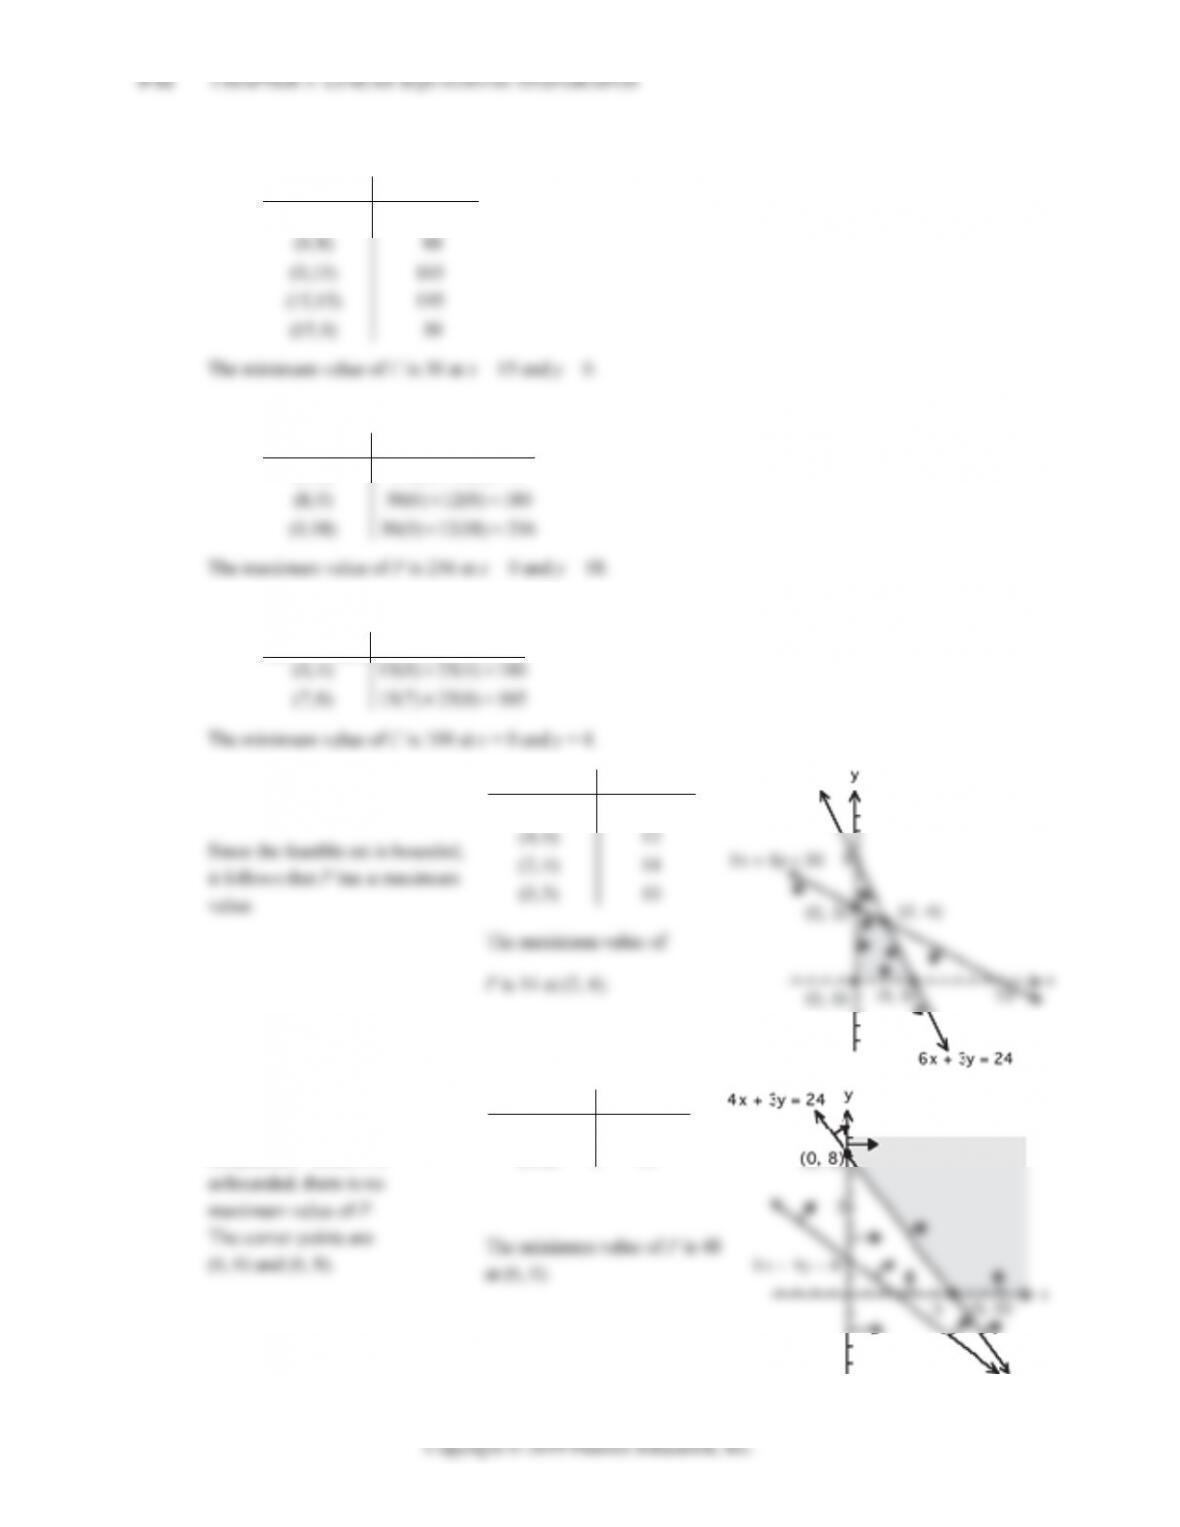
30. The graphs of the inequalities are shown at the right. The
solution region is indicated by the shaded region. The solution
region is bounded.
The corner points of the solution region are:
(0, 6), the intersection of x = 0,
3x + 4y = 24.
32. The graphs of the inequalities are shown at the right. The solution region is shaded. The solution region is
bounded.
The corner points of the solution region are:
5-8 CHAPTER 5: LINEAR EQUATIONS AND GRAPHS
40. The graphs of the inequalities are shown at the right. The
42. The graphs of the inequalities are shown at the right. The
solution region is empty.
44. The graphs of the inequalities are shown at the right. The
solution is indicated by the shaded region, which is
unbounded.
The corner points are (6, 0), (3, 2), and (12, 5).
EXERCISE 5-2 5-9
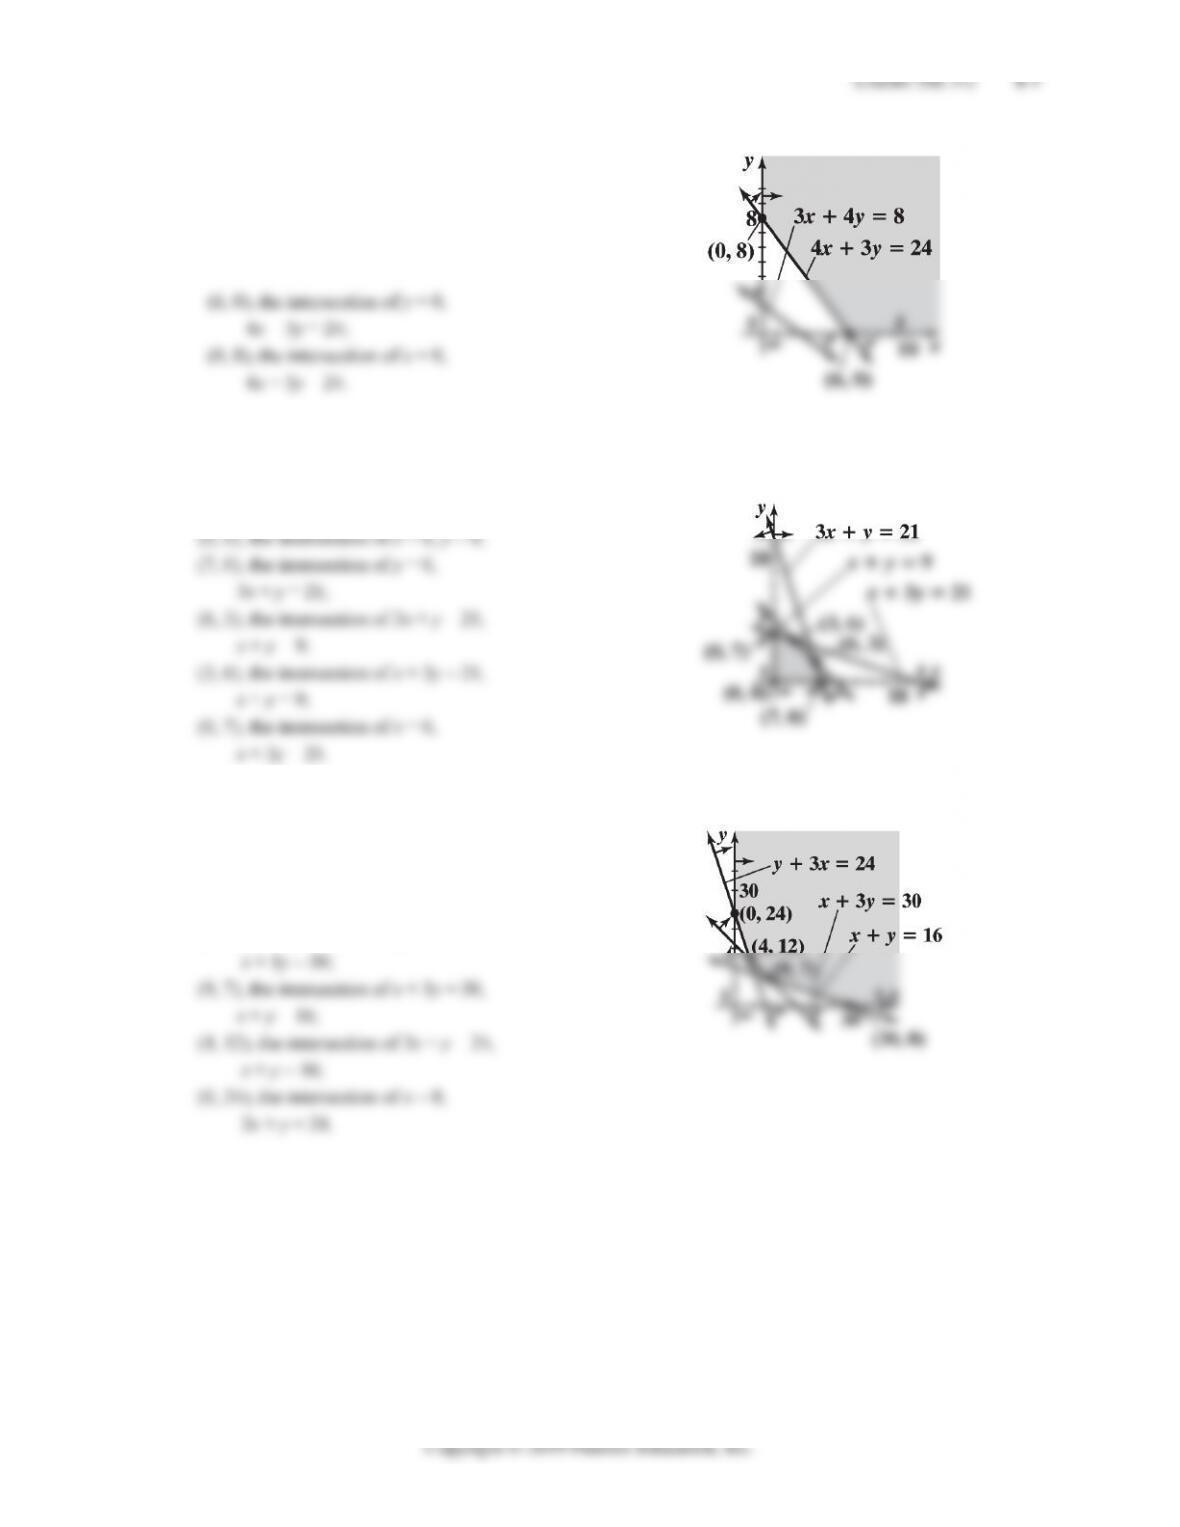
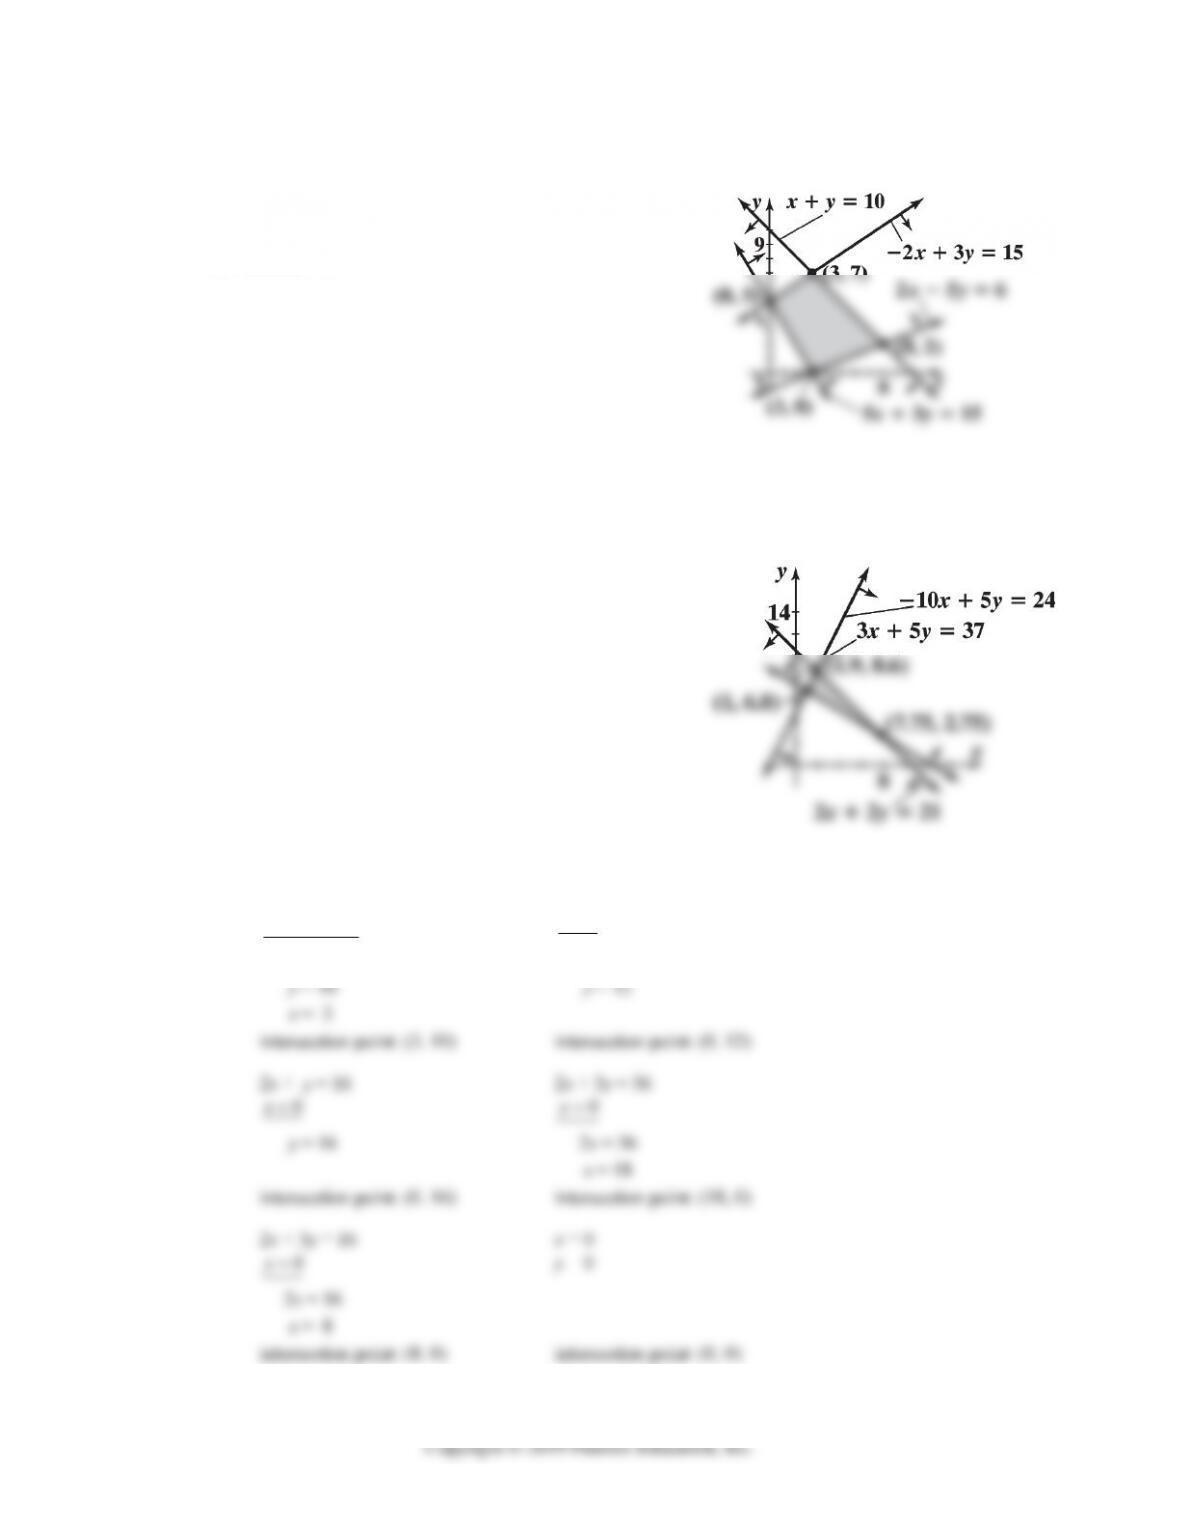
46. The graphs of the inequalities are shown at the right. The
solution is indicated by the shaded region, which is bounded.
The corner points are (3, 0), (8, 2),
(3, 7), and (0, 5).
48. The graphs of the inequalities are shown at the right. The
solution is indicated by the shaded region, which is bounded.
The corner points are
(7.75, 2.75), (1, 6.8), and (1.9, 8.6).
50. (A) 2x + y = 16 2x + 3y = 36
23 36xysubtract 0x
2y = 20 3y = 36
5-10 CHAPTER 5: LINEAR EQUATIONS AND GRAPHS
Copyright © 2019 Pearson Education, Inc.
(B) The corner points are: (3, 10), (8, 0), (0, 12), (0, 0);
(0, 16) does not satisfy 2x + 3y ≤ 36, and
(18, 0) does not satisfy 2x + y ≤ 16.
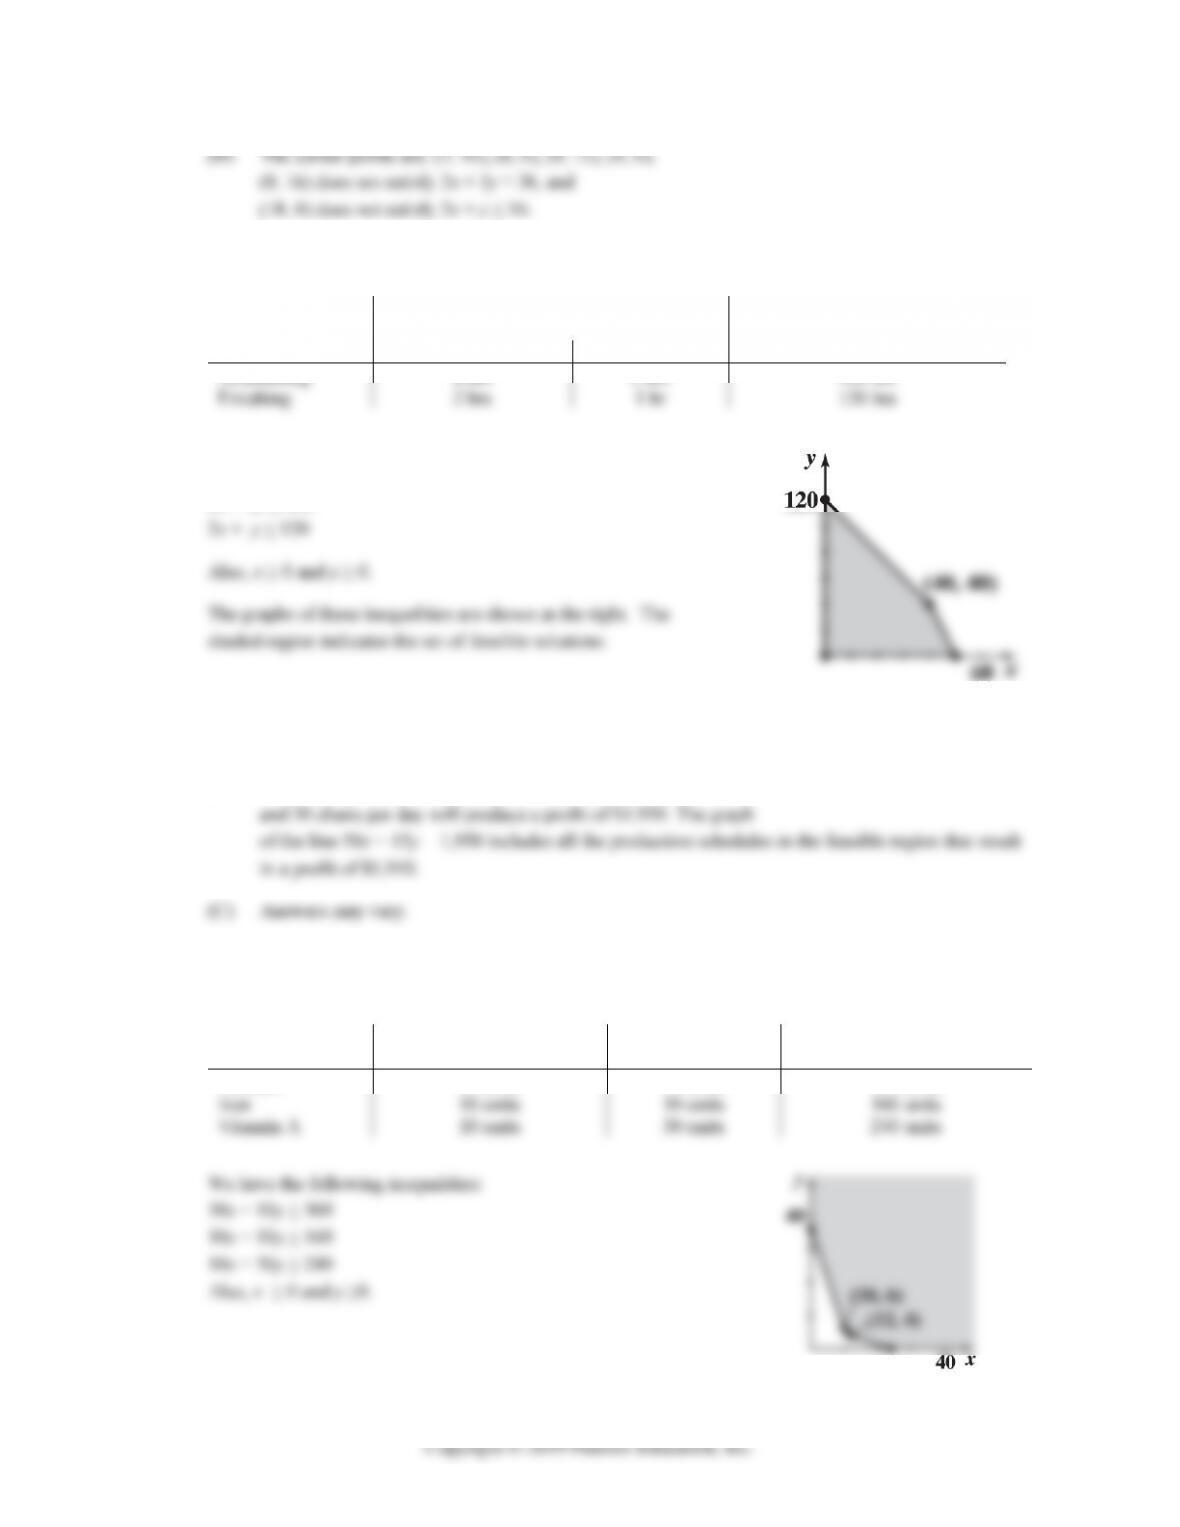
52. Let x = the number of dining room tables and y = the number of chairs produced per day. The information
is summarized in the following table.
Hours per item
Maximum labo
r
-hours
Table Chai
r
p
er da
y
available
Assemblin
g
8 hrs 2 hrs 400 hrs
We have the following inequalities:
8x + 2y ≤ 400
54. (A) All the production schedules in the feasible region that are on the graph of 50x + 15y = 1,300
will result in a profit of $1,300.
(B) There are many possible choices. For example, producing 30 tables
56. Let x = the number of ounces of food M and
y = the number of ounces of food N.
The information is summarized in the following table:
An ounce of An ounce of Minimu
m
Food
M
Food
N
Monthl
y
requiremen
t
Calciu
m
30 units 10 units 360 units
EXERCISE 5-3 5-13
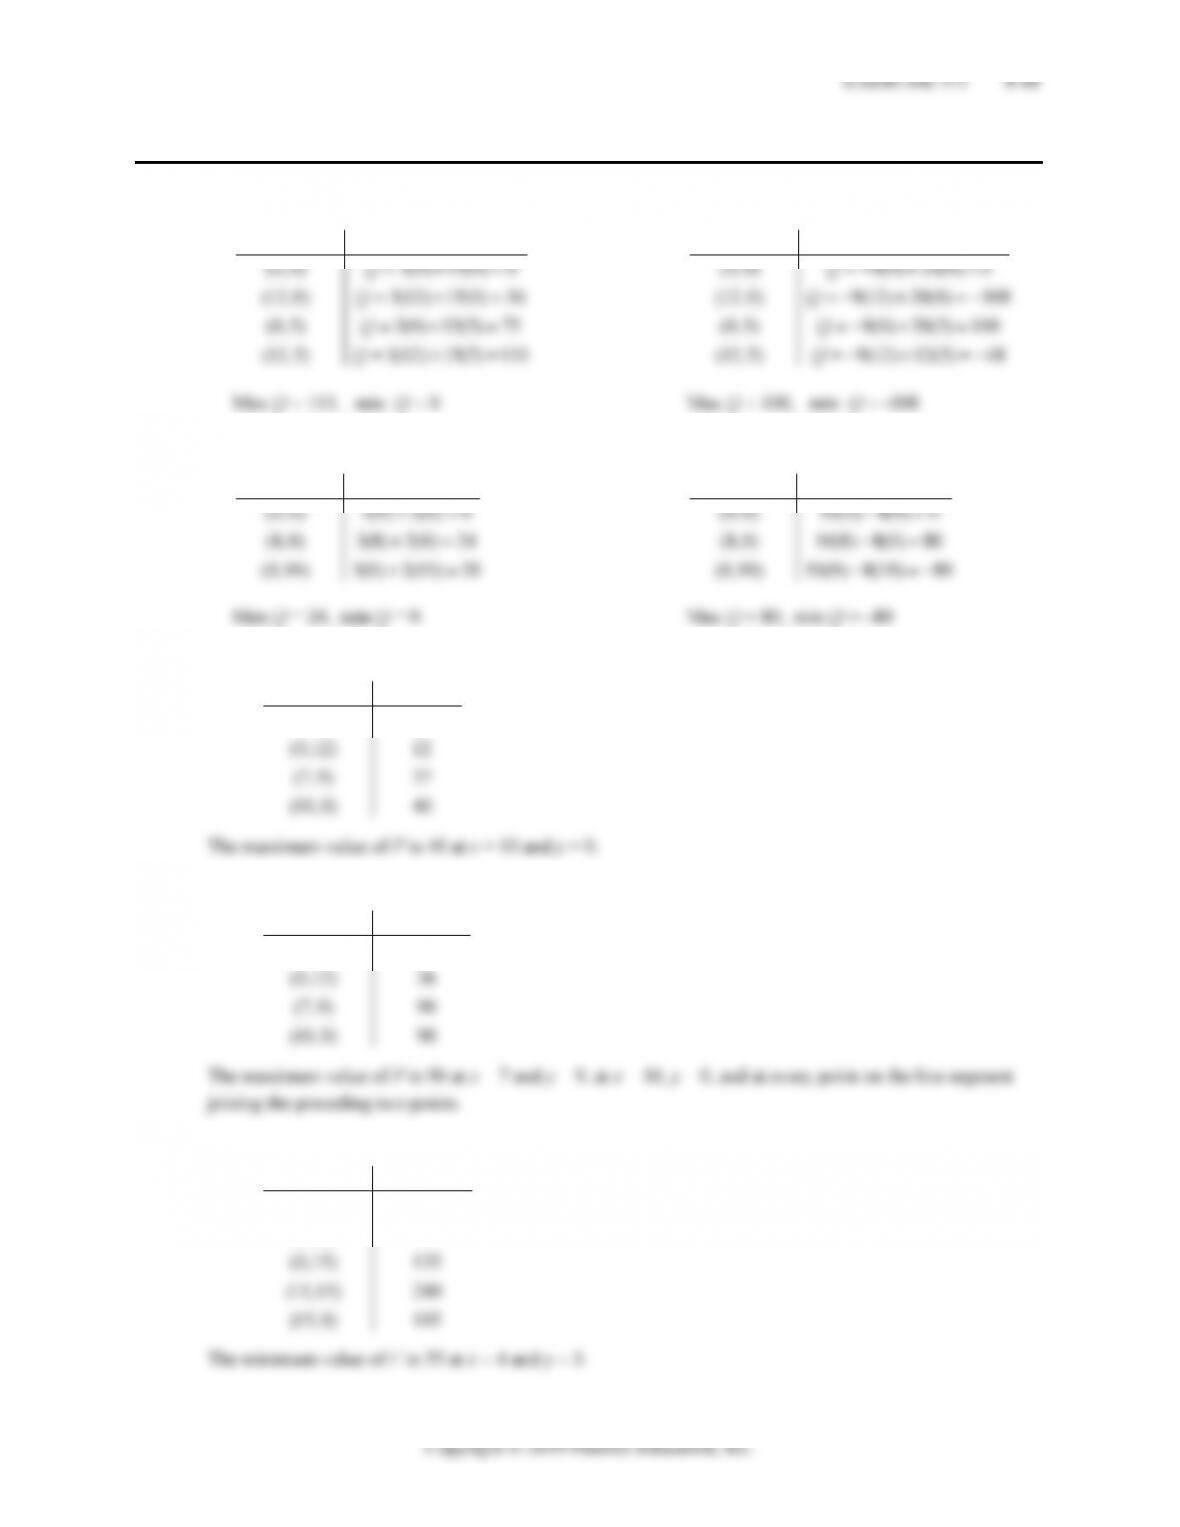
26. The feasible region S is the
solution set of the given
inequalities. Since S is bounded,
Corner Point 20 10
(0,0) 0
(7,0) 140
Pxy
28. The feasible region S is the
solution set of the given
inequalities.
Corner Point 400 100
(30,0) 12,000
(9, 7) 4,300
zxy
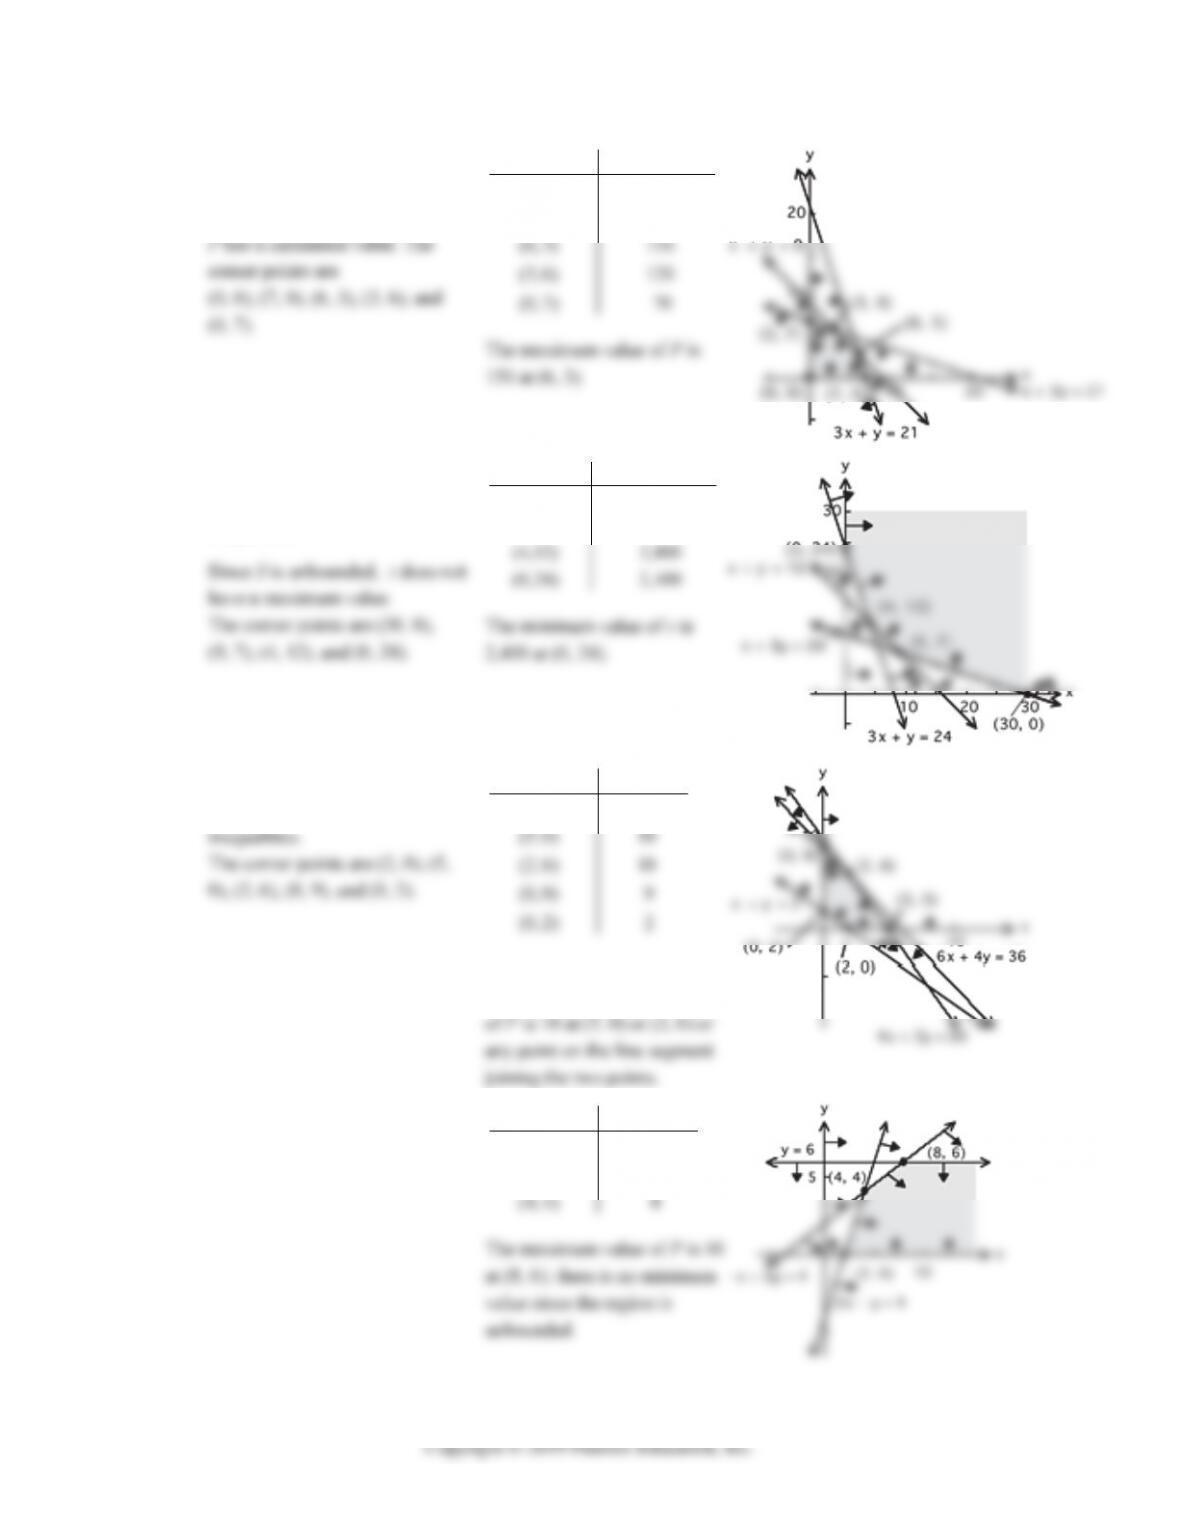
30. The feasible region S is the
solution set of the given
Corner Point 2
(2,0) 4
Pxy
The minimum value of P is 2
at (0, 2); the maximum value
any point on the line segment
j
oining the two points.
32. The corner points are (2, 0),
(8, 6), (4, 4).
Corner Point 3
(2,0) 2
(8, 6) 10
Pxy