Chapter 05 – Strategic Capacity Planning for Products and Services
CHAPTER 05
STRATEGIC CAPACITY PLANNING FOR PRODUCTS AND
SERVICES
Teaching Notes
Capacity is an upper bound on the load that a facility or a plant can serve or manufacture. We measure
the capacity of a plant, machine department, worker, hospital, etc., either in terms of output (number
of units or number of pounds manufactured) or in terms of input (number of machine hours or
machines needed to satisfy demand).
Capacity planning can be classified into three planning horizons:
1. Long range
2. Medium range
3. Short range
The amount of time covered by each of the above planning horizons can vary from industry to
industry. Therefore, the lines of demarcation between the three different levels of planning horizons
can be very imprecise. Nevertheless, the long range planning generally considers planning horizons of
one year or longer. A time period of one year or longer is needed to provide sufficient time to build a
new facility, to expand the existing facility or to move to a new facility due to forecasted changes in
demand.
Answers to Discussion and Review Questions
2. Student answers will vary.
3. Long-term considerations related to the overall level of capacity, while short-term
Chapter 05 – Strategic Capacity Planning for Products and Services
5-2
4. a. Annual seasonality in demand for campgrounds, Christmas trees, Mother’s Day cards,
snow skis, lawn and garden equipment, snow tires.
b. Monthly seasonal patterns are often created by welfare and social security checks being
5. Examples of built-in flexibility include buying more land than is currently needed, building
6. This amounts to a systems approach: the different parts of the system are interrelated, so
unless the entire system is considered, it is likely that the overall system capacity will suffer.
7. Capacity in “chunks” refers to the large stepwise increases that are frequently encountered in
8. Many schools are attempting to “scale–down” capacity due to the decrease in school-age
children. They are selling or leasing school buildings and consolidating classes. In addition,
9. Failure to take all aspects of a system into account can result in uneven capacity, which is
evidenced by bottlenecks. The systems approach helps to avoid this by a “big picture”
perspective and by dealing with interrelationships.
10. Capacity designs establish constraints within which operations must function. They offer an
Chapter 05 – Strategic Capacity Planning for Products and Services
5-3
11. It is the most efficient position. If a producer should choose some other combination, such as
an assembly line for a customized product or service, he would find that the highly customized
requirements of the various products were in direct conflict with the more uniform
requirements needed to effectively operate in the assembly-line mode. Matching process
12. Uncertainty could have an effect on demand which in turn would have an effect on volume or
13. Capacity of government, not-for-profit service operations such as the number of police
officers, the number of firefighters and the number of emergency vehicles is somewhat
different than the capacity of manufacturing or other types of service operations. In the above
14. The long-term strategic implications of capacity planning can be enormous. If we do not
obtain the necessary capacity when we need to, our firm can be at a significant disadvantage.
15. a. The need to be near customers, b. inability to store services, and c. volatility of demand.
16. a. Among university measures are: The number and sizes of classrooms, the capacity of
computer facilities, the size and number of labs, equipment capacities, the number of faculty
Chapter 05 – Strategic Capacity Planning for Products and Services
5-4
b. Among hospital capacity measures are: The number of doctors, nurses, and other health
care providers and their specialties, the number of beds, the capacity of the emergency room,
surgery capacity and recovery capacity, equipment capacity by type, the capacity of
maintenance services, and food and pharmaceutical capacities.
17. Having capacity measures enables a business organization to know its capabilities and, when
combined with forecasts of future demand, use that knowledge to assess how capacity does or
Taking Stock
1. The major trade-off in capacity planning is having too much capacity vs. not having sufficient
2. Some of the employees that are involved in forecasting should also be involved in capacity
3. Automation and computer operated machinery have revolutionized the manufacturing and
service industries. However, these machines and equipment are very expensive. Therefore the
consequences of making a mistake (buying the machinery when we should not have) can be
Critical Thinking Exercises
1.
%97
64
62
capacity Effective
output Actual
Efficiency ===
Chapter 05 – Strategic Capacity Planning for Products and Services
5-5
2. Answers will vary.
3. Having capacity measures enables a business organization to know its capabilities and, when
combined with forecasts of future demand, use that knowledge to assess how capacity does or
Memo Writing Exercises
1. As the investment in automation increases, most likely the fixed cost will increase and the
2. Due to variability of demand, it is not a good idea to be at or near full utilization of capacity
because if demand increases, there is a good chance of running out of capacity. There is an
Solutions
1. a.
%70
10
7
capacityDesign
output Actual
nUtilizatio ===
%5.87
8
7
capacity Effective
output Actual
Efficiency ===
Chapter 05 – Strategic Capacity Planning for Products and Services
5-6
2.
%80
capacity Effective
output Actual
Efficiency ==
Actual output = .8 (Effective capacity)
Effective capacity = .5 (Design capacity)
capacityDesign
output Actual
=nUtilizatio
3. FC = $9,200/month
VC = $ .70/unit
Rev = $ .90/unit
b. Profit = Rev x Q – (FC + VC x Q)
1. P61,000 = $.90(61,000) − [$9,200 + $.70(61,000)] = $3,000
Chapter 05 – Strategic Capacity Planning for Products and Services
5-7
e.
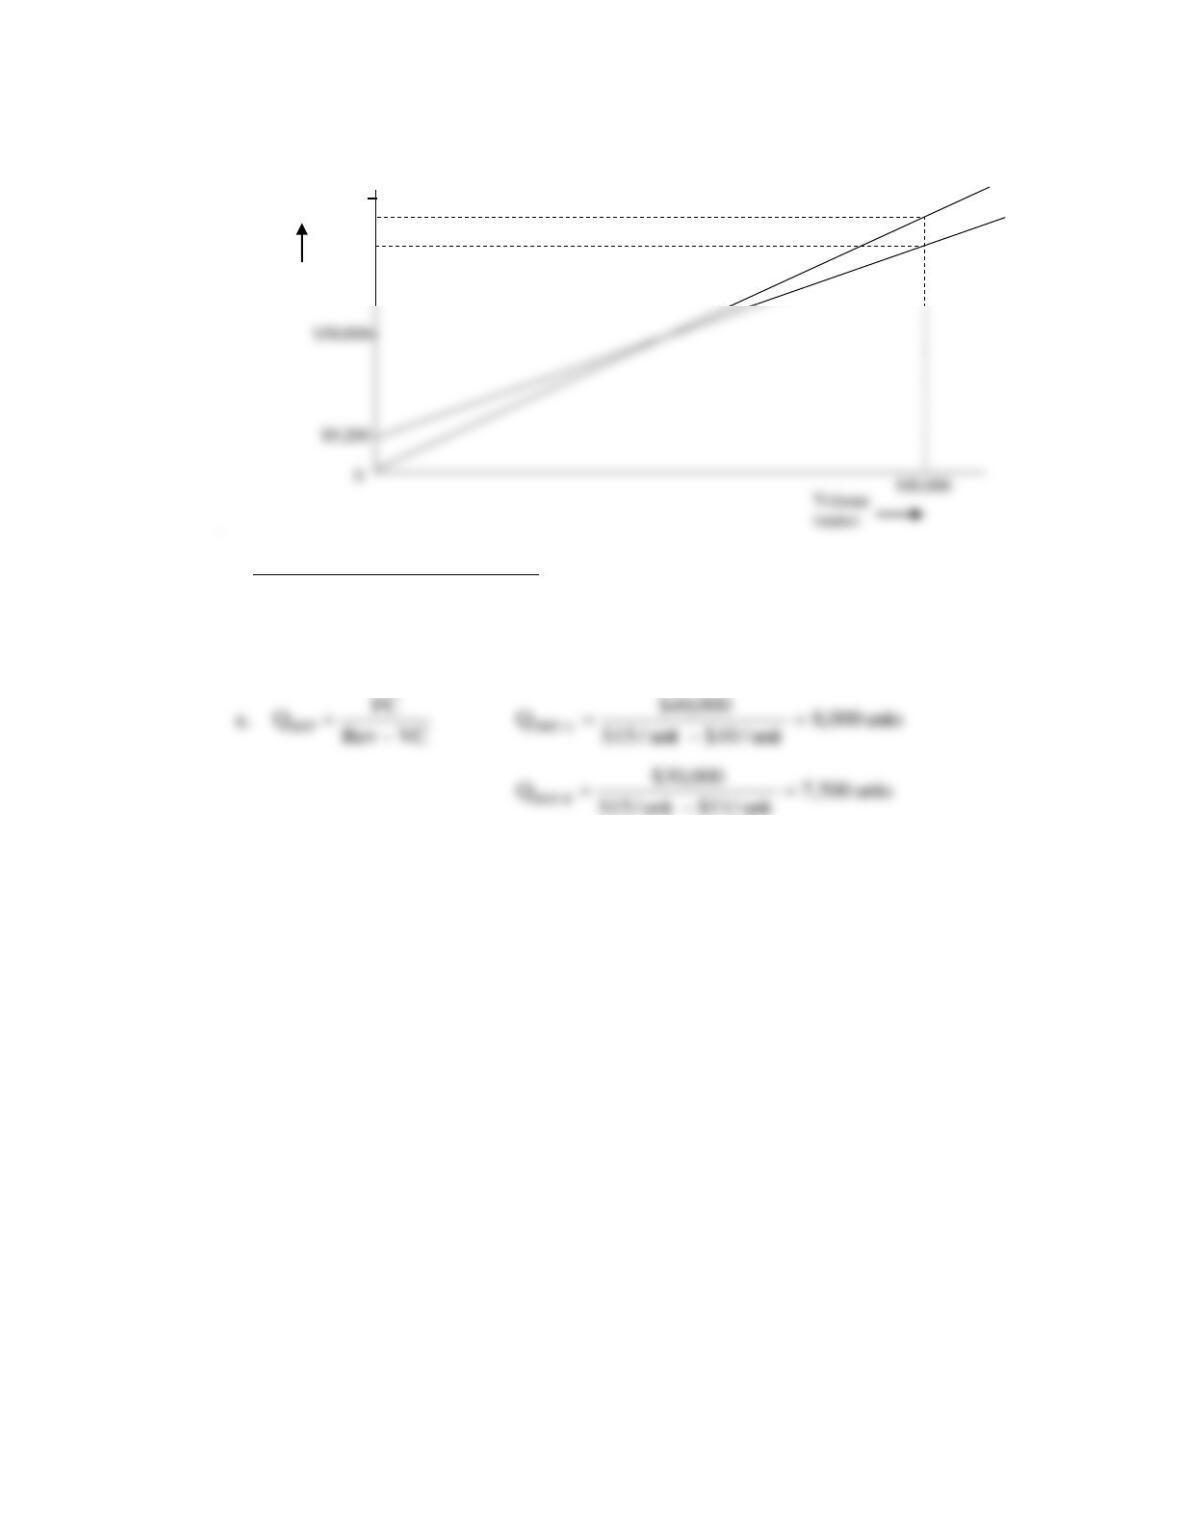
4.
FC
Rev
VC
A:
$40,000
$15/unit
$10/unit
B:
$30,000
$15/unit
$11/unit
TR = $90,000 @ Q = 100,000 units
TC = $79,200 @ Q = 100,000 units
TR
TC
$100,000
Cost
Volume
Chapter 05 – Strategic Capacity Planning for Products and Services
5-8
b. Profit = Q(Rev – VC) – FC
[A’s Profit] [B’s Profit]
5. Demand = 30,000 = Q
FC = $25,000
VC = $.37/pen
a. Rev = $1.00/pen
units 683,39
37$.00.1$
000,25$
VCRev
FC
QBEP =
−
=
−
=
Chapter 05 – Strategic Capacity Planning for Products and Services
5-9
6.
a.
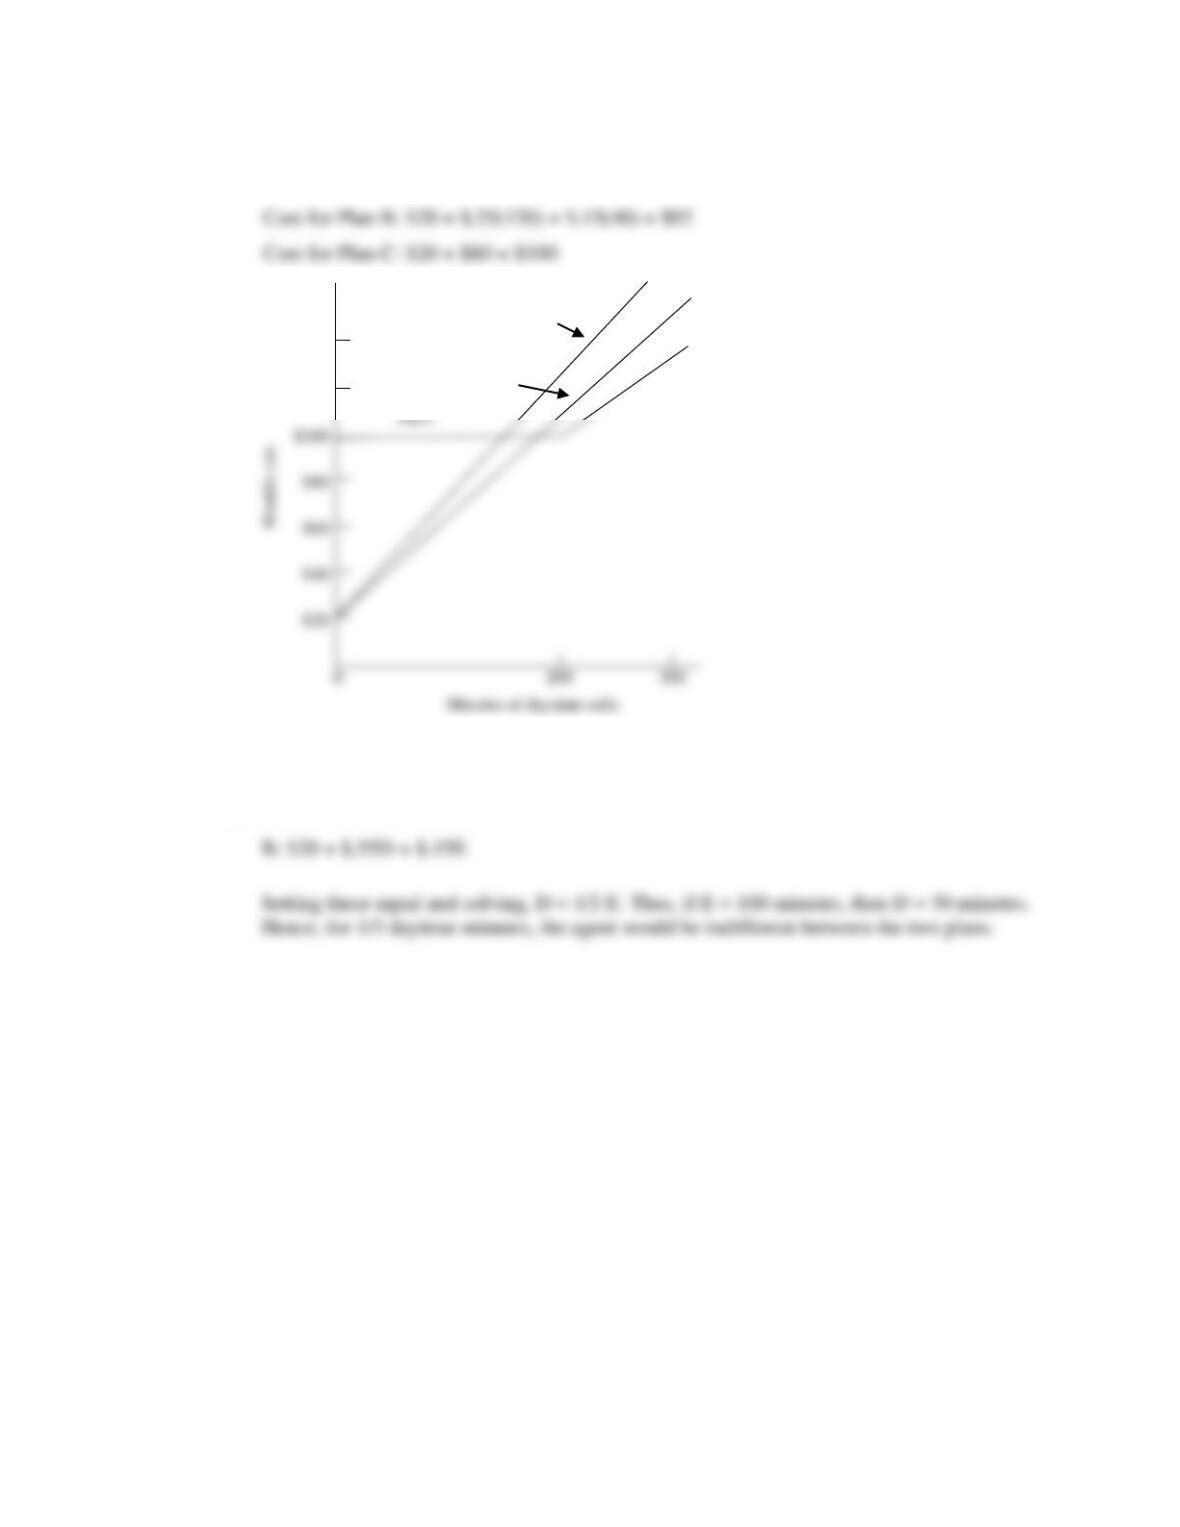
Cost for Plan A: $20 + $.45(120) + $.20(40) = $82
b.
c.
Plan A is optimal for zero to less than 178 minutes. Plan C is optimal from 178 minutes or
more. Plan B is never optimal.
d. A: $20 + $.45D + $.20E
B: $20 + $.55D + $.15E
Plan C
$140
$120
Plan B
Plan A
Cost for Plan B: $20 + $.55(120) + $.15(40) = $92
Cost for Plan C: $20 + $80 = $100
Chapter 05 – Strategic Capacity Planning for Products and Services
5–10
7.
Source
FC
VC
TC
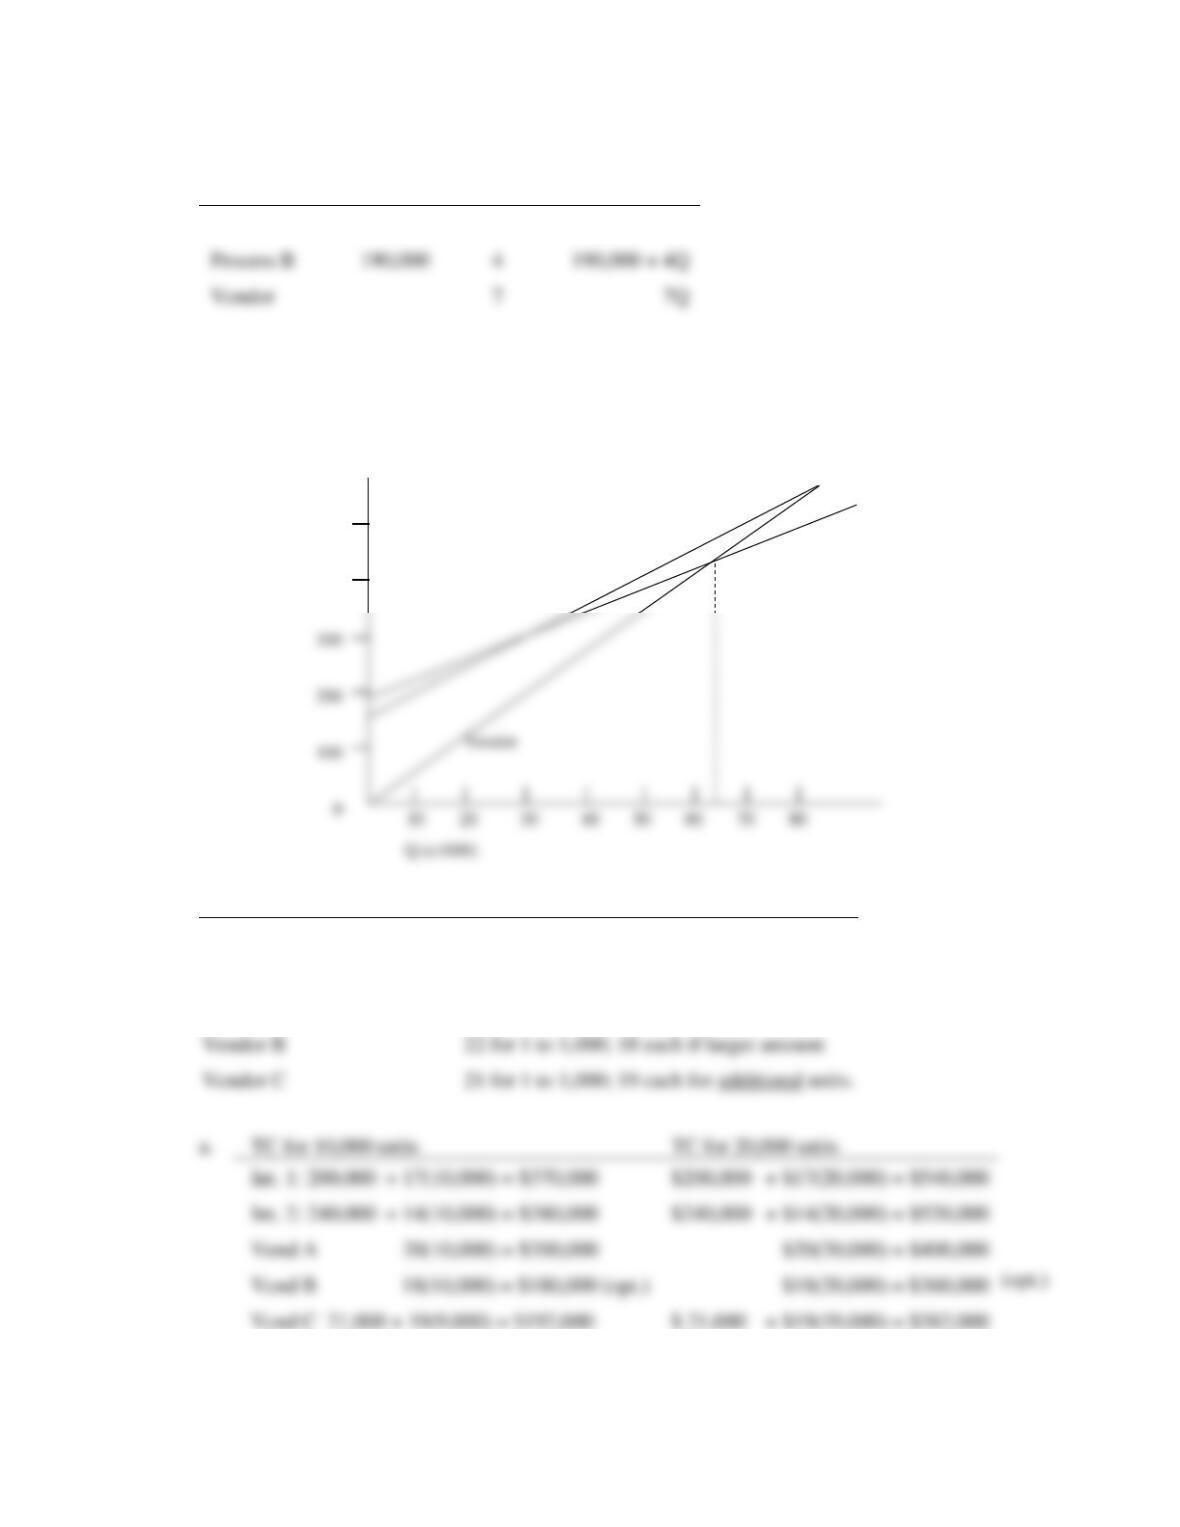
Process A
$160,000
$5
160,000 + 5Q
Answer:
For Q less than 63,333, the total cost is less for Vendor.
For larger quantities, Process B is better.
BEP: 7Q = 190,000 + 4Q; Q = 63,333
8.
Source
FC
VC
Internal 1
$200,000
$17
Internal 2
240,000
14
Vendor A
20 up to 30,000 units
Vendor B
22 for 1 to 1,000; 18 each if larger amount
Vendor C
TC for 20,000 units
$200,000 + $17(20,000) = $540,000
$240,000 + $14(20,000) = $520,000
$20(20,000) = $400,000
$18(20,000) = $360,000
(opt.)
500
400
Cost ($000)
A
B
Vendor
Chapter 05 – Strategic Capacity Planning for Products and Services
5–11
b.
Range
Optimal Choice
1 to 999
A @ $20 each
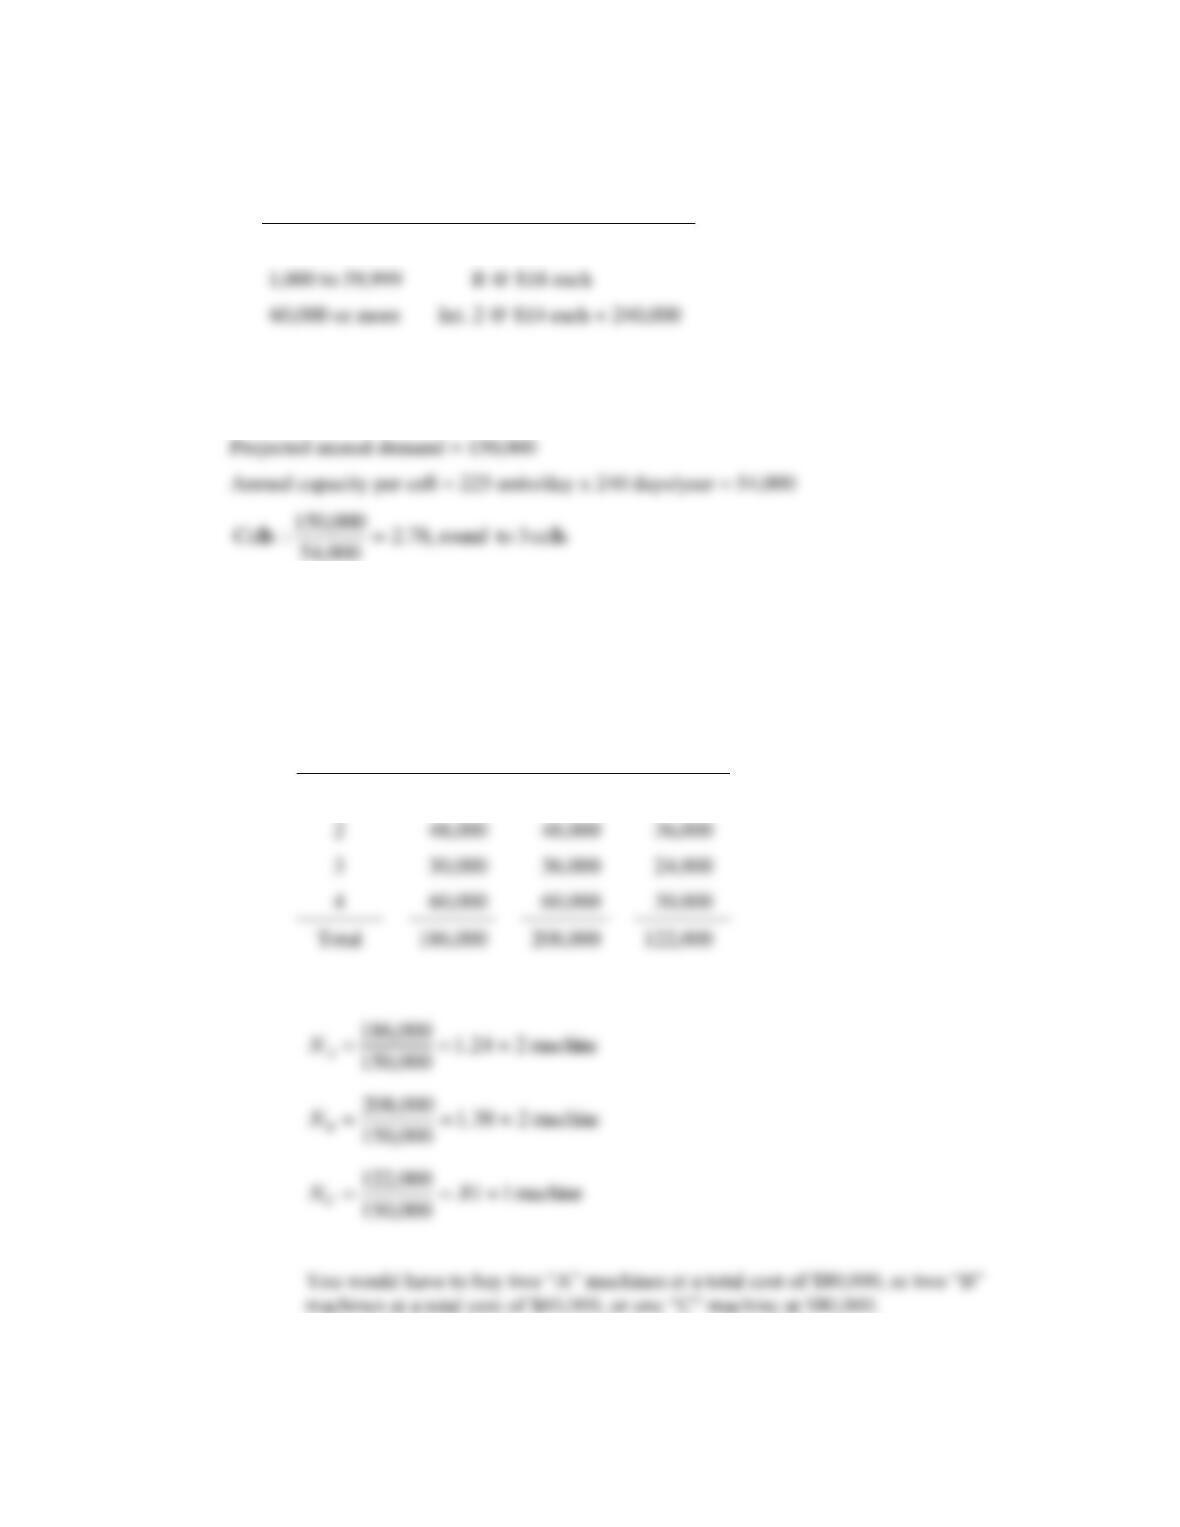
9. Actual output will be 225 per day per cell;
240 Working days/year
10. a. Given: 10 hrs. or 600 min. of operating time per day.
250 days x 600 min. = 150,000 min. per year operating time.
Total processing time by machine
Product
A
B
C
1
48,000
64,000
32,000
4
60,000
60,000
30,000
Int. 2 @ $14 each + 240,000
Chapter 05 – Strategic Capacity Planning for Products and Services
5–12
b. Total cost for each type of machine:
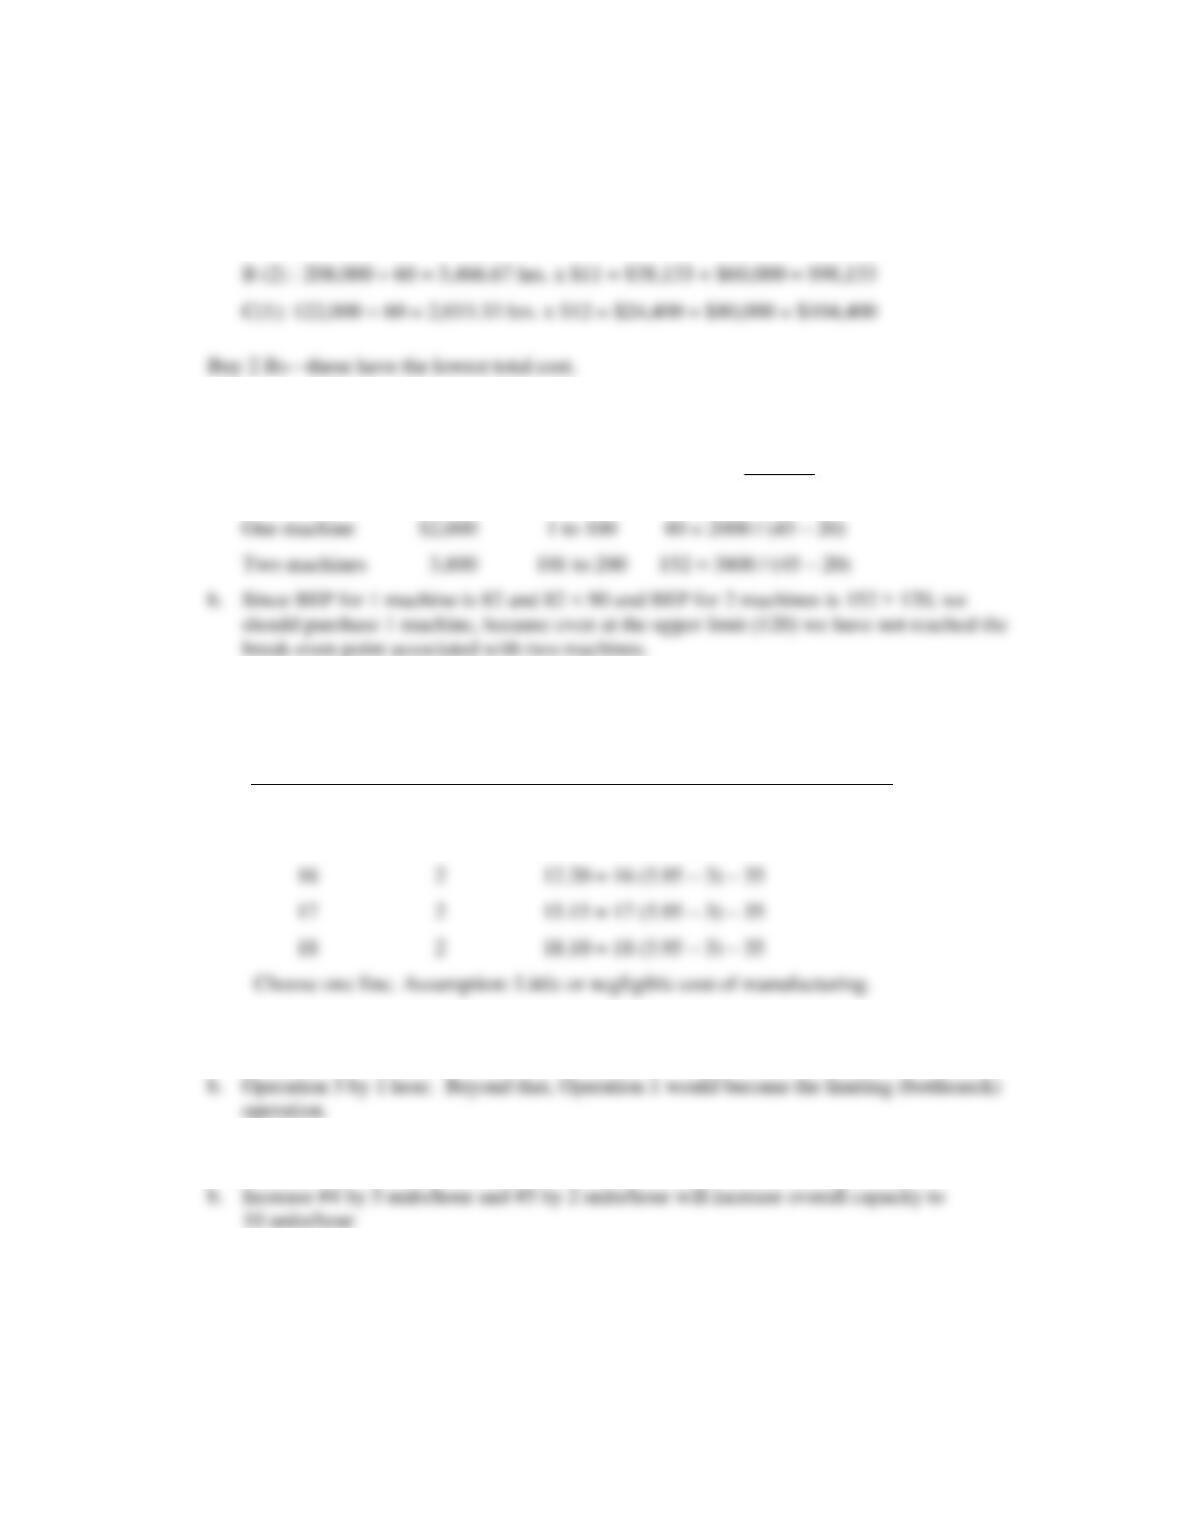
A (2): 186,000 min 60 = 3,100 hrs. x $10 = $31,000 + $80,000 = $111,000
11. R = $45 per customer, VC = $20 per customer
FC Range
VCR
FC
QBEP −
=
12. R = $5.95, VC = $3. One line would have a fixed cost of $20 (6,000 300) per hour and two
lines would have a fixed cost of $35 (10,500 300) per hour.
Volume
No. of lines
Profit
14
1
$21.30 = 14 (5.95 – 3) – 20
15
1
24.25 = 15 (5.95 – 3) – 20
16
2
12.20 = 16 (5.95 – 3) – 35
17
2
18
2
18.10 = 18 (5.95 – 3) – 35
Choose one line. Assumption: Little or negligible cost of manufacturing.
13. a. 11/hr.
14. a. 5 units per hour (10 upper branch and 5 lower branch).
Chapter 05 – Strategic Capacity Planning for Products and Services
Case: Outsourcing of Hospital Services
1. The hospital’s workers felt a connection with the hospital. Perhaps in a larger hospital
2. There could be a cost savings in having an outside firm manage the service, or the
3. Economies of scale.
Enrichment Module: Solving Capacity Planning Problems
Capacity planning problems can be classified in a number of different ways. One such classification
for intermediate and short-range problems is given below:
1. Output capacity determination
2. Input capacity determination
Problem 1 Manufacturing example
(Output capacity determination and capacity-demand match)
A battery manufacturing plant normally operates two eight-hour shifts per day and 6 days per week.
The manufacturer can produce 375 units per hour. Over the next four weeks, the aggregate demand for
the batteries are given in the following table.
Week
1
2
3
4
Demand
30,000
32,000
36,000
40,000
a. Calculate the weekly capacity of the plant.
b. If the firm attempts to produce the demanded quantity, at what percentage of the capacity
would it be operating each week?
Chapter 05 – Strategic Capacity Planning for Products and Services
5–14
Problem 2 Service example
(Output capacity determination)
A small grocery store has a total of four regular checkout lines and one express checkout line.
Recently on Sundays the store has been experiencing either excessive idle time for cashiers or
excessively long customer waiting lines. The results of a recent time study performed by a
management consulting company showed that the average service time for express and regular
checkout lines are 3 and 10 minutes respectively. As the next step in analyzing the problem, the
a. Determine the current capacity of the store in total number of customers for Sundays.
Problem 3 Manufacturing example
(Input capacity determination – number of resources needed)
A video equipment manufacturer produces videotapes and DVDs. The manufacturing facility operates
two eight-hour shifts per day for 6 days a week. The unit manufacturing time is 6 minutes for each
videotape and 8 minutes for each DVD.
a. Given that machine operators work at 80% efficiency, determine the number of workers
needed to produce 5000 videotapes and 2500 DVDs per week.
Chapter 05 – Strategic Capacity Planning for Products and Services
5–15
Problem 4 Manufacturing example with multiple products and multiple machines
(Input capacity determination – and number of resources needed)
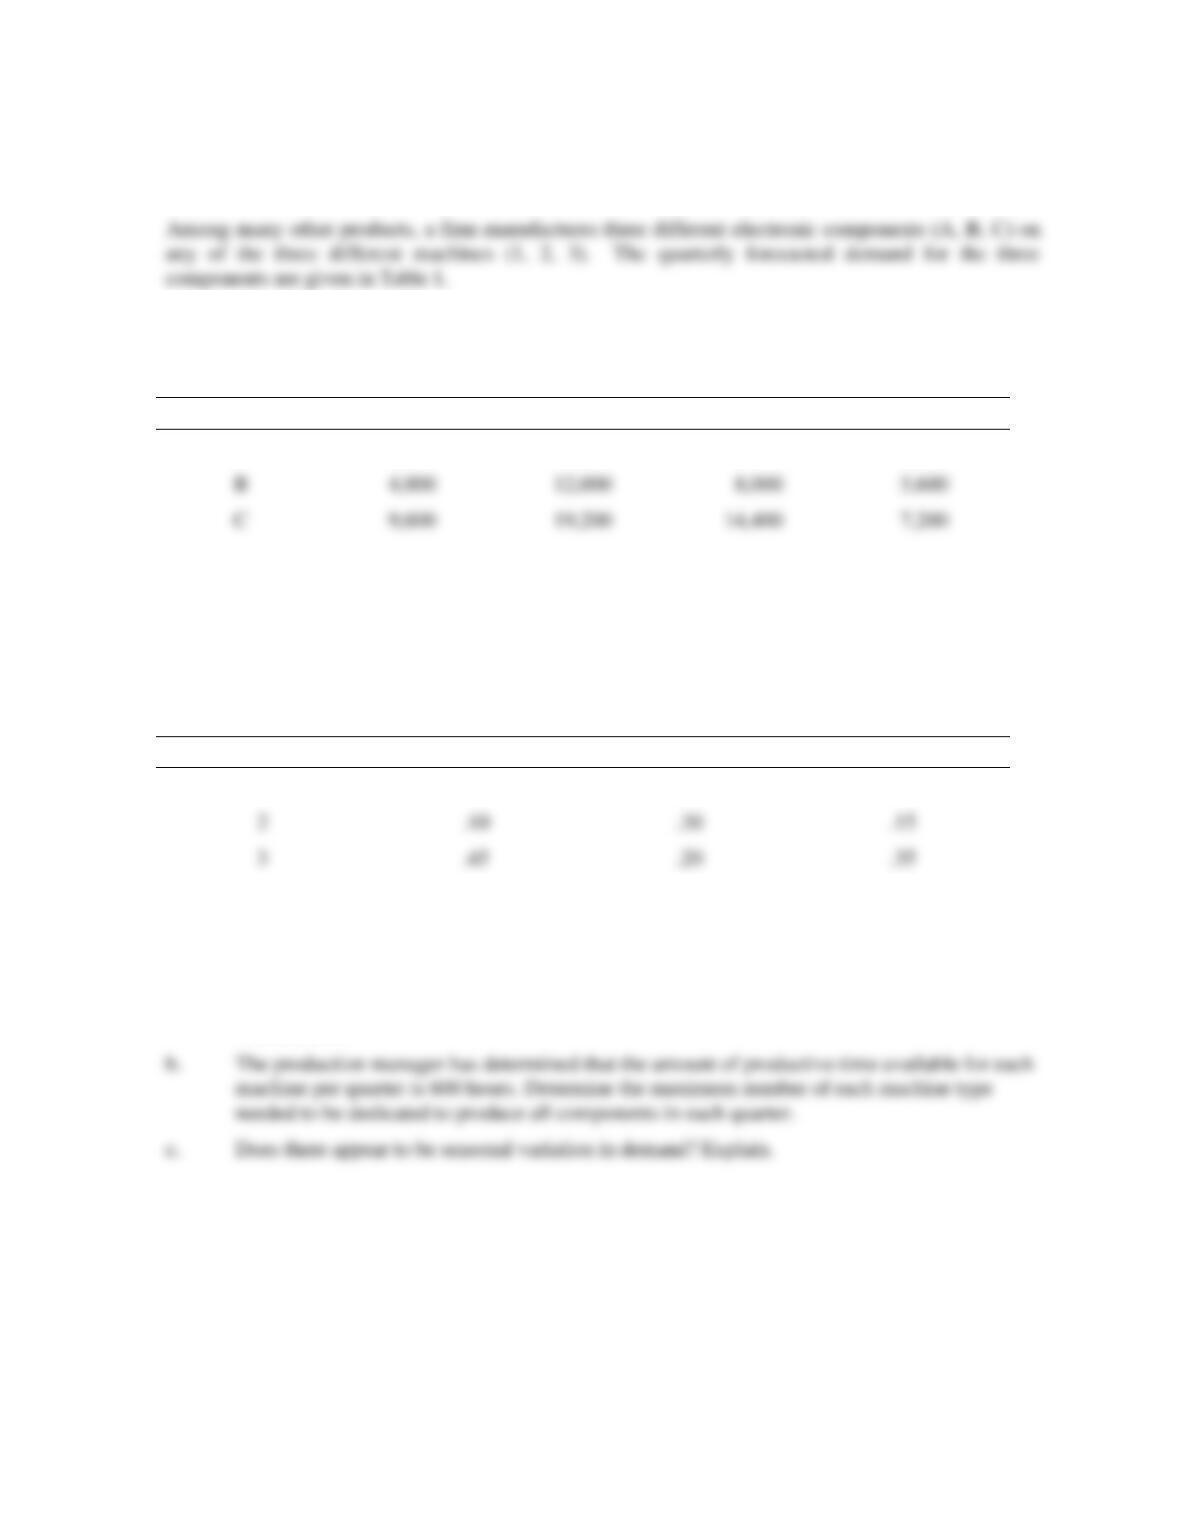
Table 1
Quarterly Forecasted Demand by Product Type
Season
Component
Winter
Spring
Summer
Fall
A
8,000
20,000
12,000
6,400
C
9,600
19,200
14,400
7,200
Table 2 displays the unit production time for each product on each machine
Table 2
Unit Production Time in hours
Component
Machine
A
B
C
1
.25
.50
.40
Interpreting Table 2, we can state that each unit of product A takes 15 minutes (.25 x 60 min.) to
process on machine 1, while it takes 12 minutes (.20 x 60 minutes) to process one unit of product B on
machine 3.
a. Determine the maximum number of machine hours demanded for each quarter machine
combination.
Chapter 05 – Strategic Capacity Planning for Products and Services
5–16
Solution to Problem 1 Manufacturing example
(Output capacity determination and capacity-demand match)
a. The number of units/week = (375 units/hr.) (8 hrs/shift) (2 shifts/day) (6 days/week)
b.
Week
1
2
3
4
Forecasted
demand
30,000
32,000
38,000
40,000
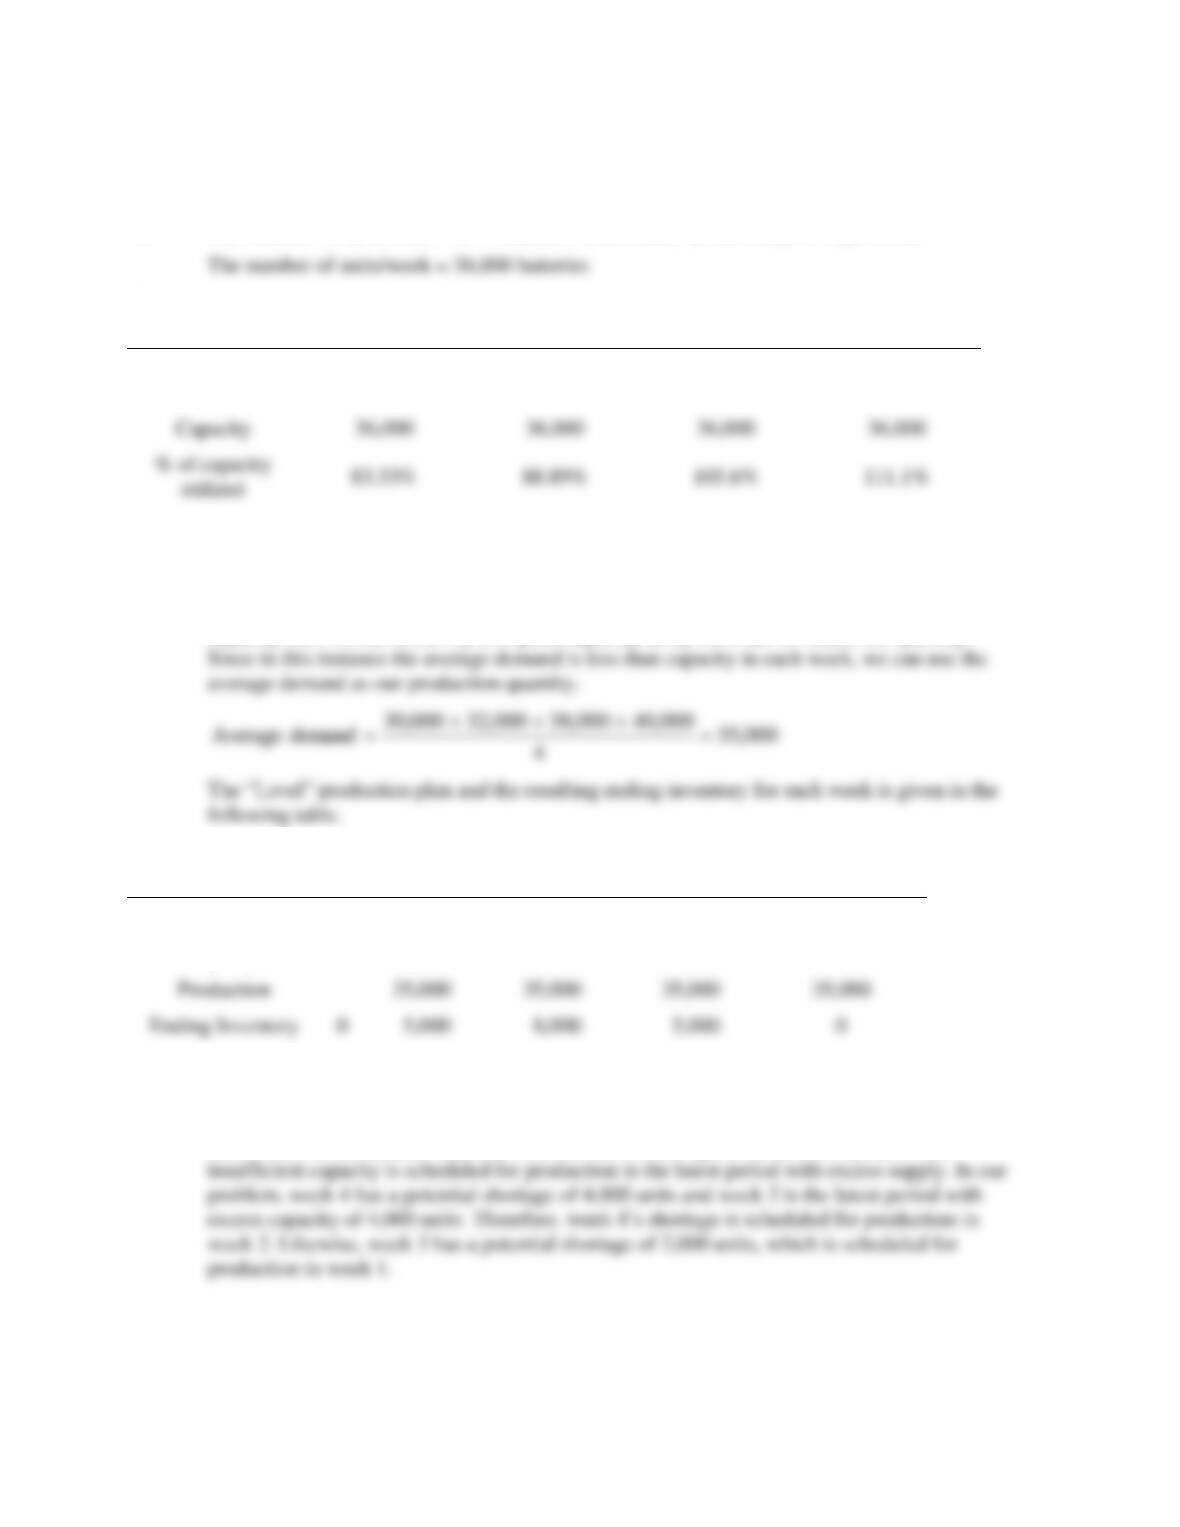
c. In determining the “Level” production plan, if the demand is less than or equal to the
production capacity, we simply determine the average demand for the four-week period and
use the average demand as our production quantity. However, if the average demand is above
capacity, then we can either try to expand capacity, delay the order or reduce the quantity.
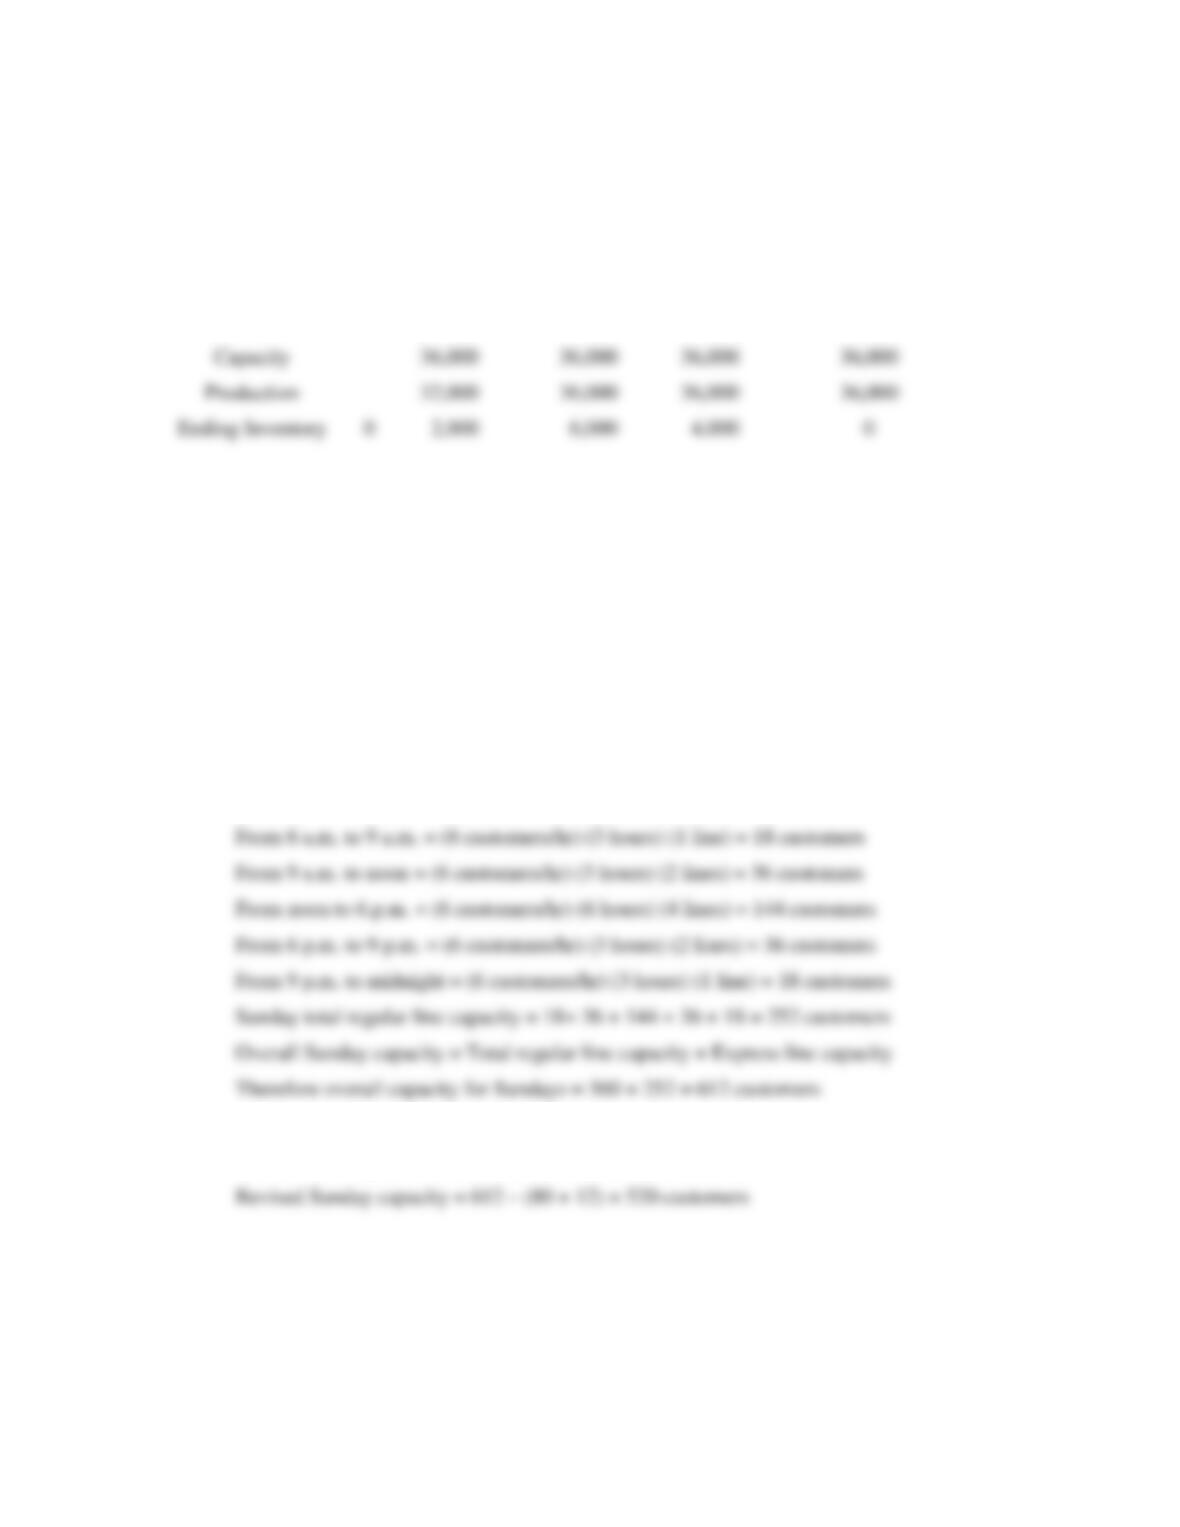
Week
0
1
2
3
4
Forecasted demand
30,000
32,000
38,000
40,000
Capacity
36,000
36,000
36,000
36,000
Ending Inventory
Average inventory = 18,000 / 4 = 4,500 units.
d. In determining the “Chase” production plan, we attempt to match production with demand
unless there is insufficient capacity. The amount of shortage from the latest period with
Chapter 05 – Strategic Capacity Planning for Products and Services
5–17
The “Chase” production plan and the resulting ending inventory for each week is given in the
following table.
Week
0
1
2
3
4
Forecasted demand
30,000
32,000
38,000
40,000
Average inventory = 12,000/4 = 3,000 units.
e. The “Chase” production plan results in fewer units in inventory, while the “Level” production
plan results in more uniform production, thus less hiring and layoff costs.
Solution to Problem 2 Service example
(Output capacity determination)
a. Hourly capacity of the express line = (60 minutes) / (3 minutes per cust.) = 20 customers
Hourly capacity of the regular line = (60 minutes) / (10 minutes per cust.) = 6 customers
Capacity of the express line for Sundays = (20 customers) x (18 hours) = 360 customers
Capacity of the regular line:
b. Reduction in express line capacity = (4 hours) (20 customers / hour) = 80 customers
Reduction in regular line capacity = (2 hours) (6 customers per hour) = 12 customers
Ending Inventory
Chapter 05 – Strategic Capacity Planning for Products and Services
5–18
Solution to Problem 3 Manufacturing example
(Input capacity determination – number of resources needed)
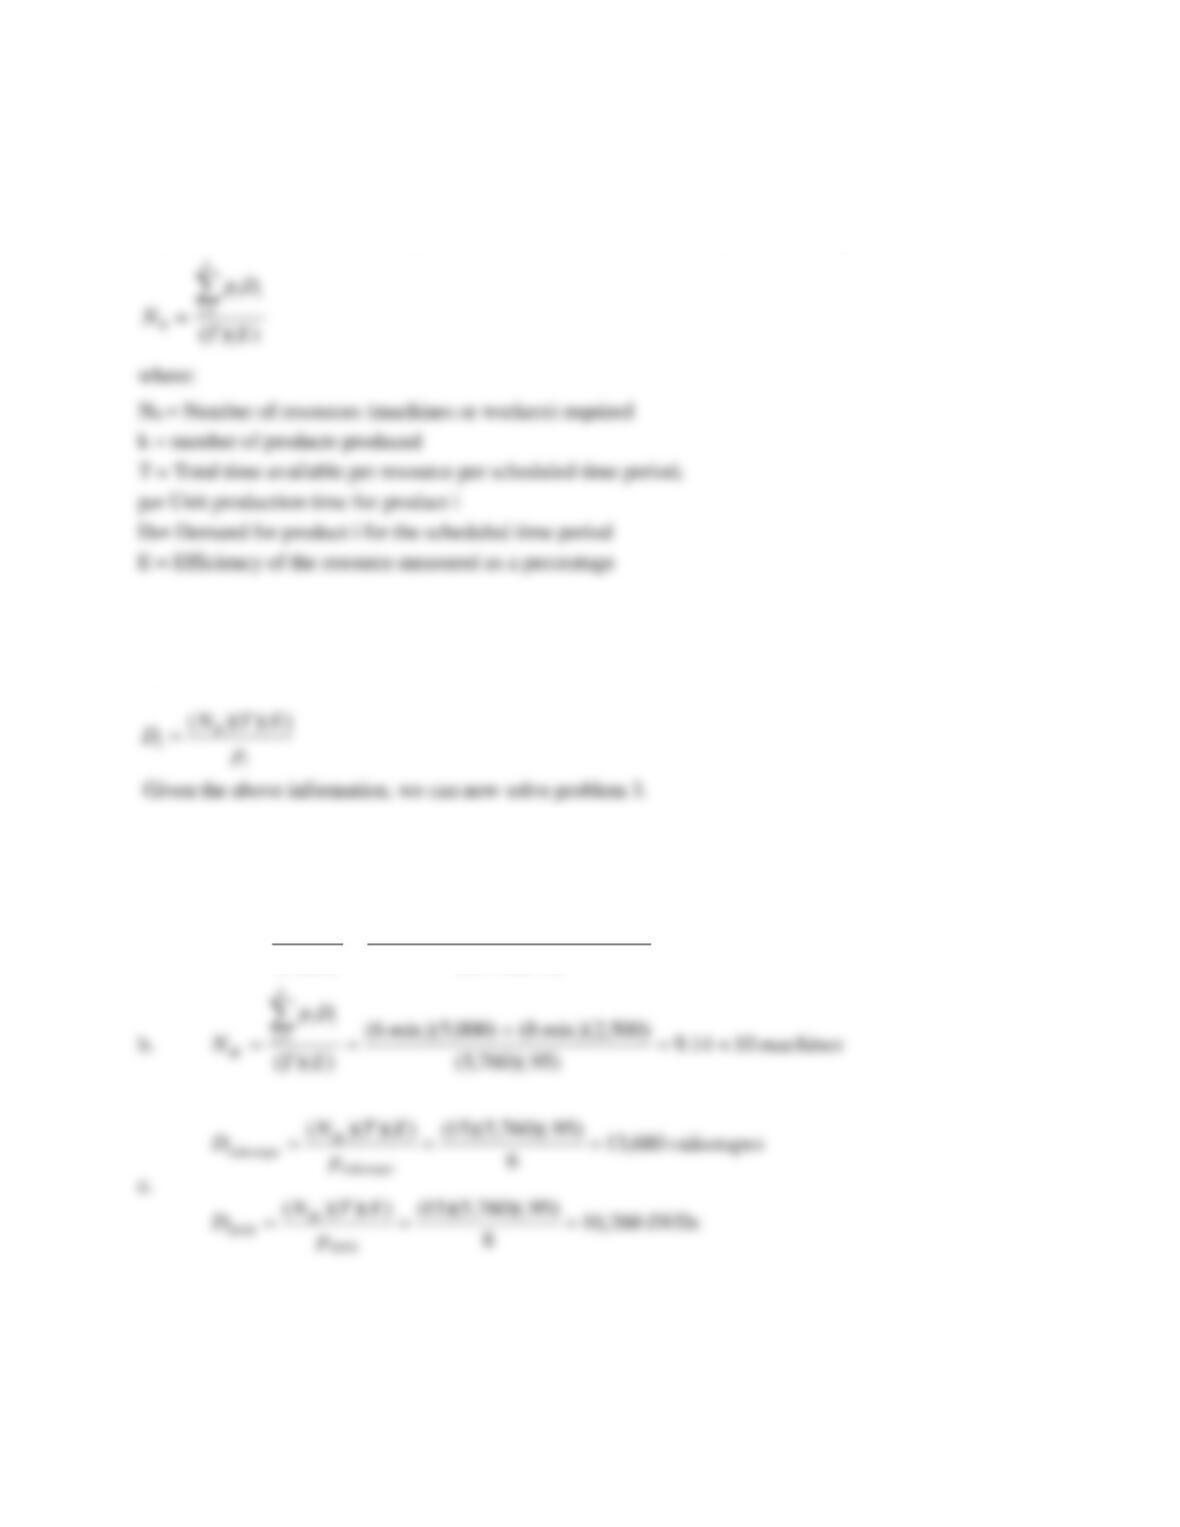
In general, we can express the equation for number of resources using the following notation:
Therefore, if we know the number of workers and want to determine the maximum demand that can be
satisfied for a given product, we can manipulate the formula given above and obtain the following
equation:
a.
workers
min. min.
ET
Dp
N
week hrmin. shifthrs days shifts T
k
iii
W1188.10
)80)(.760,5(
)500,2)(8()000,5)(6(
))((
/.min760,5.)/60)(/.8)(6)(2(
1=
+
==
==
=
Chapter 05 – Strategic Capacity Planning for Products and Services
5–19
d.
videotapes
p
ETN
D
videotape
M
videotape
360,15
6
)80)(.760,5)(20())()((
===
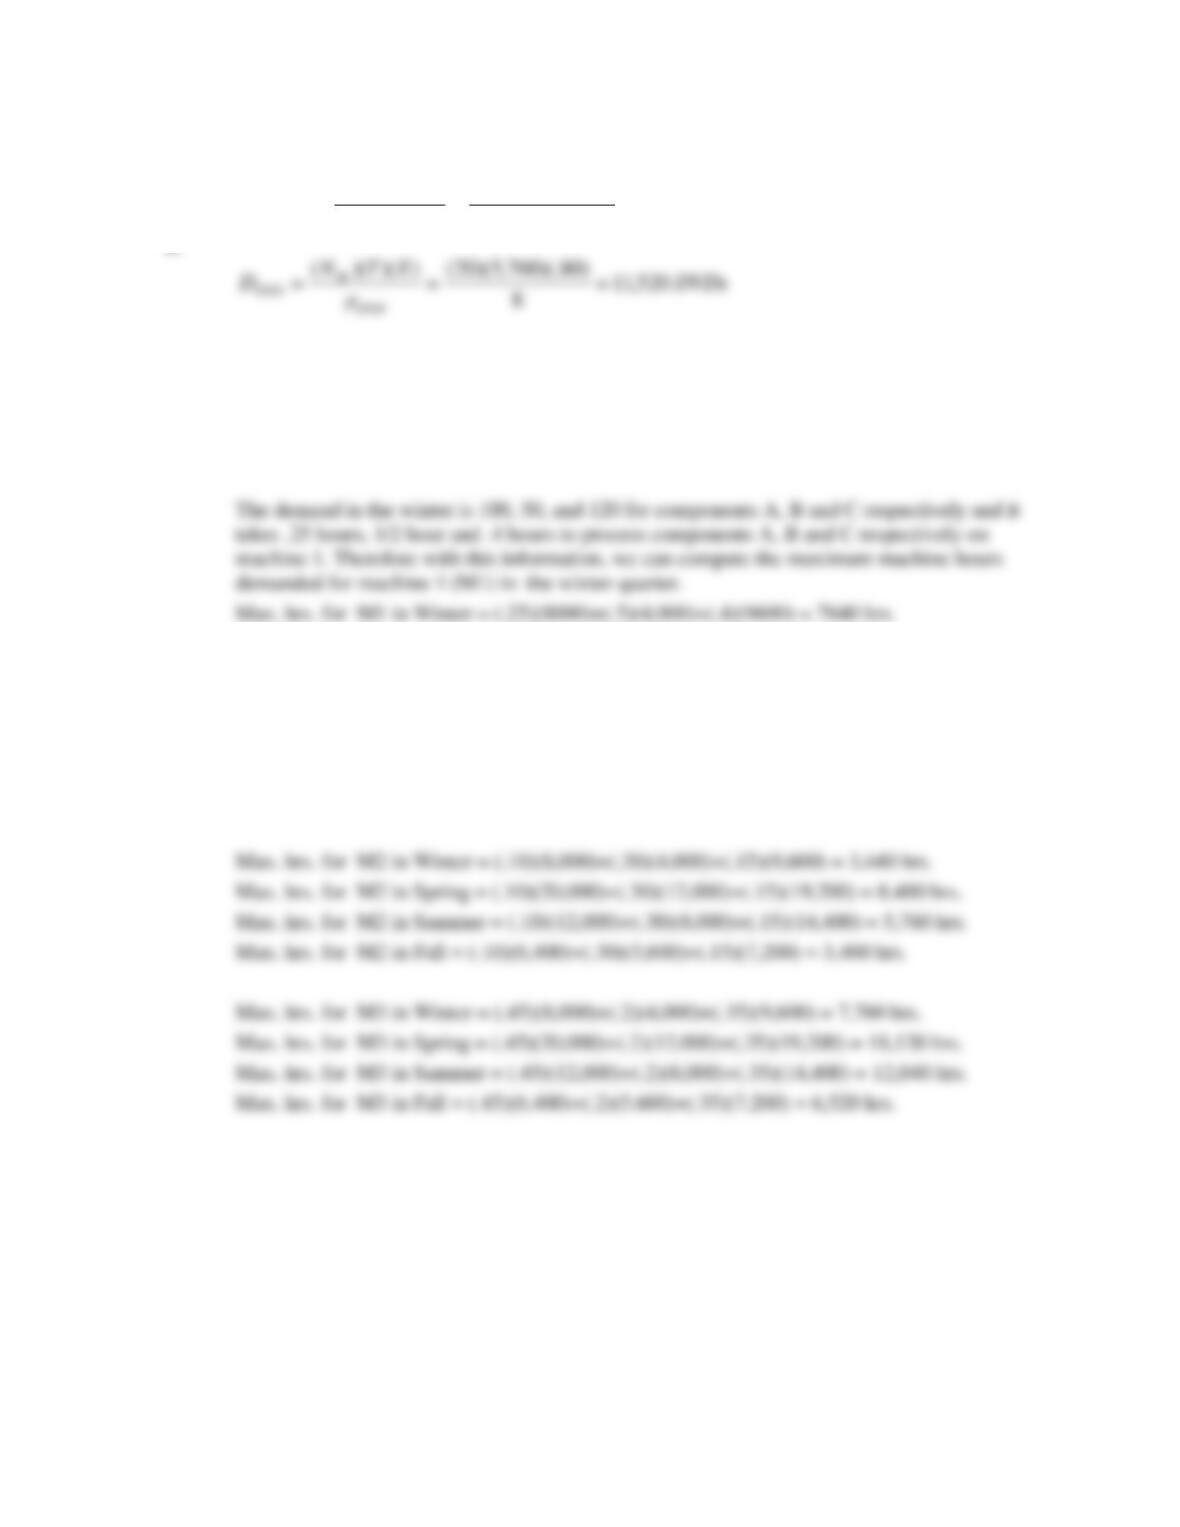
Solution to Problem 4 Manufacturing example with multiple products and multiple machines
(Input capacity determination – and number of resources needed)
a. First, we need to convert the demand to machine hours for each machine in each season.
Similarly the quarterly machine hours demanded can be calculated for the rest of the machine-
season combinations:
Max. hrs. for M1 in Spring = (.25)(20,000)+(.5)(12,000)+(.4)(19,200) =18,680 hrs.
Max. hrs. for M1 in Summer = (.25)(12,000)+(.5)(8,000)+(.4)(14,400) = 12,760 hrs.
Max. hrs. for M1 in Fall = (.25)(6,400)+(.5)(5,600)+(.4)(7,200) = 7,280 hrs.
Chapter 05 – Strategic Capacity Planning for Products and Services
5–20
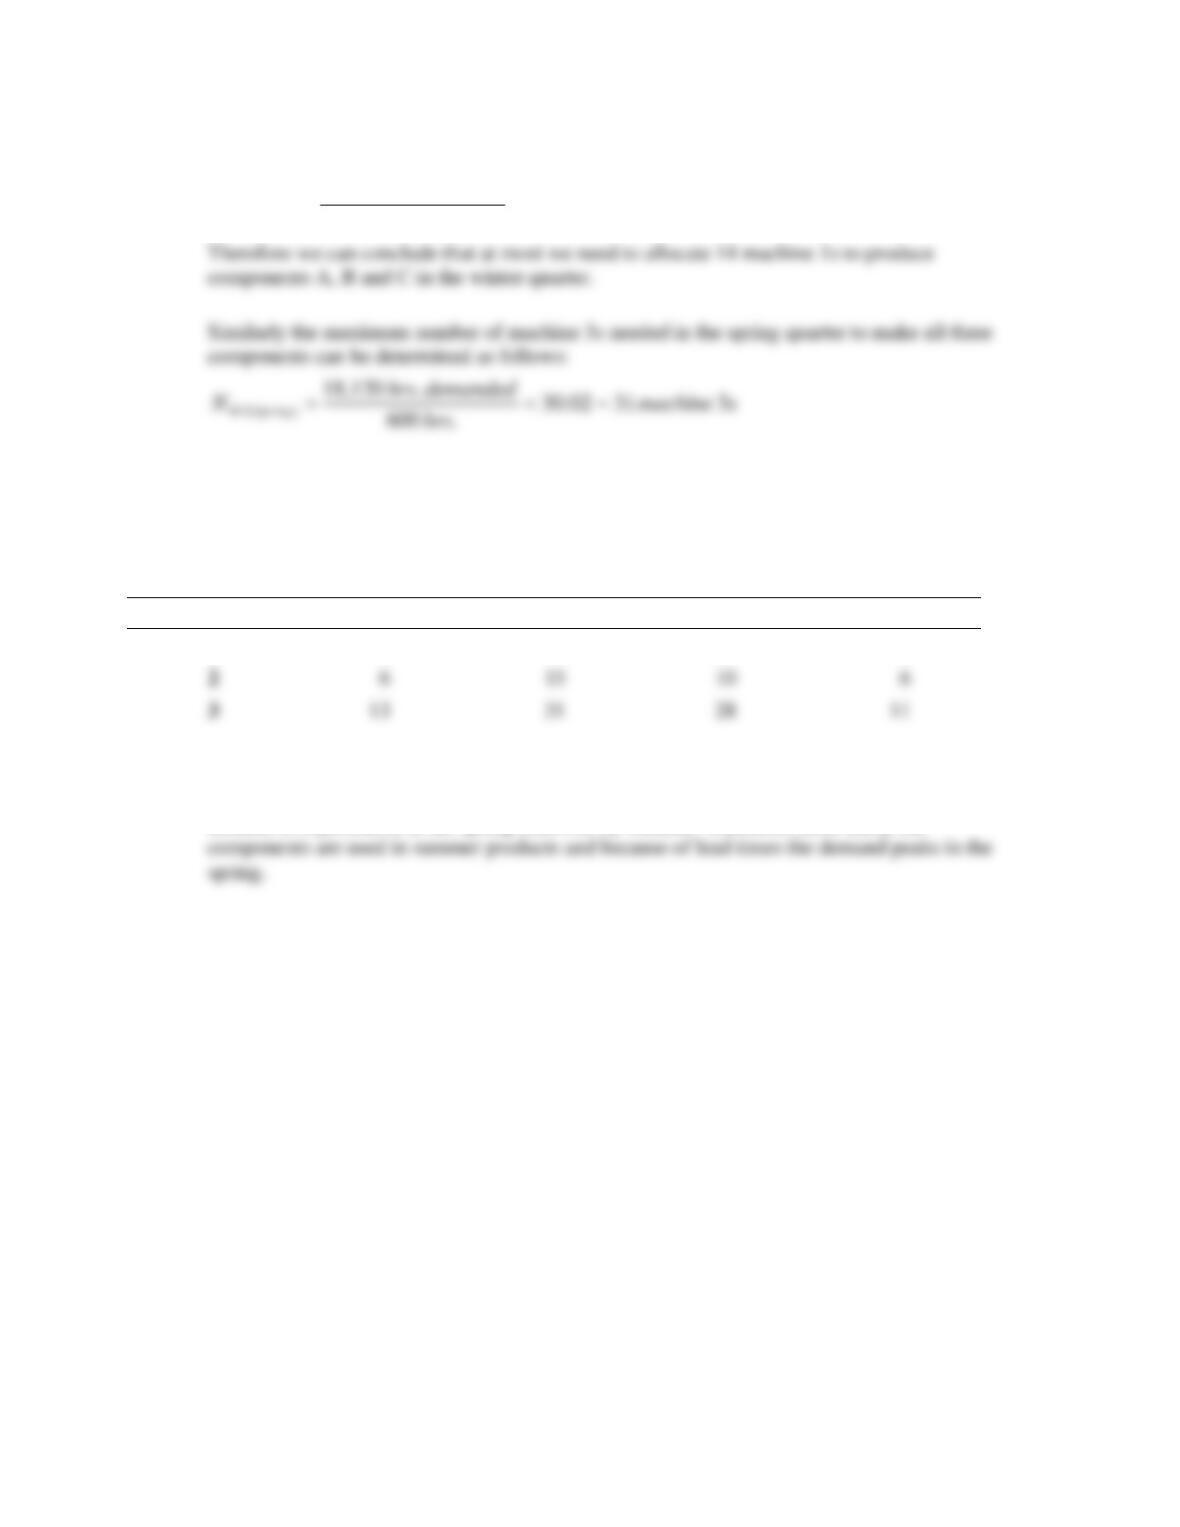
b. Since (T) (E) = 600 productive hours per quarter,
s machine
hrs
demanded hrs
NWinterM 114~06.13
.600
.840,7
)(1 ==
The following table summarizes the maximum number of each machine type needed by
quarter.
Quarterly Maximum number of machine types needed
Season
Machine
Winter
Spring
Summer
Fall
1
14*
32
22
13
2
15
10
3
13
31
28
11
*All values in the table are rounded up.
c. Yes, there appears to be a significant seasonal variation in demand. It appears that the highest
demand is experienced in the spring followed by summer. Therefore, most likely the