College Mathematics: Learning Worksheets Chapter 5
147
Name ________________________________ Date ______________ Class ____________
Goal: To solve systems of linear inequalities in two variables
In Problems 1 and 2, graph the inequality.
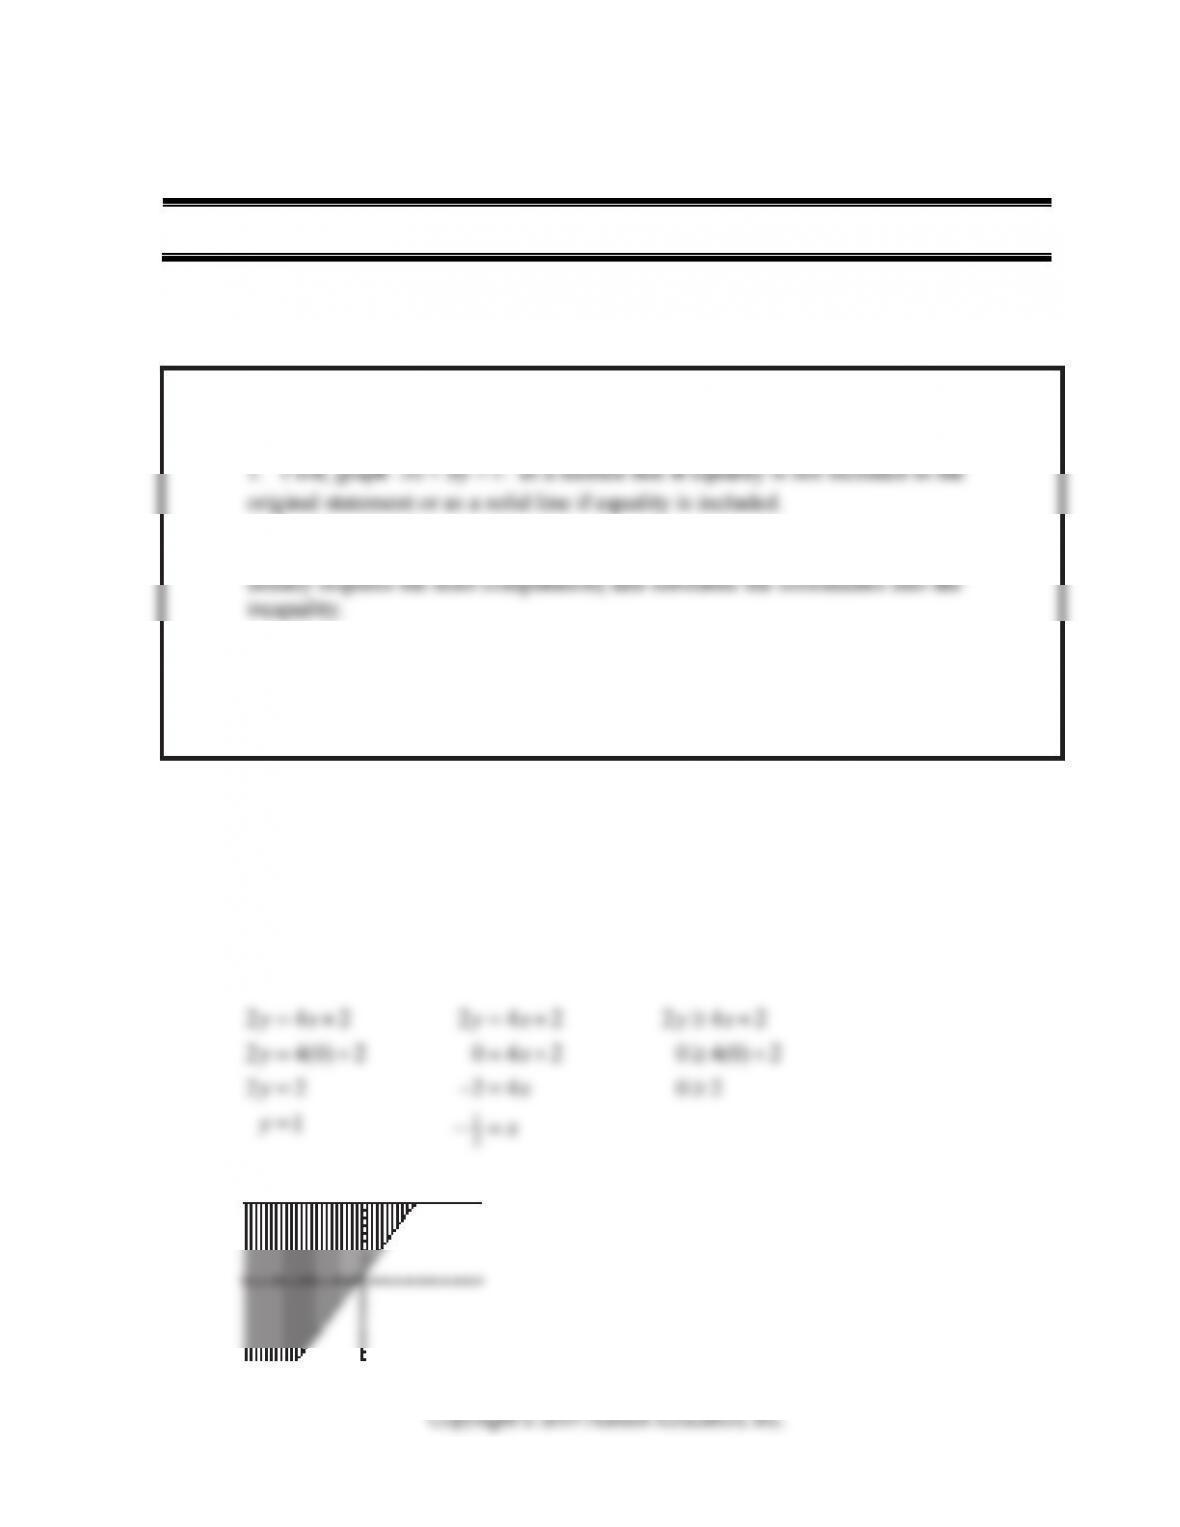
1. 242yx≥+
Graph the line as if it were an equality. We can use the x and y intercepts for the
graph. After the line is graphed, choose a point, not on the line, and test the point into the
original equation. If the statement is true, shade the half-plane containing the point. If the
statement is false, shade the half-plane not containing the point.
24(0)2
22
1
y
y
y
=+
=
=
1
2
04 2
24
x
x
x
=+
−=
−=
04(0)2
02
≥+
≥
Section 5-1 and 5-2 Systems of Linear Inequalities
Graphing Linear Inequalities
2. Choose a test point anywhere in the plane not on the line [the origin (0, 0)
3. For the graph of the original inequality, shade the half-plane containing the test
point if the original inequality is true for the test point or shade the half-plane not
containing the test point if the original inequality does not hold for the test point.
College Mathematics: Learning Worksheets Chapter 5
148
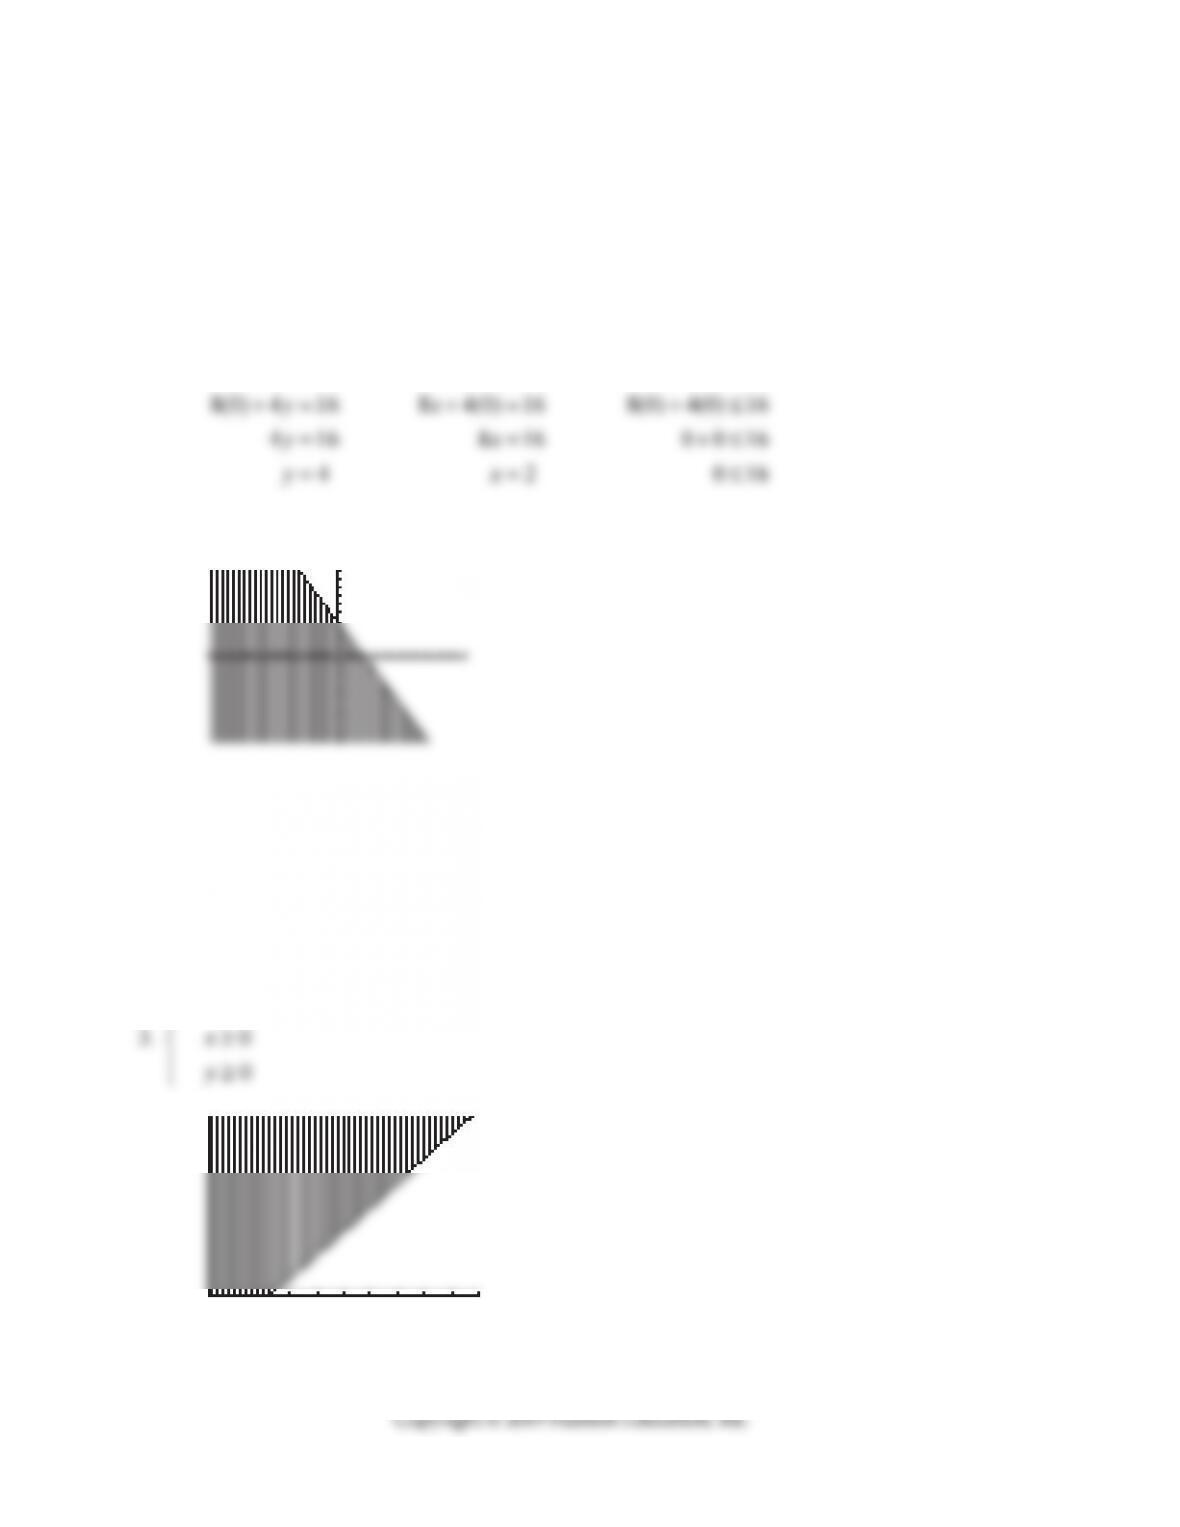
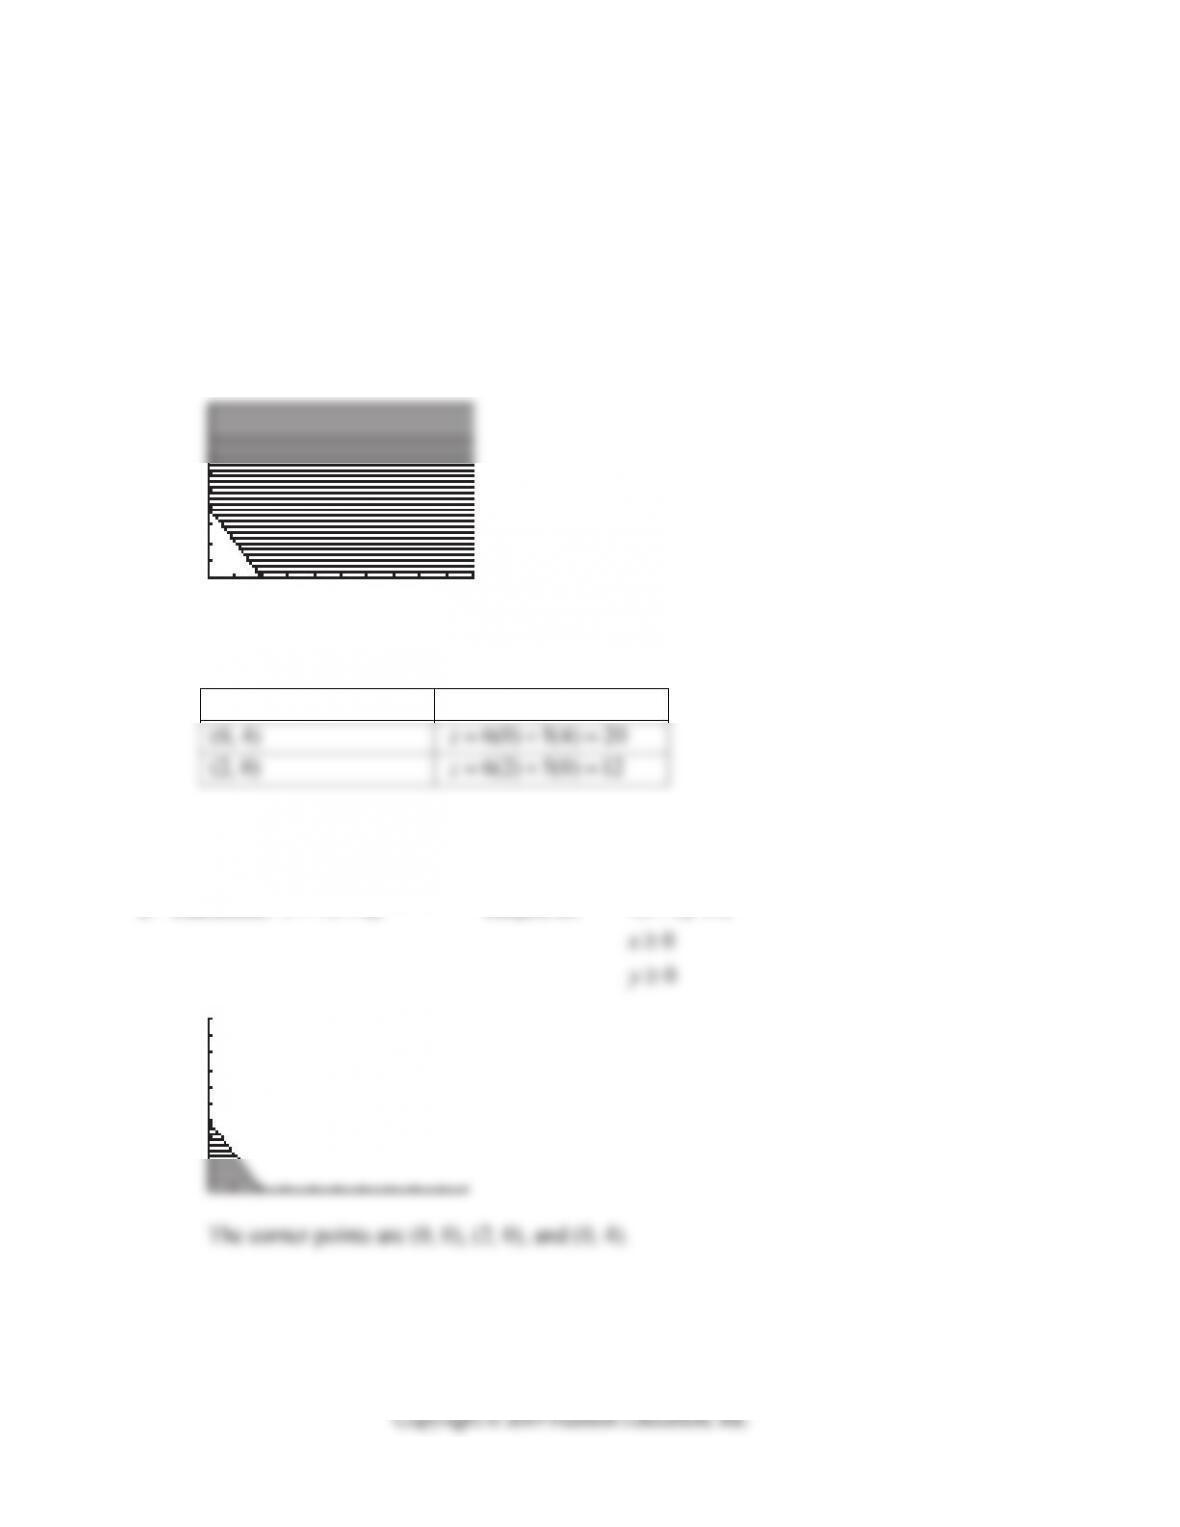
2. 8 4 16xy
+≤
Graph the line as if it were an equality. We can use the x- and y-intercepts for the
graph. After the line is graphed, choose a point, not on the line, and test the point into the
original equation. If the statement is true, shade the half–plane containing the point. If the
statement is false, shade the half-plane not containing the point.
8416
xy
+=
8416
xy
+=
8416
xy+≤
In Problems 3–6, solve the systems of inequalities graphically, state if the feasible region is
bounded or unbounded, and determine the corner points.
43 9
xy
College Mathematics: Learning Worksheets Chapter 5
149
The shaded area on the previous page is the feasible region. It is unbounded. The
corner points are found at the origin and the x-axis. The second is found by substituting zero
in for y.
43 9
xy
4
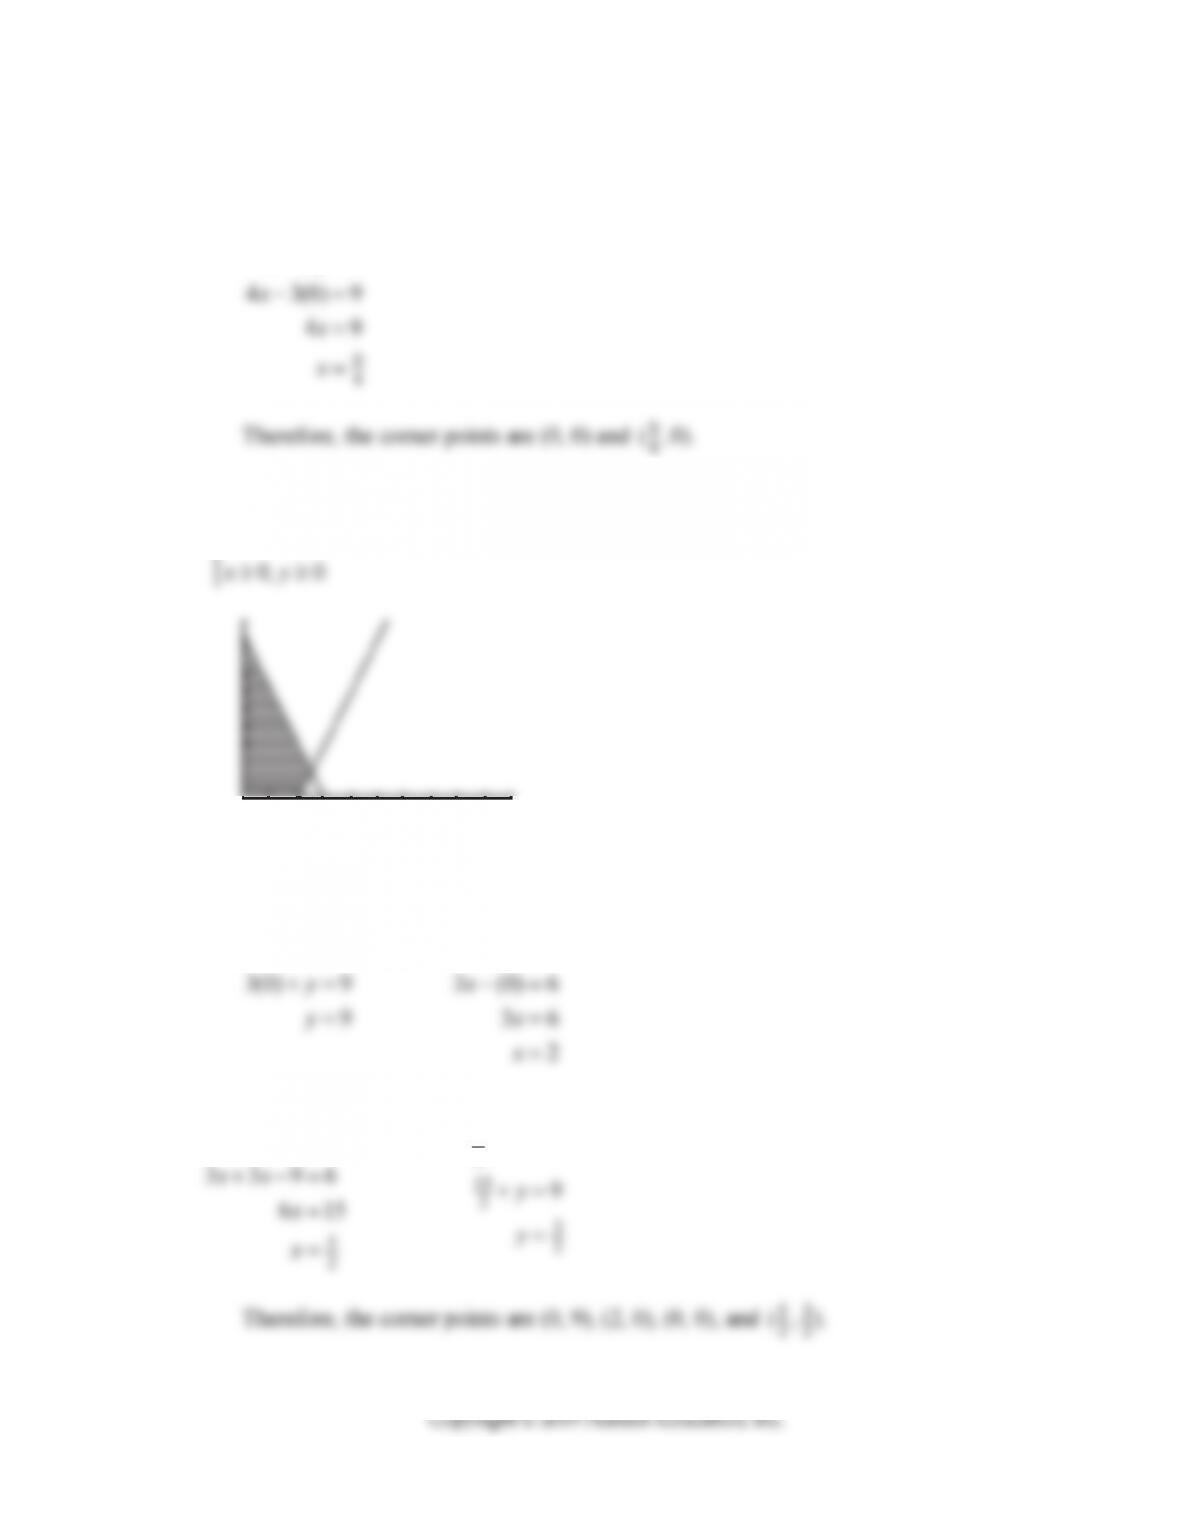
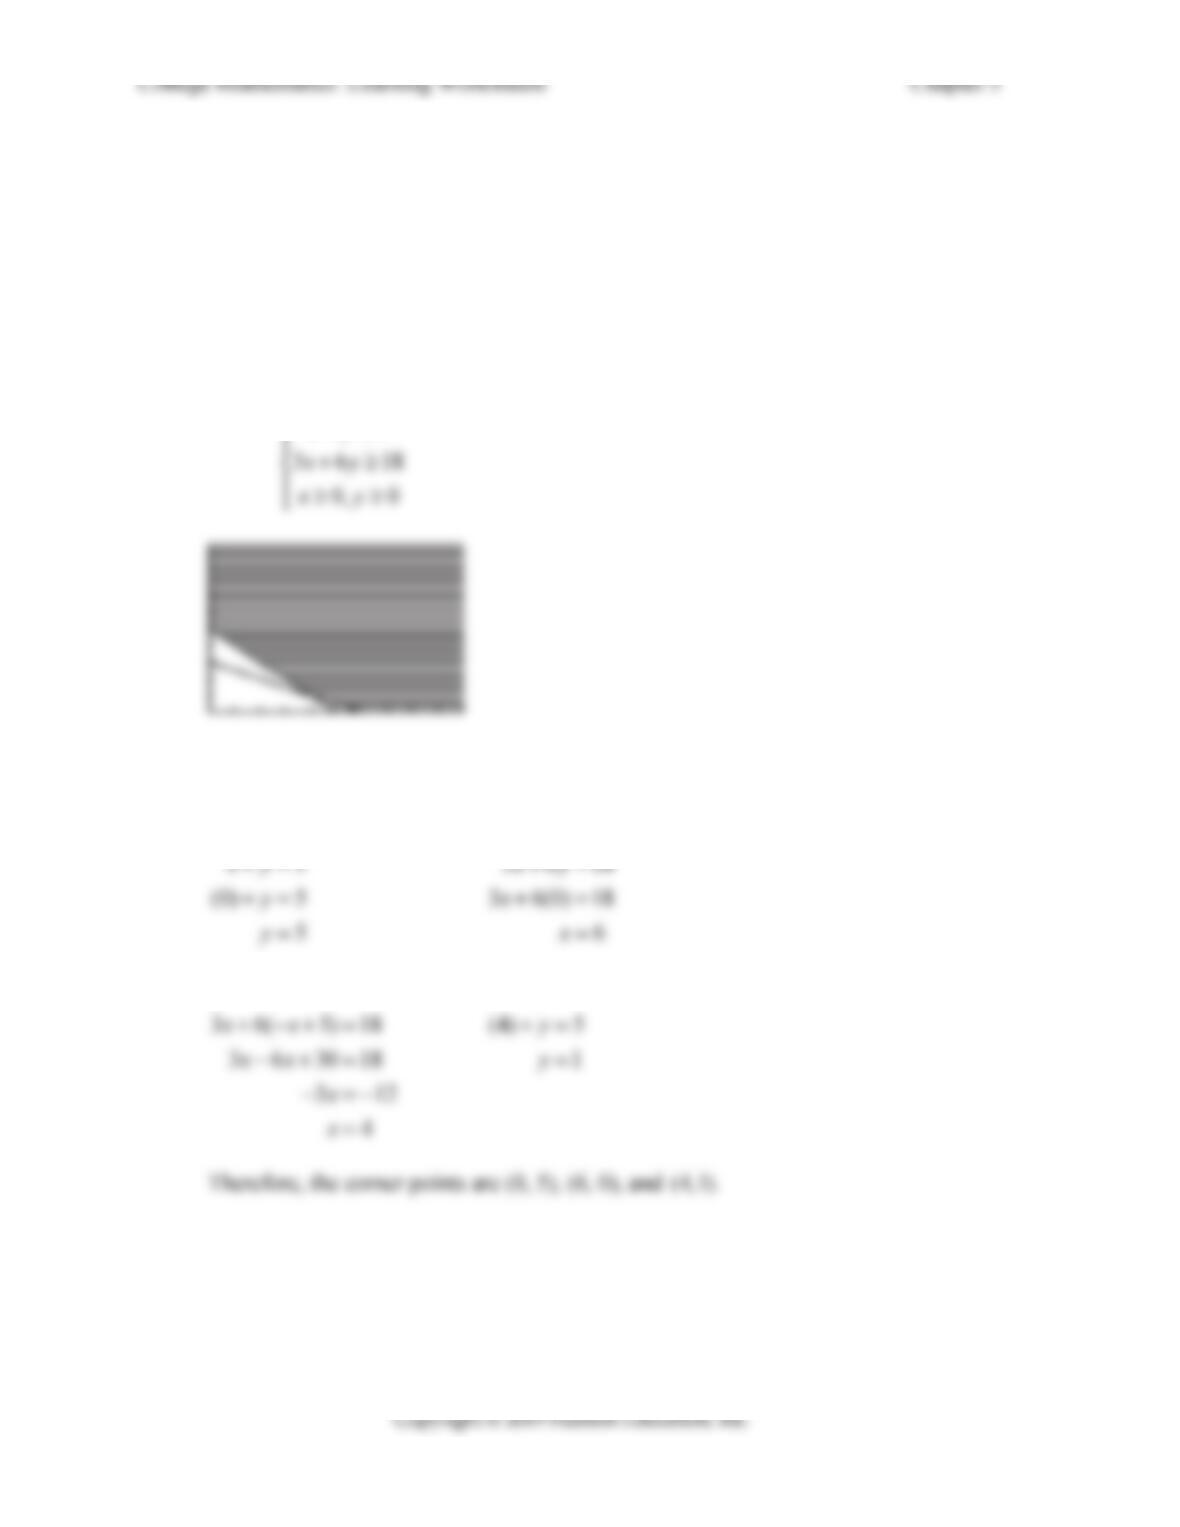
4.
36
39
xy
xy
−≤
⎧
⎪+≤
⎨
The shaded area above is the feasible region. It is bounded. The corner points are
found at the x- and y-axis, the point of intersection, and the origin. They are found by
substituting zero in for each variable and setting the two equations equal to each other.
39
xy
36
xy
−=
36
3(39)6
xy
xx
−=
−− + =
5
2
39
3( ) 9
xy
y
22
College Mathematics: Learning Worksheets Chapter 5
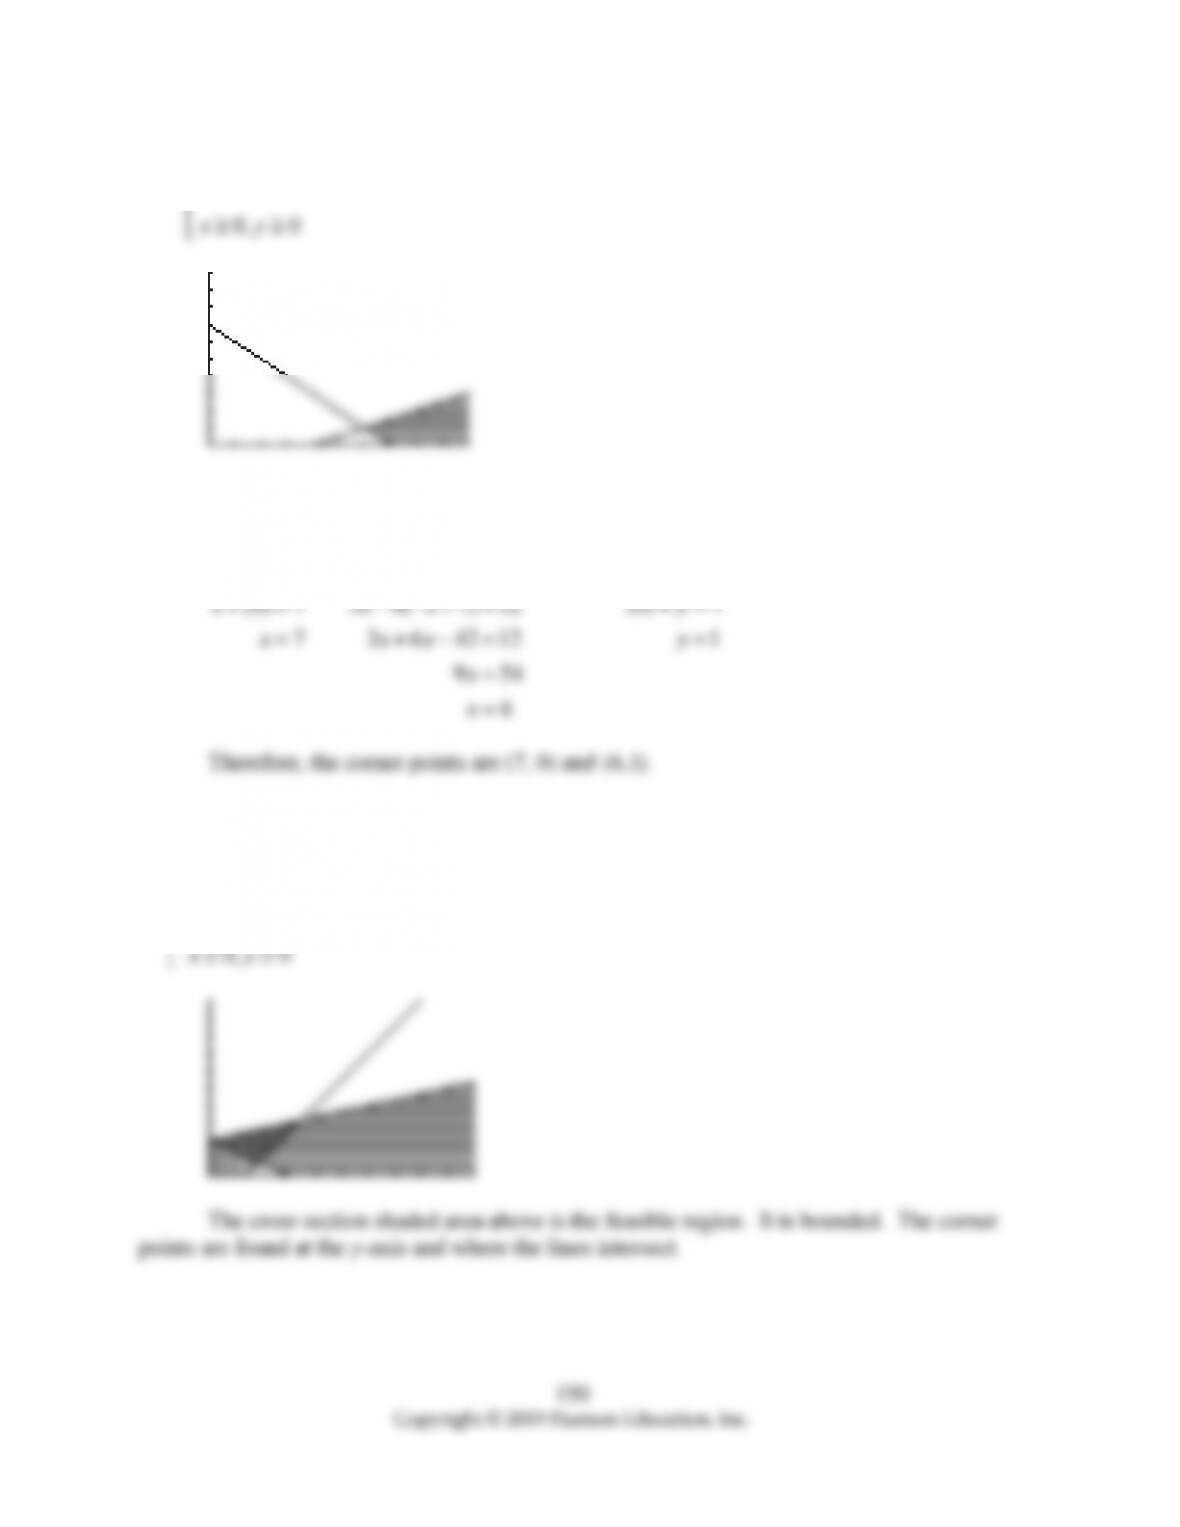
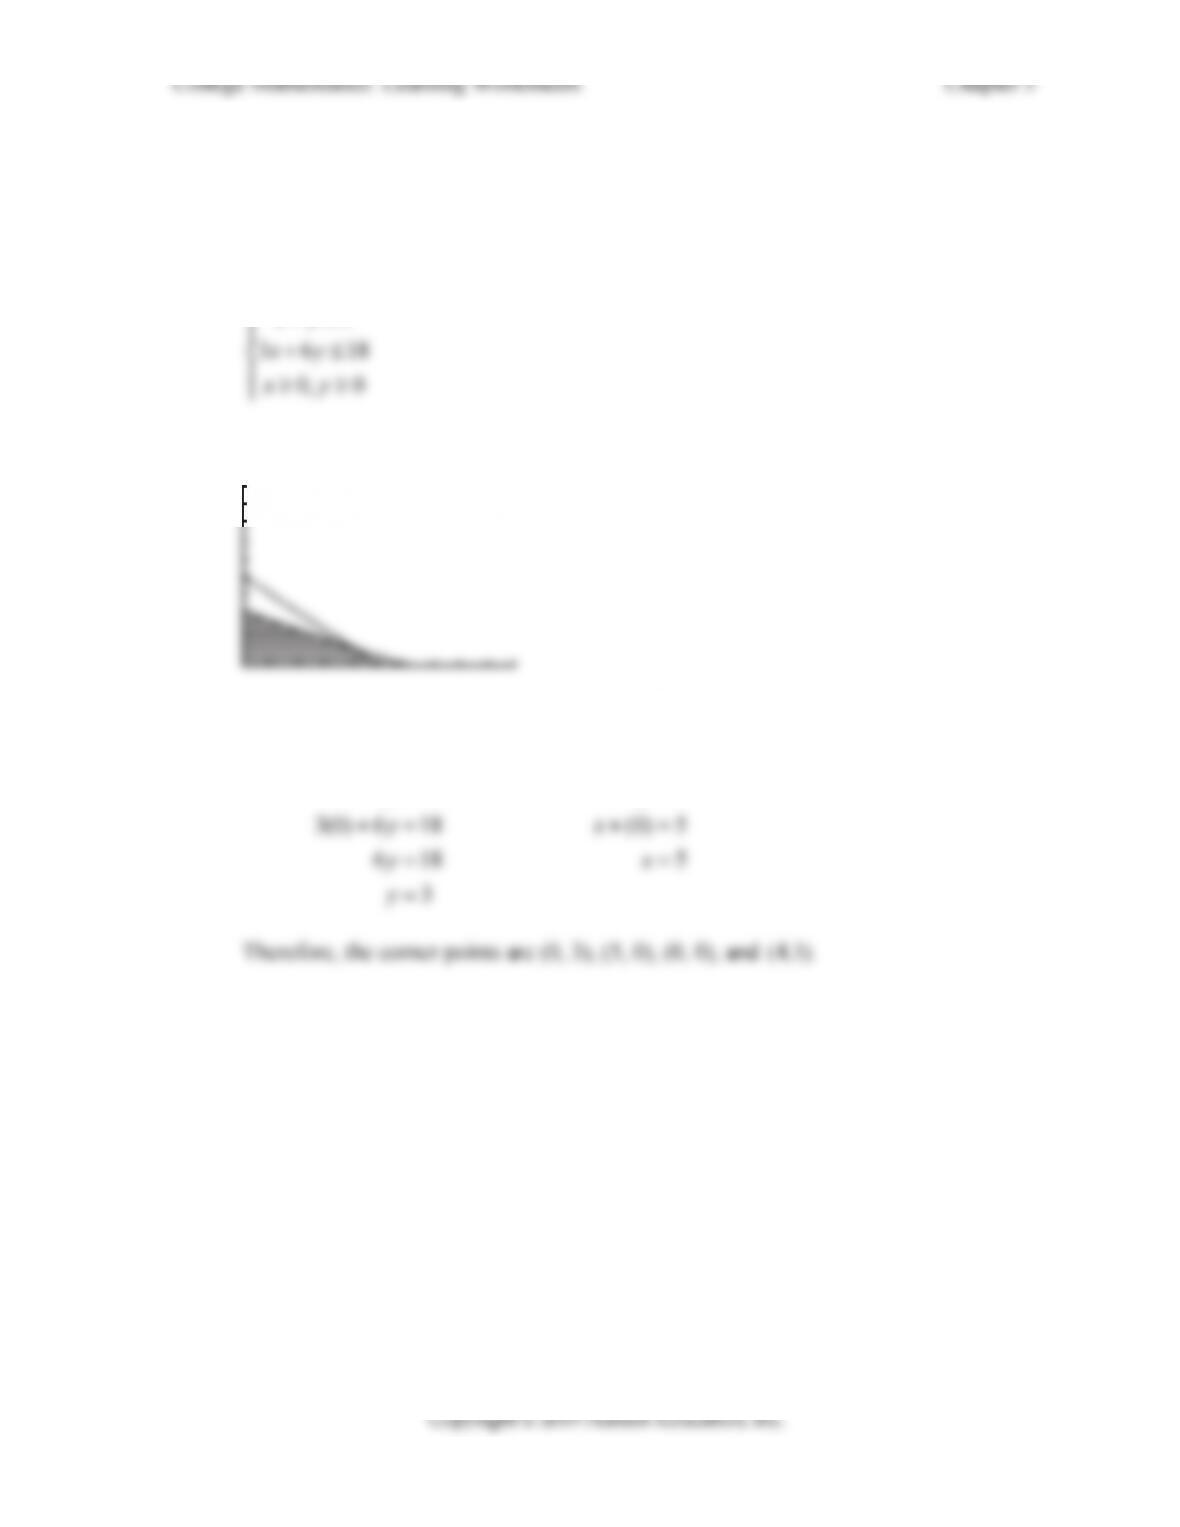
5.
3612
7
xy
xy
−≥
⎧
⎪+≥
⎨
The shaded area above is the feasible region. It is unbounded. The corner points are
found at the point of intersection and the x-axis.
7
xy
+=
36 12
xy
−=
7
xy
+=
6.
2612
23 6
32 4
xy
xy
xy
151
36
2
y
y
2
9
2
13
2
24
13
266
12
xx
x
x
13
72
13
20
13
10
13
24
2
y
y
y
3
2
2612
26( 2)12
xy
xx
24
7
32 4
3( ) 2 4
xy
y
13 13
77
152
7. A dietician needs to plan a diet for a patient using two different food combinations to
meet the patient’s needs. Each container of Food A contains 1 units of Additive #1 and 3
units of Additive #2. Each container of Food B contains 1 units of Additive #1 and 6 units of
Additive #2. Find the set of feasible solutions graphically if the patient needs at least 5 units
of Additive #1 and at least 18 units of Additive #2. List the corner points of the feasible
region.
Let
x
represent Food A and
y
represent Food B. Using the above information will
yield the following set of equations:
5
xy
+≥
⎧
The shaded area above is the feasible region. The corner points are found at the x- and
y-axis and the point of intersection. They are found by substituting zero in for each variable
and setting the two equations equal to each other.
(0) 5
5
y
y
+=
=
36(0)18
6
x
x
+=
=
3618
xy
+=
5
xy
+=
153
8. How would the graph in Problem 7 be changed if the patient needed at most 5 units of
Additive #1 and at most 18 units of Additive #2? Are the corner points of the feasible region
different?
The equations would change as follows:
5
xy
+≤
⎧
⎩
The feasible region would look as follows:
The shaded area is the new feasible region. The x-axis and y-axis intercepts will
change, and the origin becomes a corner point, but the point of intersection is still the same.
3618
xy
+=
5
xy
+=
154
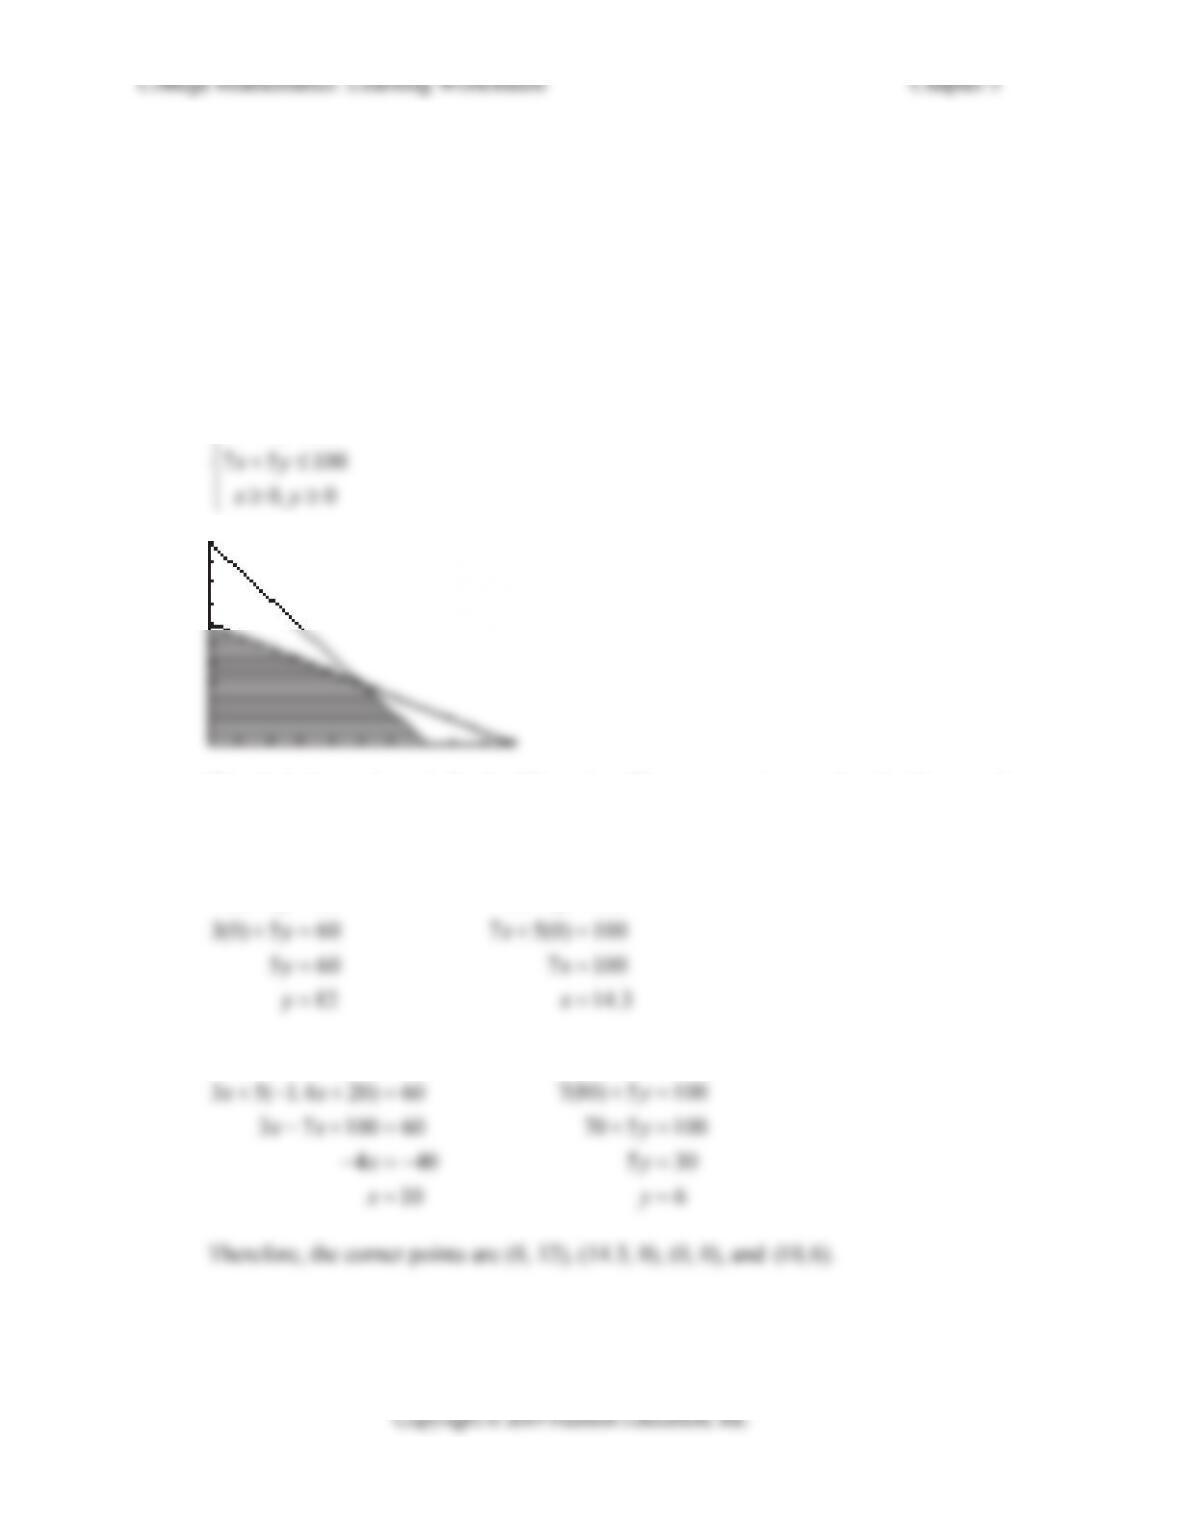
9. Ginny knits two different capes. The ‘Ginny’ model requires 3 hours of knitting and 7
hours to embellish the cape. The ‘Helen’ model requires 5 hours to knit and 5 hours to
embellish the cape. Find the feasible solutions graphically if Ginny has at most 60 hours a
month to knit the capes and at most 100 hours a month to embellish the capes. List the
corner points of the feasible region.
Let
x
represent Ginny models and
y
represent Helen models. Using the above
information will yield the following set of equations:
35 60
xy
The shaded area above is the feasible region. The corner points are found at the x- and
y- axis, at the origin, and the point of intersection. They are found by substituting zero in for
each variable and setting the two equations equal to each other.
35 60
xy
7 5 100
xy
35 60
xy
7 5 100
xy

College Mathematics: Learning Worksheets Chapter 5
155
Name ________________________________ Date ______________ Class ____________
Goal: To solve linear programming problems using a geometric approach
Section 5-3 Linear Programming in Two
Dimensions: A Geometric Approach
Theorem: Existence of Optimal Solutions
a) If the feasible region for a linear programming problem is bounded, then both the
maximum value and the minimum value of the objective function always exists.
b) If the feasible region is unbounded and the coefficients of the objective function
are positive, then the minimum value of the objective function exists but the
maximum value does not.
c) If the feasible region is empty (that is, there are no points that satisfy all the
constraints), then both the maximum and minimum values of the objective function
do not exist.
Procedure: Geometric Method for Solving Linear Programming Problems
Step 1: Graph the feasible region. Then, if an optimal solution exists according to the
above theorem, find the coordinates of each corner point.
College Mathematics: Learning Worksheets Chapter 5
156
In Problems 1–8, solve the linear programming problems.
1. Minimize: 6 5zxy
=+
subject to: 24
0
0
xy
x
y
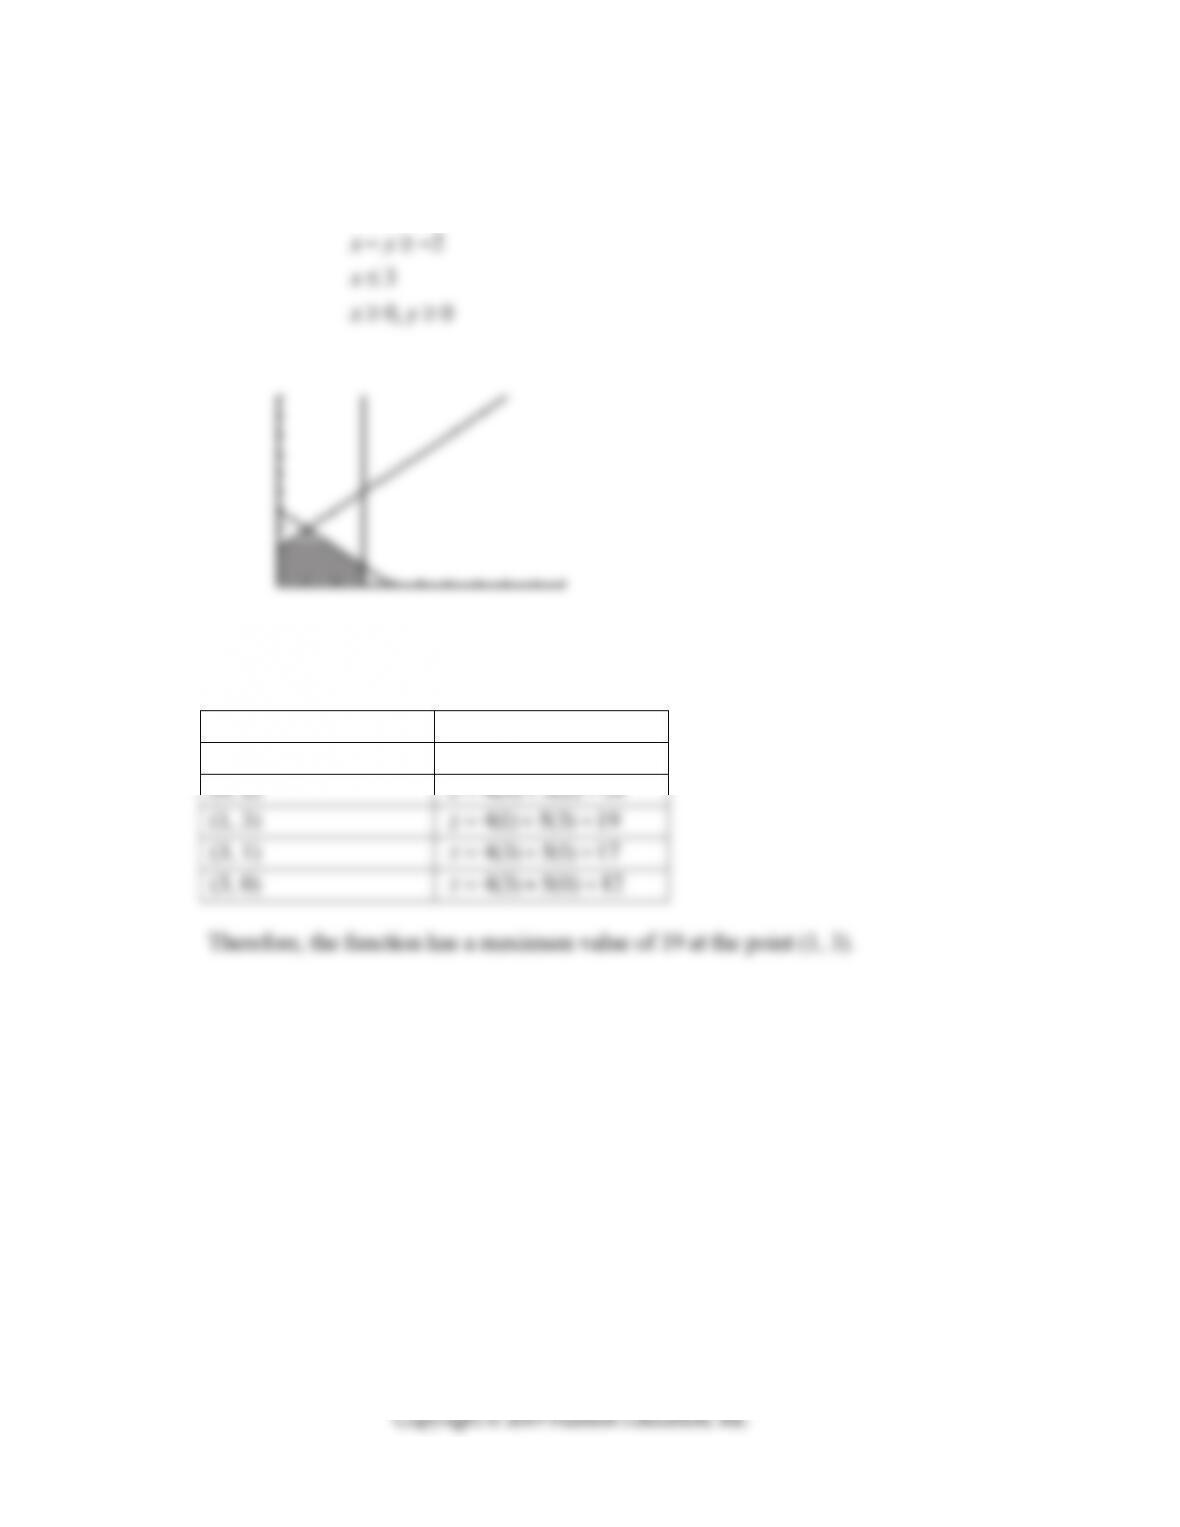
Although the feasible region is unbounded, the corner points are (0, 4) and (2, 0).
Corner Point 65zxy
=+
Therefore, the function has a minimum value of 12 at the point (2, 0).
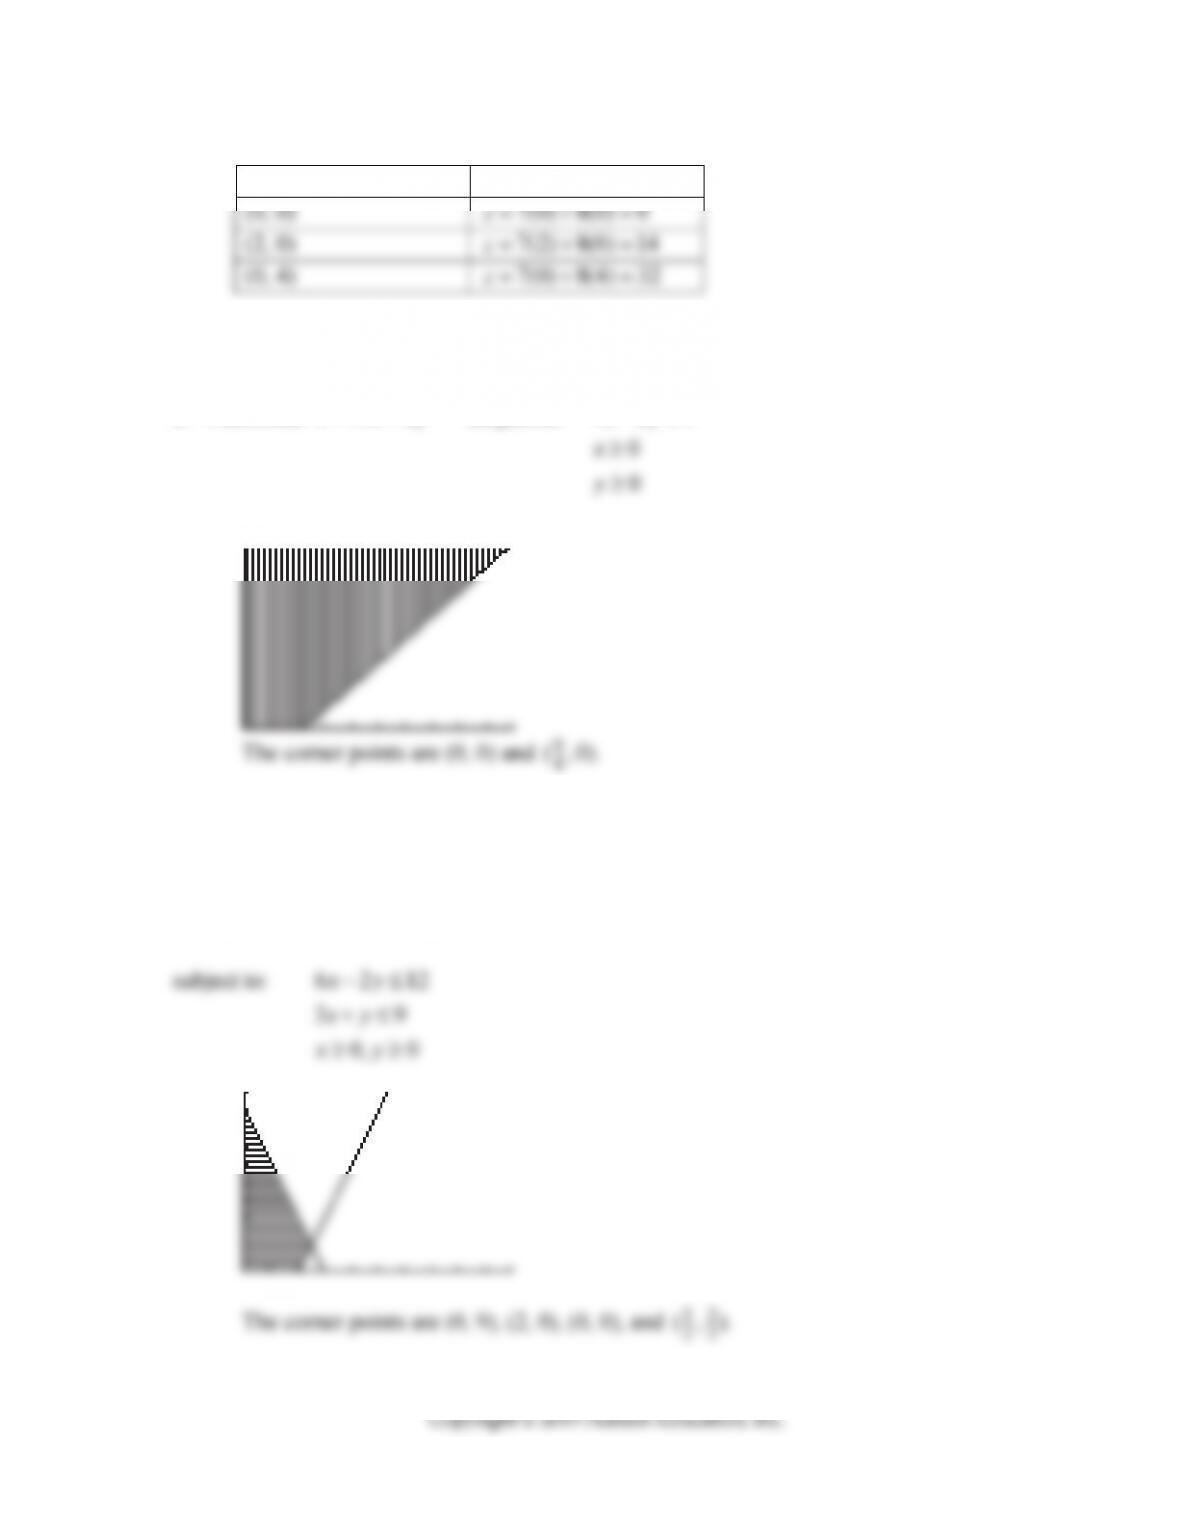
2. Maximize: 78zxy=+ subject to: 42 8
xy
College Mathematics: Learning Worksheets Chapter 5
157
Corner Point 7 8zxy
=+
Therefore, the function has a maximum value of 32 at the point (0, 4).
3. Maximize: 14 8zxy subject to: 4 3 9
xy
4
Since we are looking for a maximum and the feasible region is unbounded,
there is no maximum.
4. Maximize: 30 12zxy
=+
39
0, 0
xy
xy
22
College Mathematics: Learning Worksheets Chapter 5
158
Corner Point 30 12zxy
=+
(0, 9) 30(0) 12(9) 108z=+=
22
22
Therefore, the function has a maximum value of 108 at the point (0, 9).
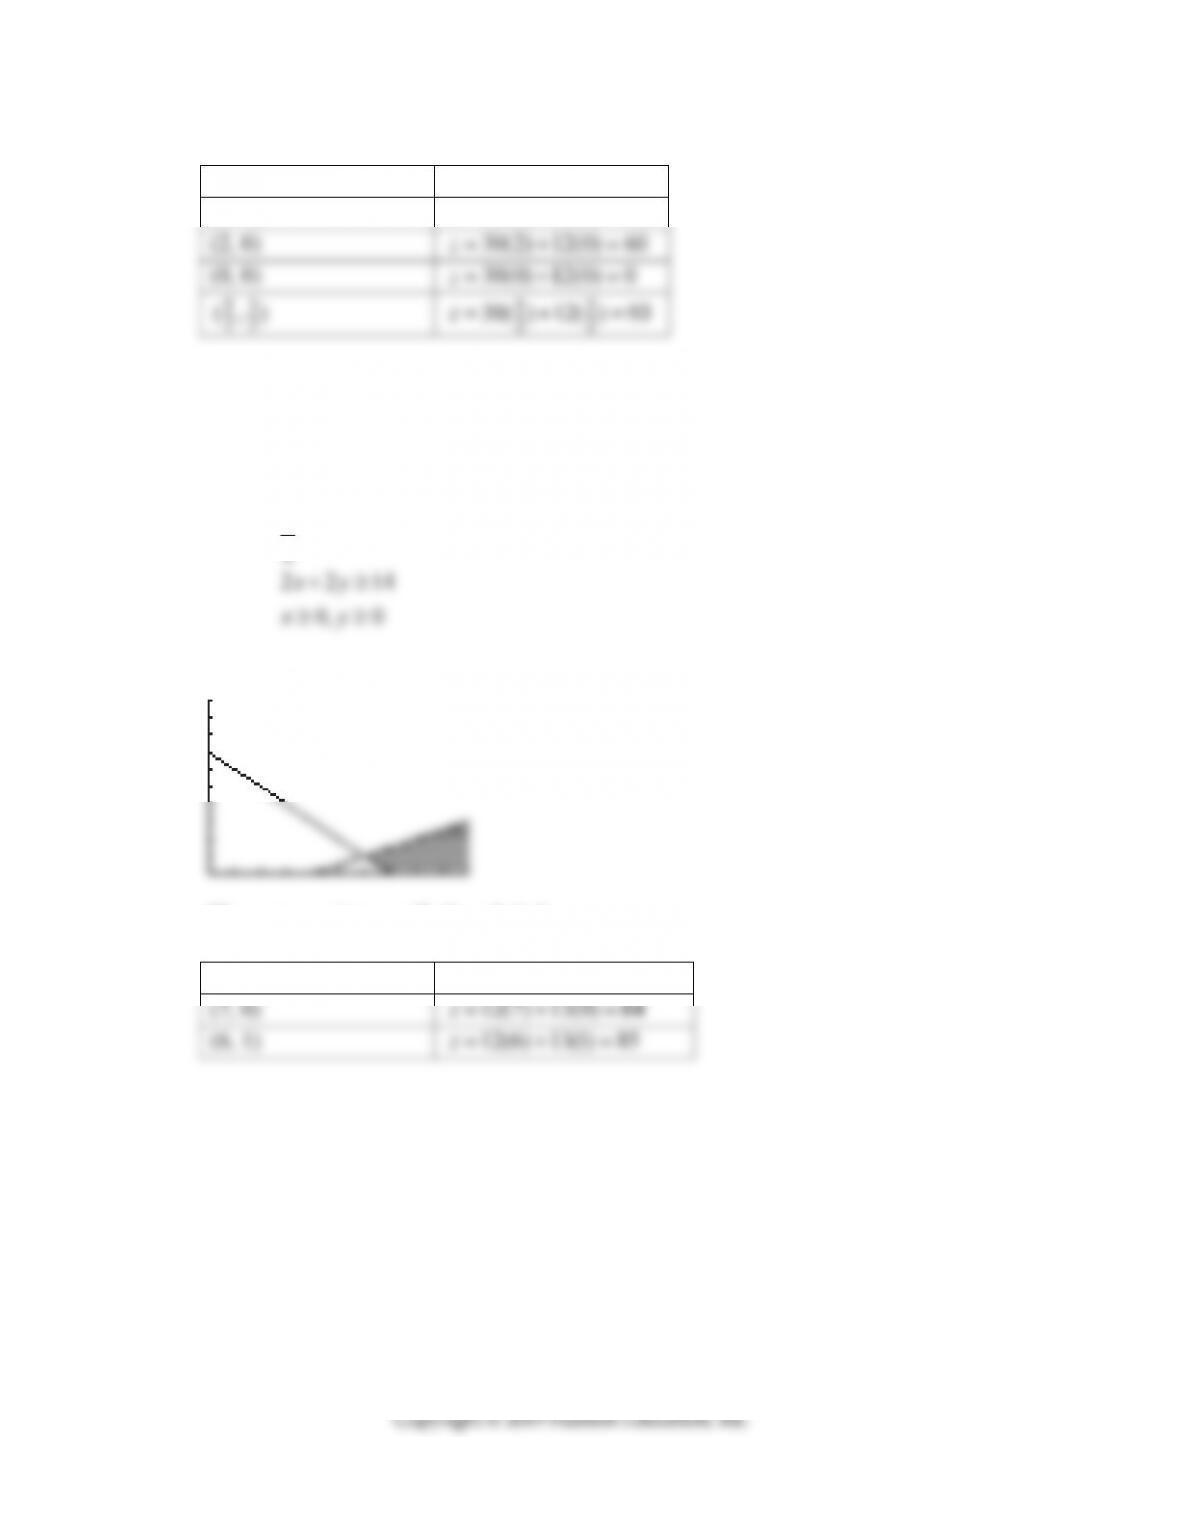
5. Minimize: 12 13zxy=+
subject to: 336
2
xy
The corner points are (7, 0) and (6,1).
Corner Point 12 12
zxy=+
Therefore, the function has a minimum value of 84 at the point (7, 0).
College Mathematics: Learning Worksheets Chapter 5
159
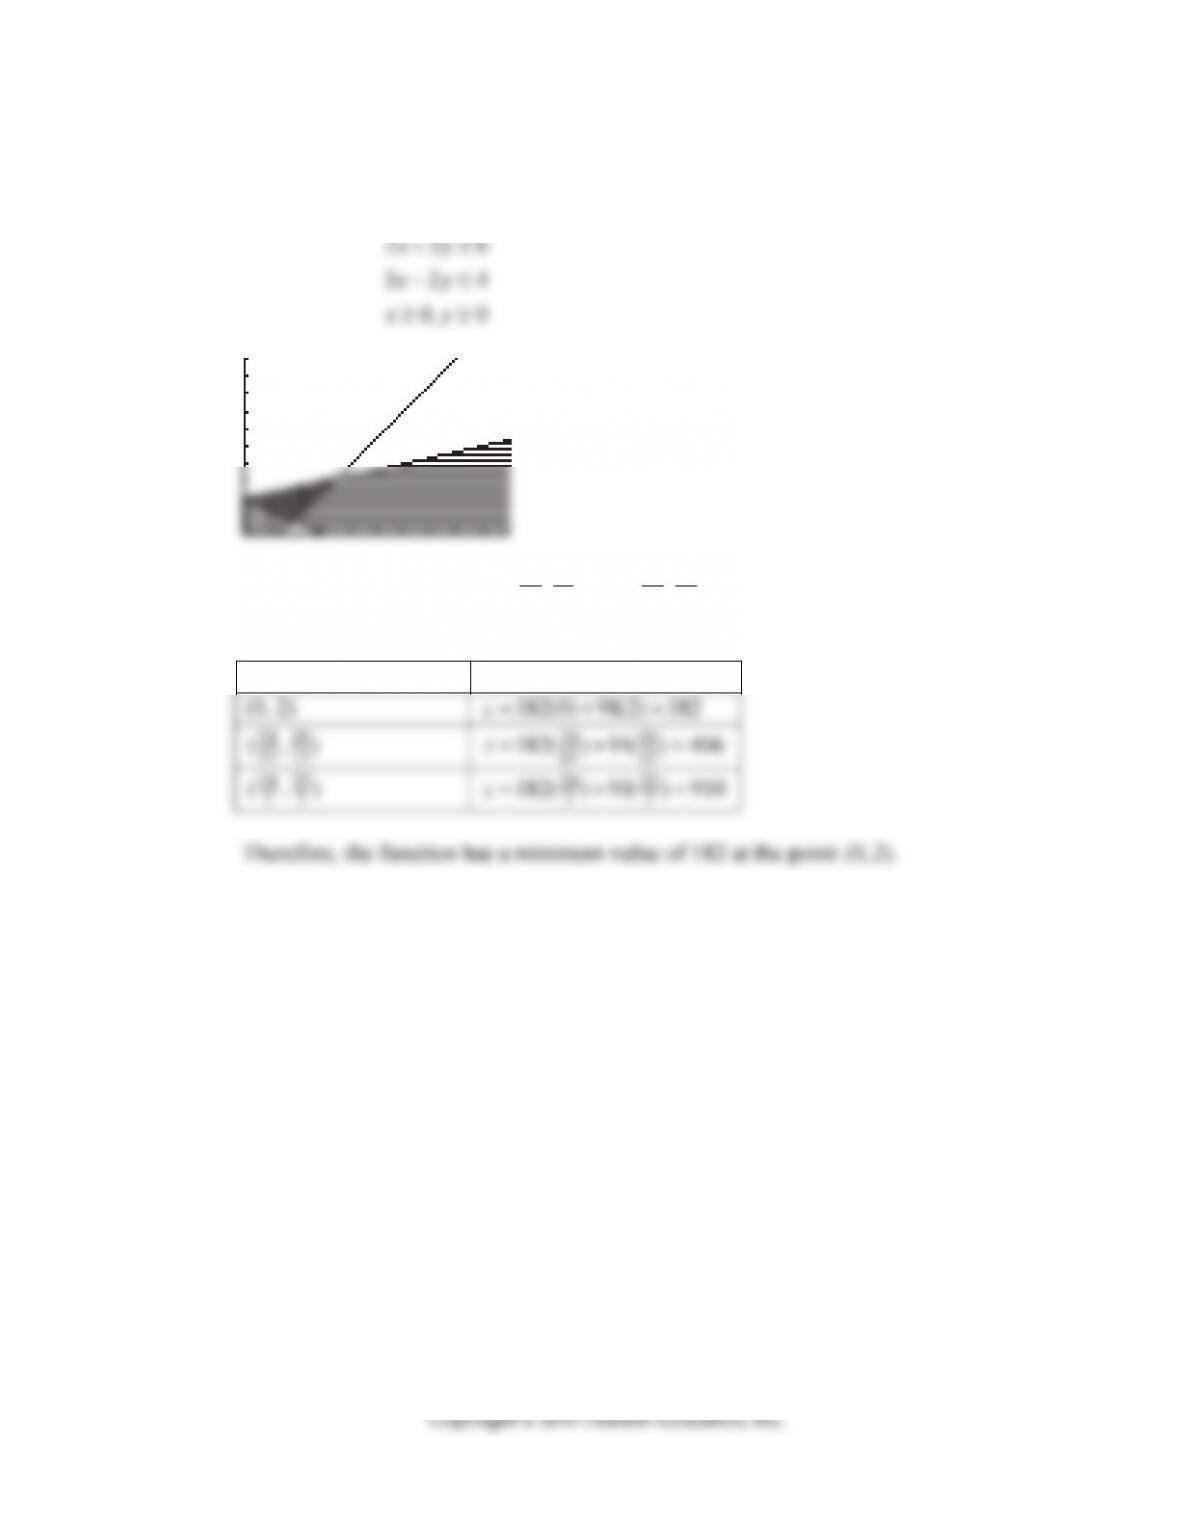
6. Minimize: 182 91
zxy=+
subject to: 2612
xy
The corner points are (0, 2), 10
24
13 13
( , ), and 24 22
77
(,).
Corner Point 182 91
zxy=+
77
77
College Mathematics: Learning Worksheets Chapter 5
160
7. Maximize: z=4
x
+5
y
subject to: 4
xy
The corner points are (0, 0), (0, 2), (1, 3), (3, 1), and (3, 0).
Corner Point 4 5
zxy
(0, 0) 4(0) 5(0) 0z
College Mathematics: Learning Worksheets Chapter 5
161
8. Maximize and minimize: z=2
x
+8
y
subject to: 9
3
xy
xy
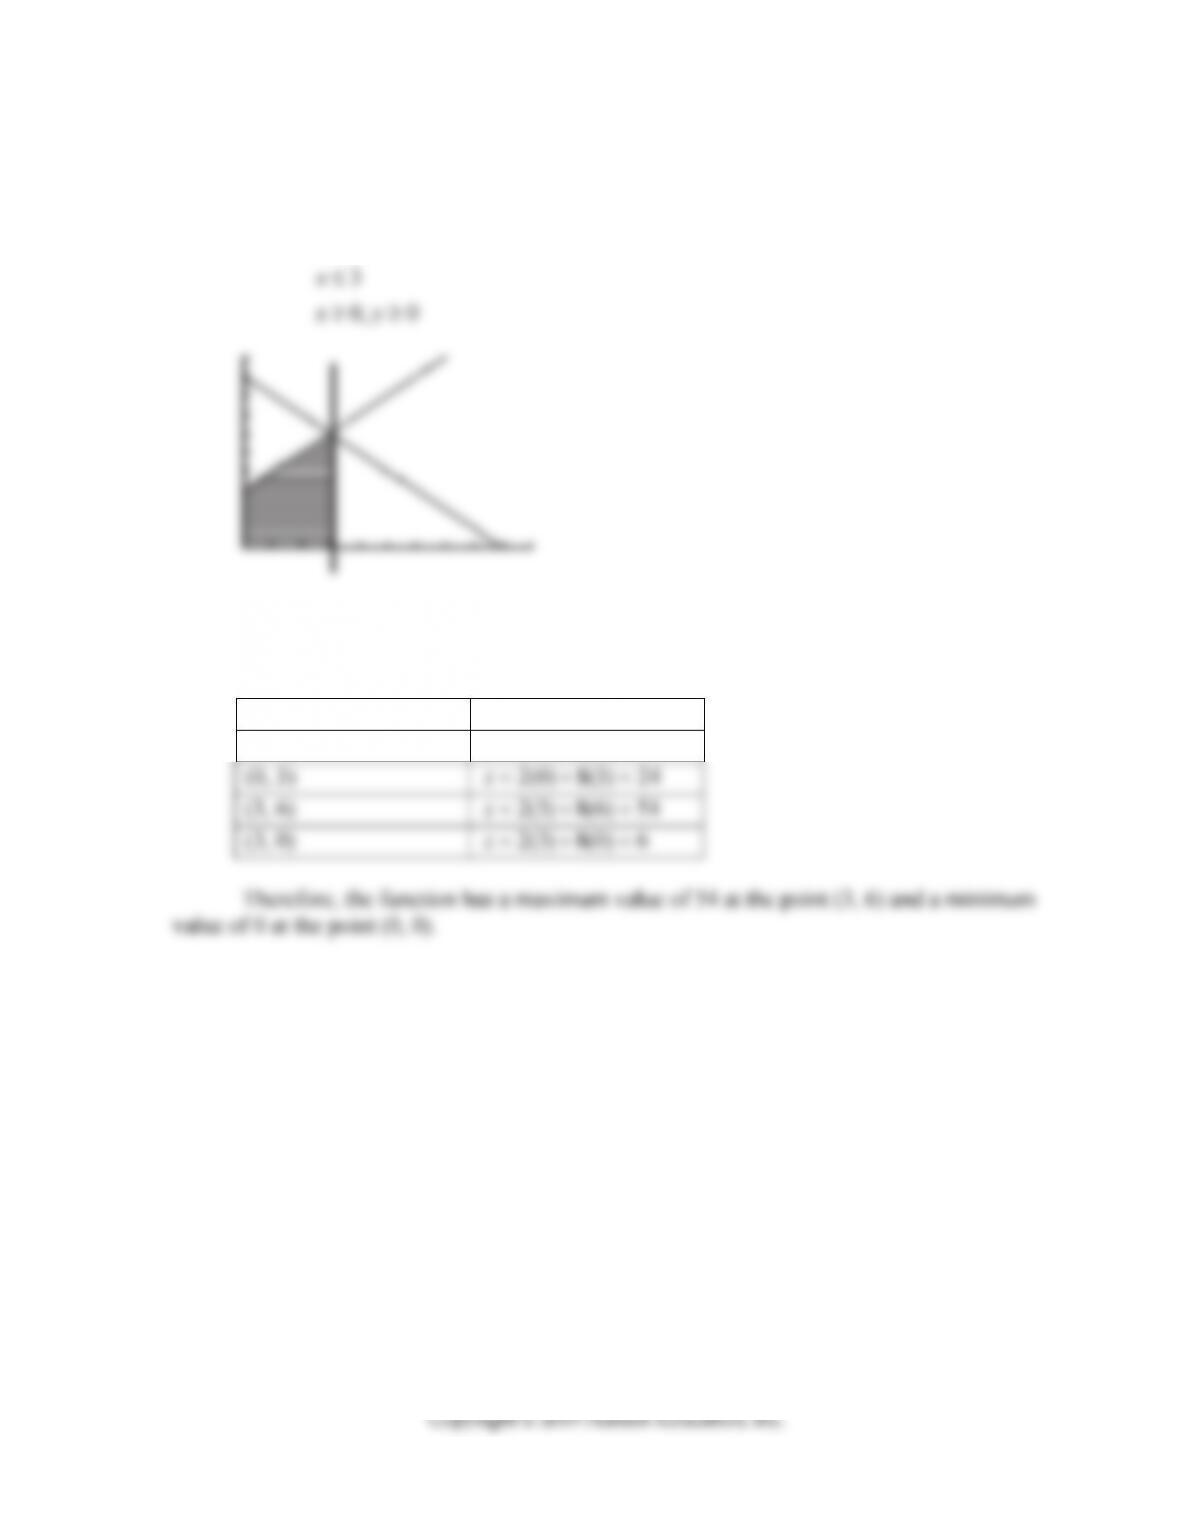
The corner points are (0, 0), (0, 3), (3, 6), and (3, 0).
Corner Point 2 8
zxy
(0, 0) 2(0) 8(0) 0z
162
9. A dietician needs to plan a diet for a patient using two different food combinations to
meet the patient’s needs. Each container of Food A contains 1 units of Additive #1 and 3
units of Additive #2. Each container of Food B contains 1 unit of Additive #1 and 6 units of
Additive #2. The patient needs at least 5 units of Additive #1 and at least 18 units of
Additive #2. How many containers of each food should the dietician use to meet the patients
needs and minimize the cost if one container of Food A costs $5 and each container of Food
B costs $9?
Let
x
represent Food A and
y
represent Food B. Using the above information will
yield the following set of equations:
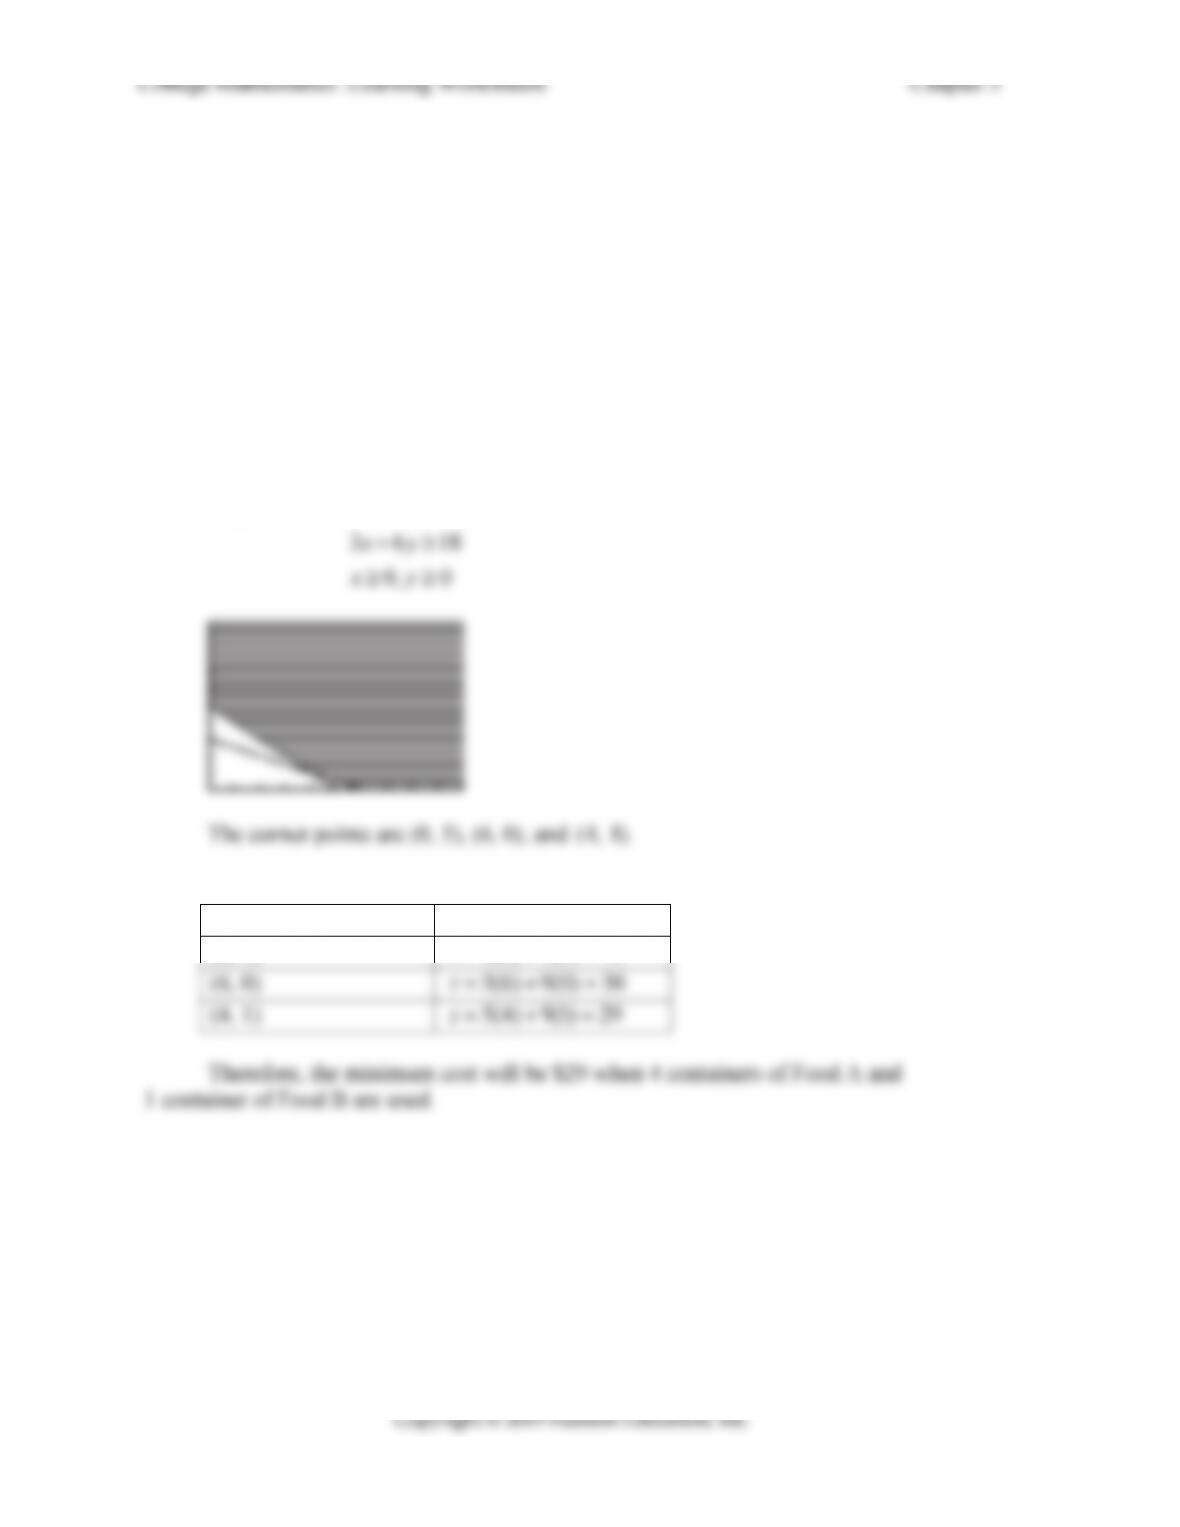
Minimize the function: 5 9
zxy=+
subject to: 5
xy
+≥
Corner Point 5 9
zxy=+
(0, 5) 5(0) 9(5) 45z=+=
163
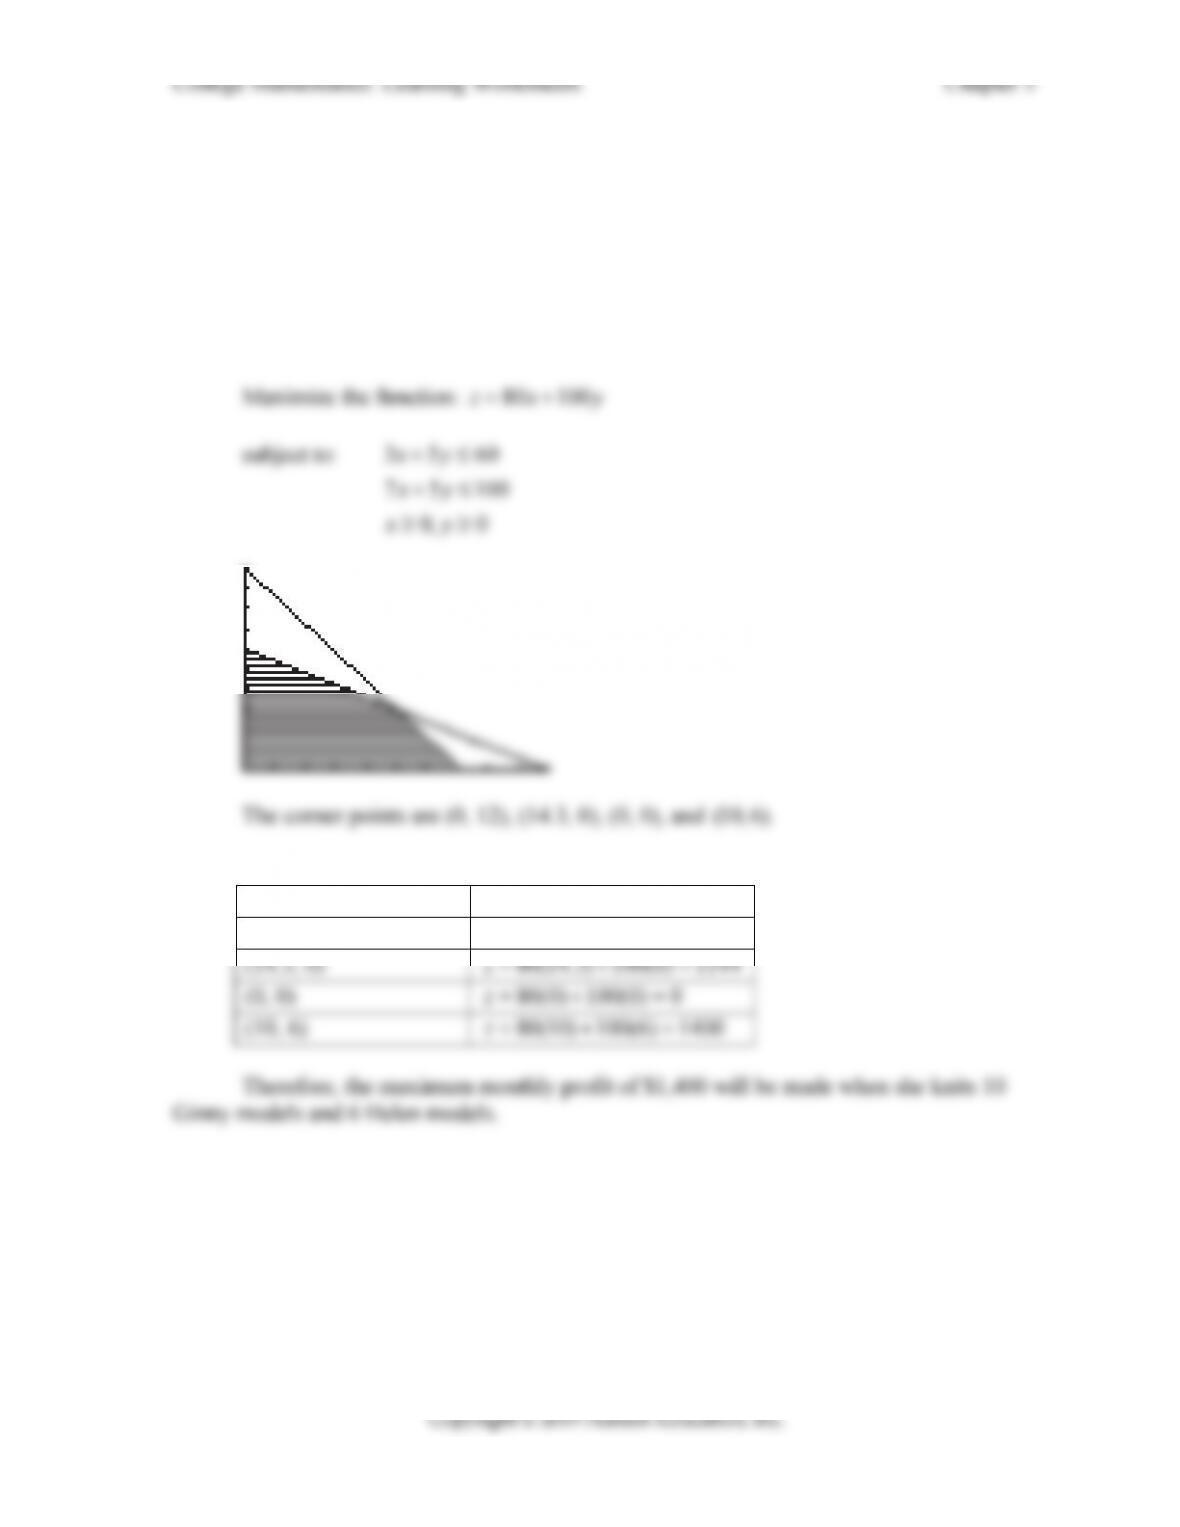
10. Ginny knits two different capes. The ‘Ginny’ model requires 3 hours of knitting and 7
hours to embellish the cape. The ‘Helen’ model requires 5 hours to knit and 5 hours to
embellish the cape. Ginny has at most 60 hours a month to knit the capes and at most 100
hours a month to embellish the capes. How many capes should she make to maximize her
profit if she makes a profit of $80 on each ‘Ginny’ cape and a profit of $100 on each ‘Helen’.
Let
x
represent Ginny models and
y
represent Helen models. Using the above
information will yield the following set of equations:
Corner Point 80 100
zx y
(0, 12) 80(0) 100(12) 1200z
164
11. The top two dolls that a toy manufacturer makes are called Baby Wiggles and Sleepy
Baby. To make a case of Baby Wiggles takes 10 units of raw material and 1 unit of time to
assemble. To make a case of Sleepy Baby takes 6 units of raw material and 2 units of time to
assemble. On a given day the manufacturer has at most 300 units of raw material and 44
units of time. If the manufacturer makes a profit of $170 on each case of Baby Wiggles and
$140 on each case of Sleepy Baby, how many cases of each type of doll should the
manufacturer make in order to maximize profit?
Let
x
represent cases of Baby Wiggles and
y
represent cases of Sleepy Baby. Using
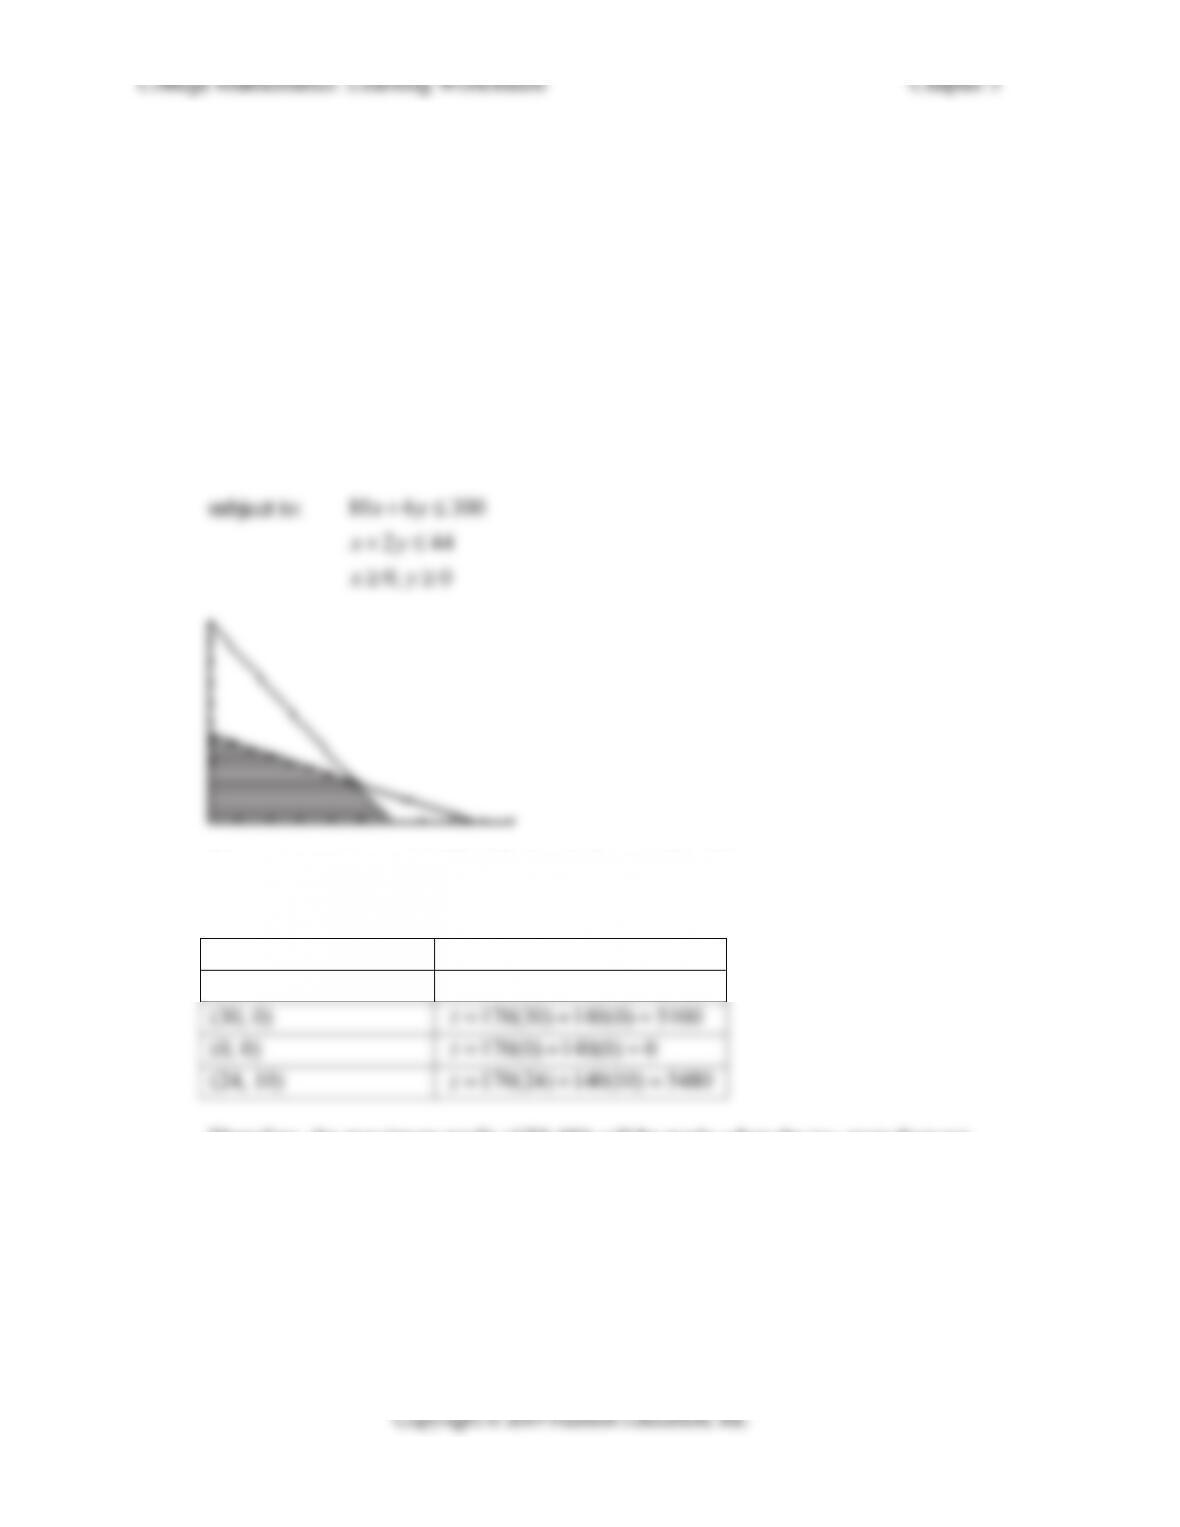
the above information will yield the following set of equations:
Maximize the function: 170 140
zxy=+
The corner points are (0, 22), (30, 0), (0, 0), and (24, 10).
Corner Point 170 140
zxy=+
(0, 22) 170(0) 140(22) 3000z=+ =
Therefore, the maximum profit of $5,480 will be made when the toy manufacturer
makes 24 cases of Baby Wiggles and 10 cases of Sleepy Baby.