
Excel Templates to accompany Operations Management, Eleventh Edition
created by Lee Tangedahl
Copyright © 2012 by The McGraw Hill Companies, Inc. All rights reserved.
Supplement to Chapter Four – Reliability
Templates: Reliability Solved Problems Solved Problem 2
MTBF – Exponential Distribution (B) Solved Problem 4
Service Life – Normal Distribution (B) Solved Problem 6
Examples Example 1
Example 2
Example 3
Example 4
See Instructions template for complete instructions.
Availability (B)
Lecture Suggestions
Reliability
<Back
0.9000 0.9200
Clear
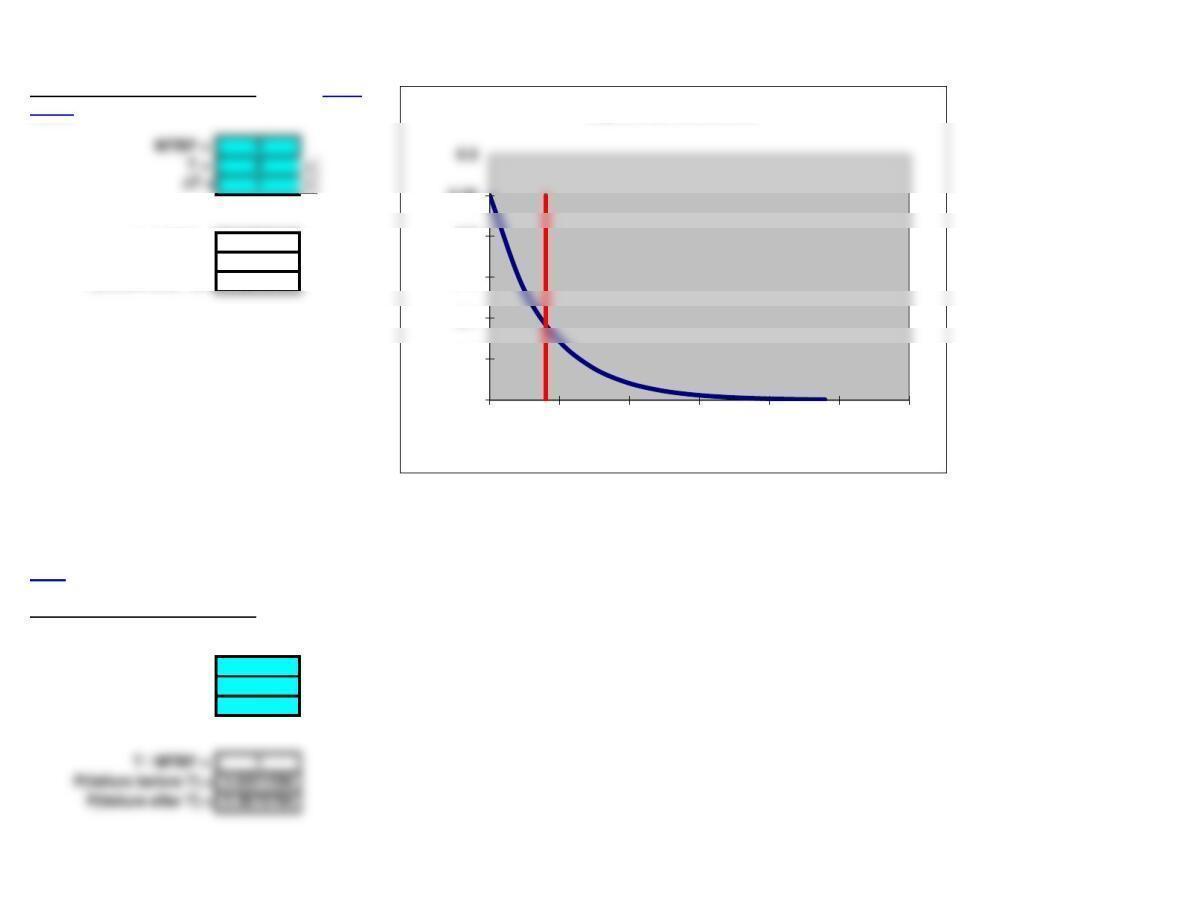
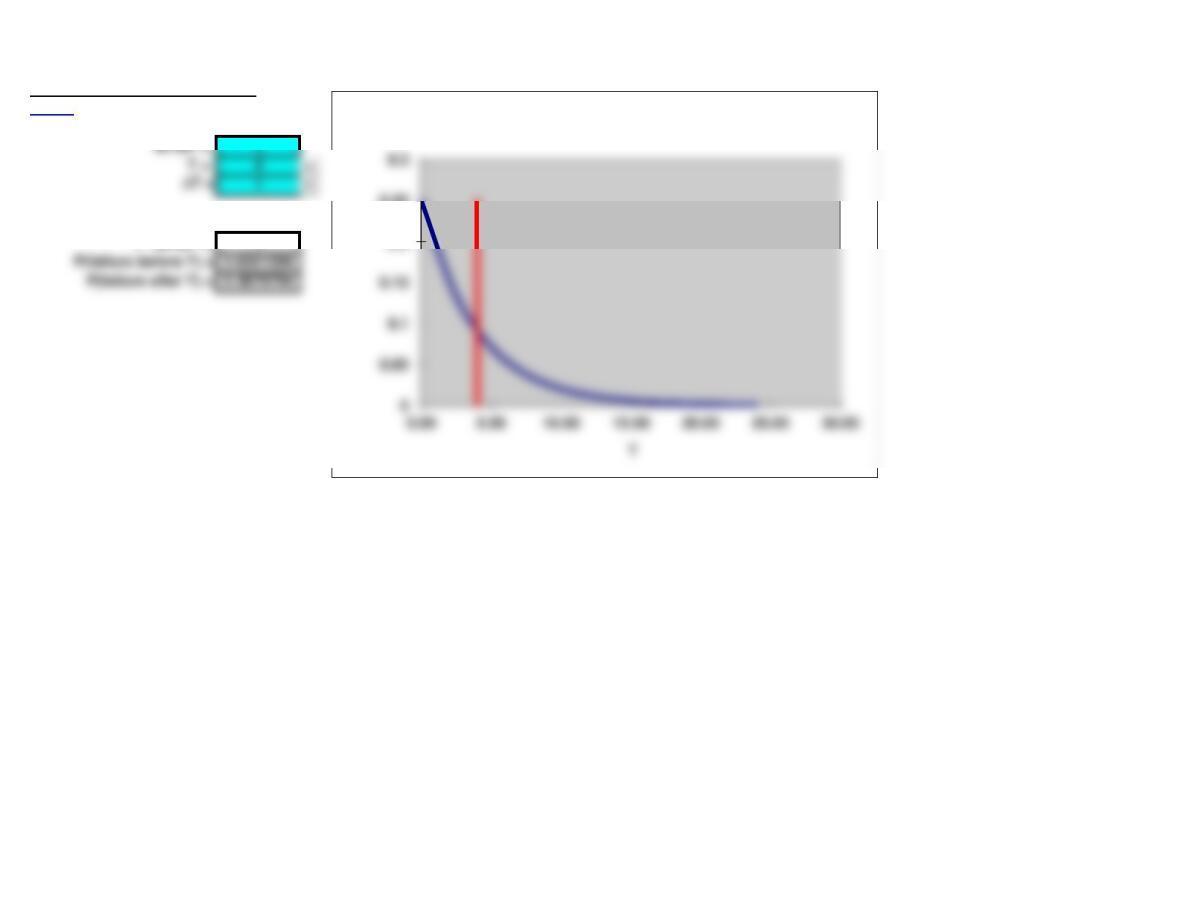
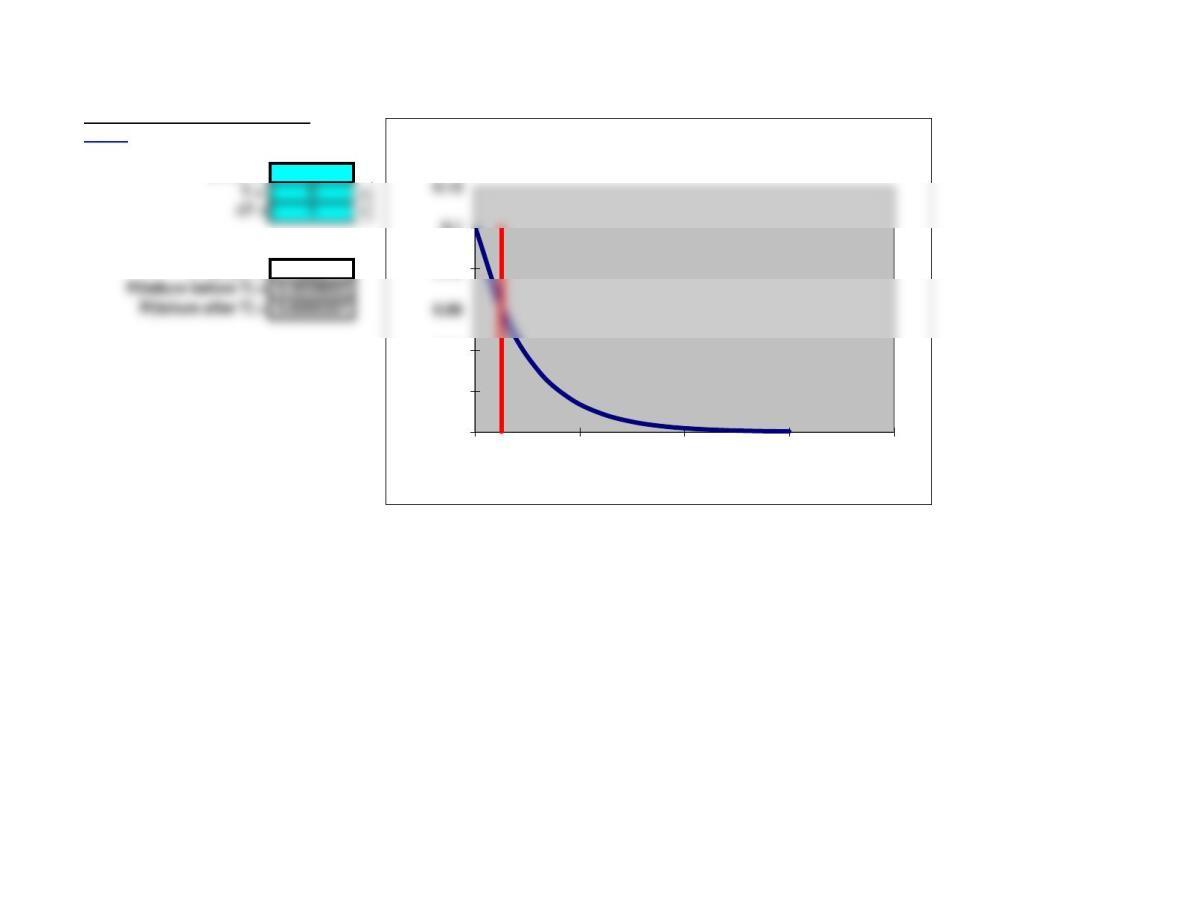
MTBF – Exponential
MTBF – Exponential Distribution Basic
<Back 0.00000 0.25
12.00000 0.0124468
T / MTBF = 1 16.80000 0.0037489
P(failure before T) = 0.6321206 19.20000 0.0020574
P(failure after T) = 0.3678794 21.60000 0.0011291
4 0
Basic template: You can simply copy the basic template below and paste into another worksheet.
^Top
MTBF – Exponential Distribution
MTBF = 4
T = 4
DT = 1
0
0.05
0.1
0.15
0.2
0.25
0.00 5.00 10.00 15.00 20.00 25.00 30.00
T
Exponential Distribution
Page 3
DT = 19.60000 0.0226795
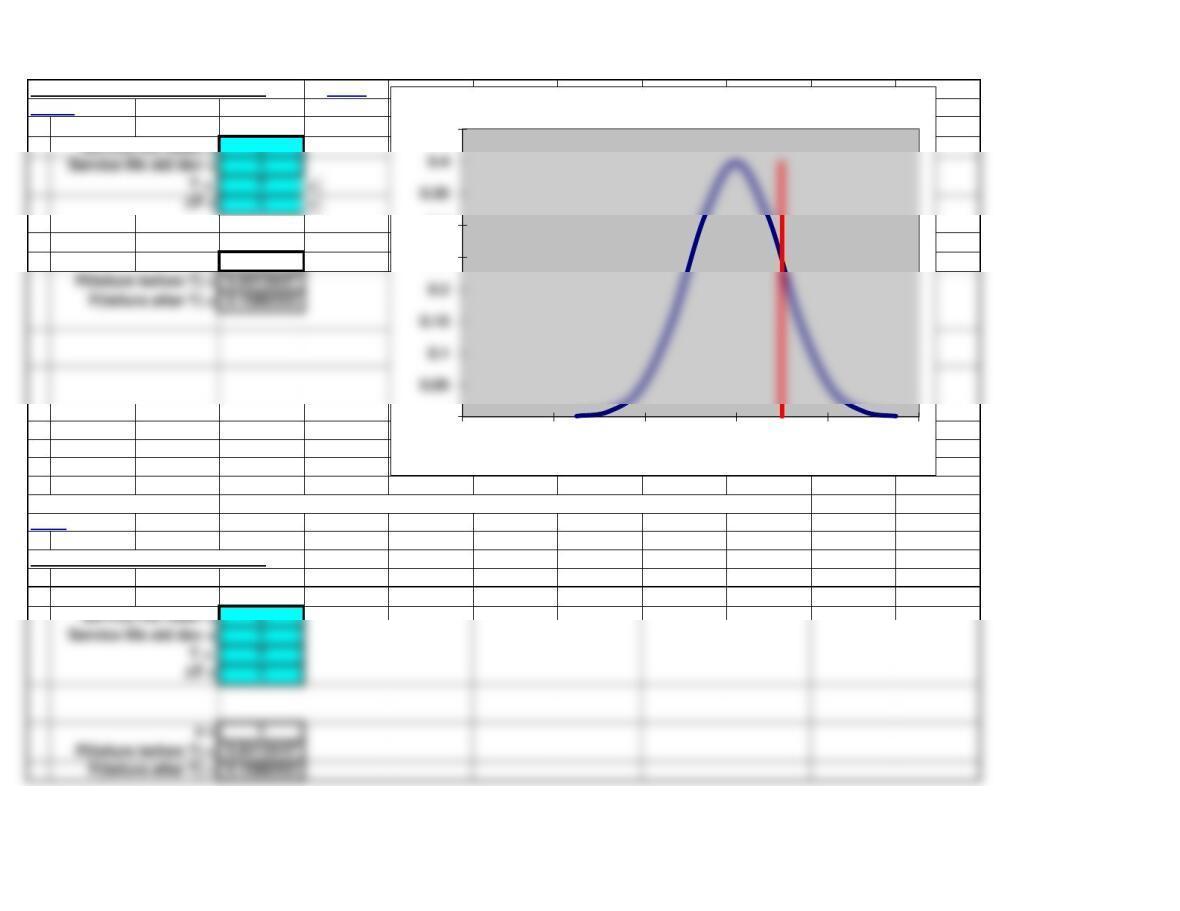
Service Life – Normal
Service Life – Normal Distribution Basic
<Back 2.5 0.0008727
3.2 0.0079155
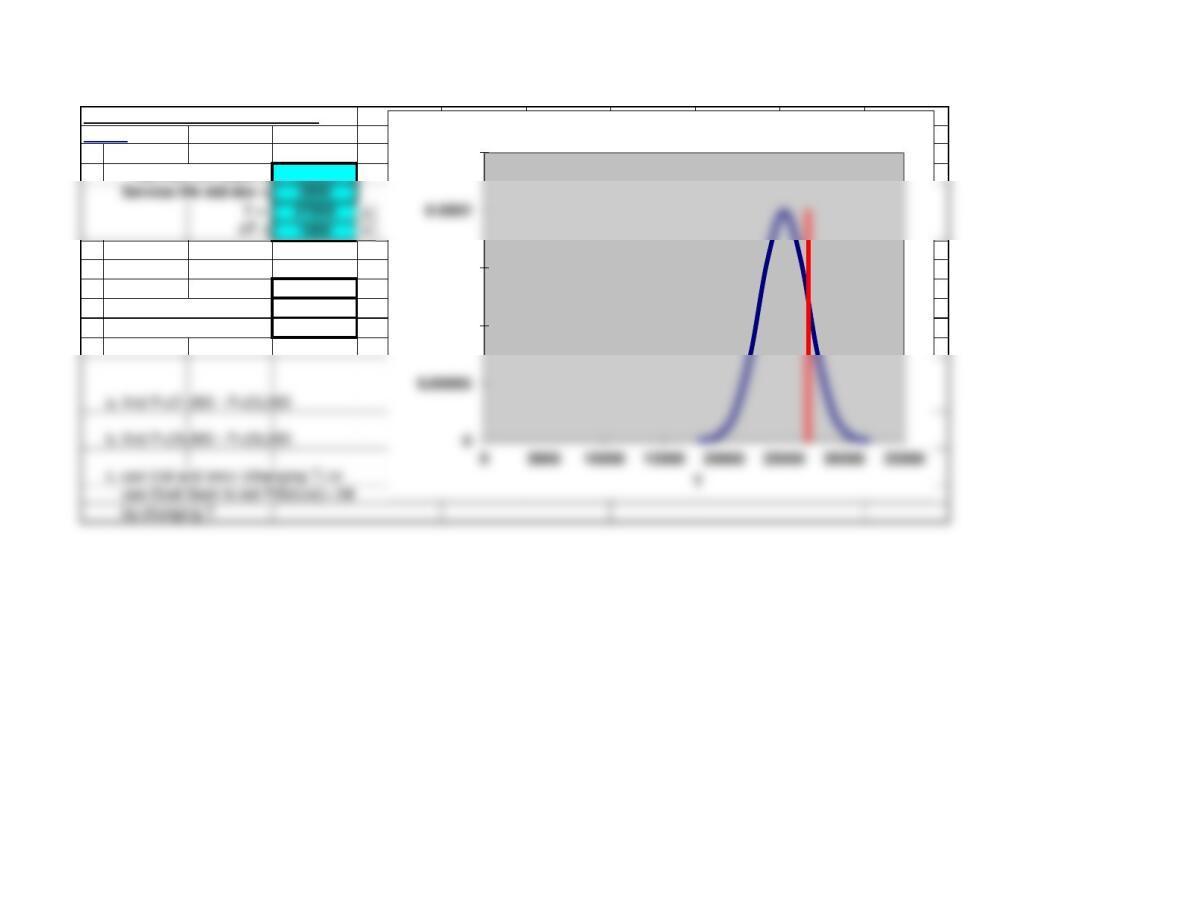
Service life mean = 6 3.9 0.0439836
6.7 0.3122539
7.4 0.1497275
z = 1 8.1 0.0439836
Basic template: You can simply copy the basic template below and paste into another worksheet.
^Top
Service Life – Normal Distribution
0
0.25
0.3
0.45
0246810
T
Normal Distribution
Page 4
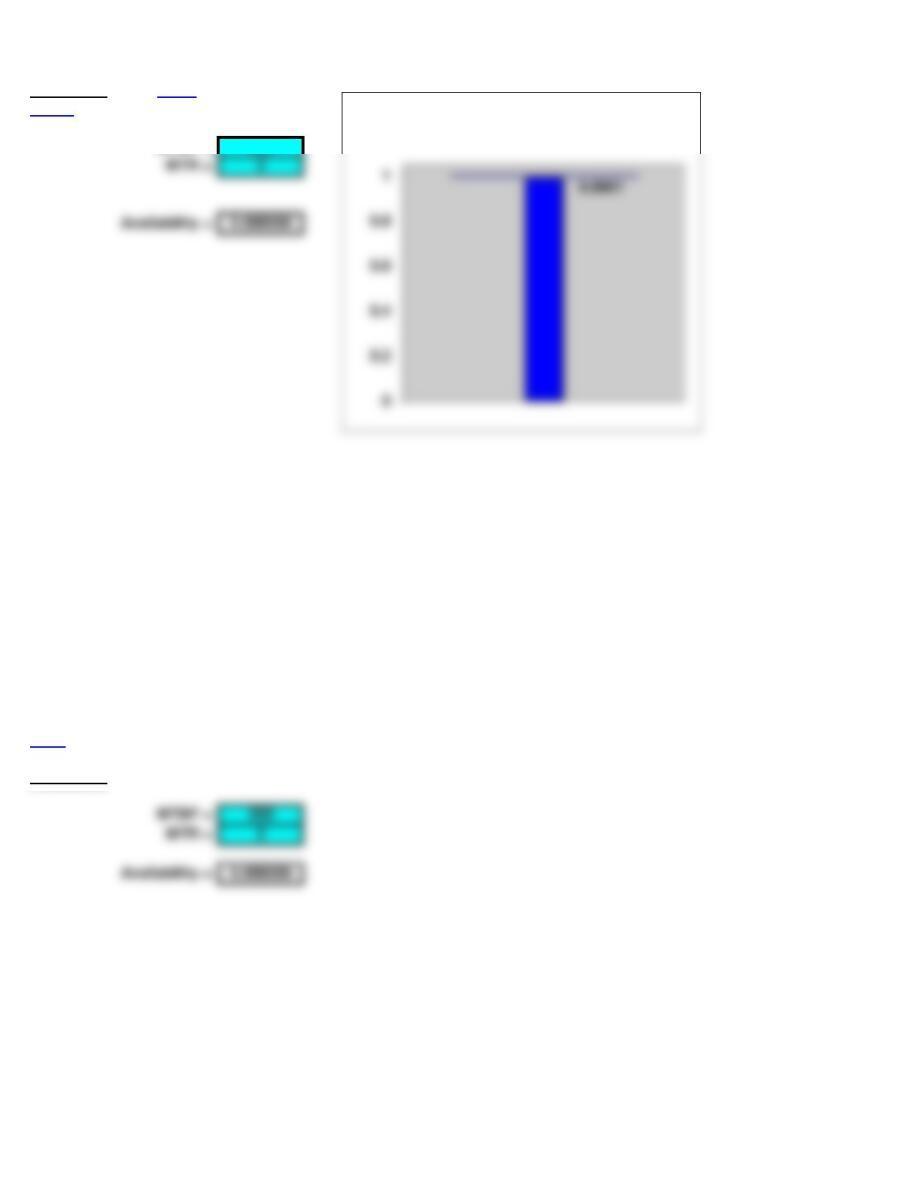
Availability Basic
<Back
MTBF = 200
Basic template: You can simply copy the basic template below and paste into another worksheet.
^Top
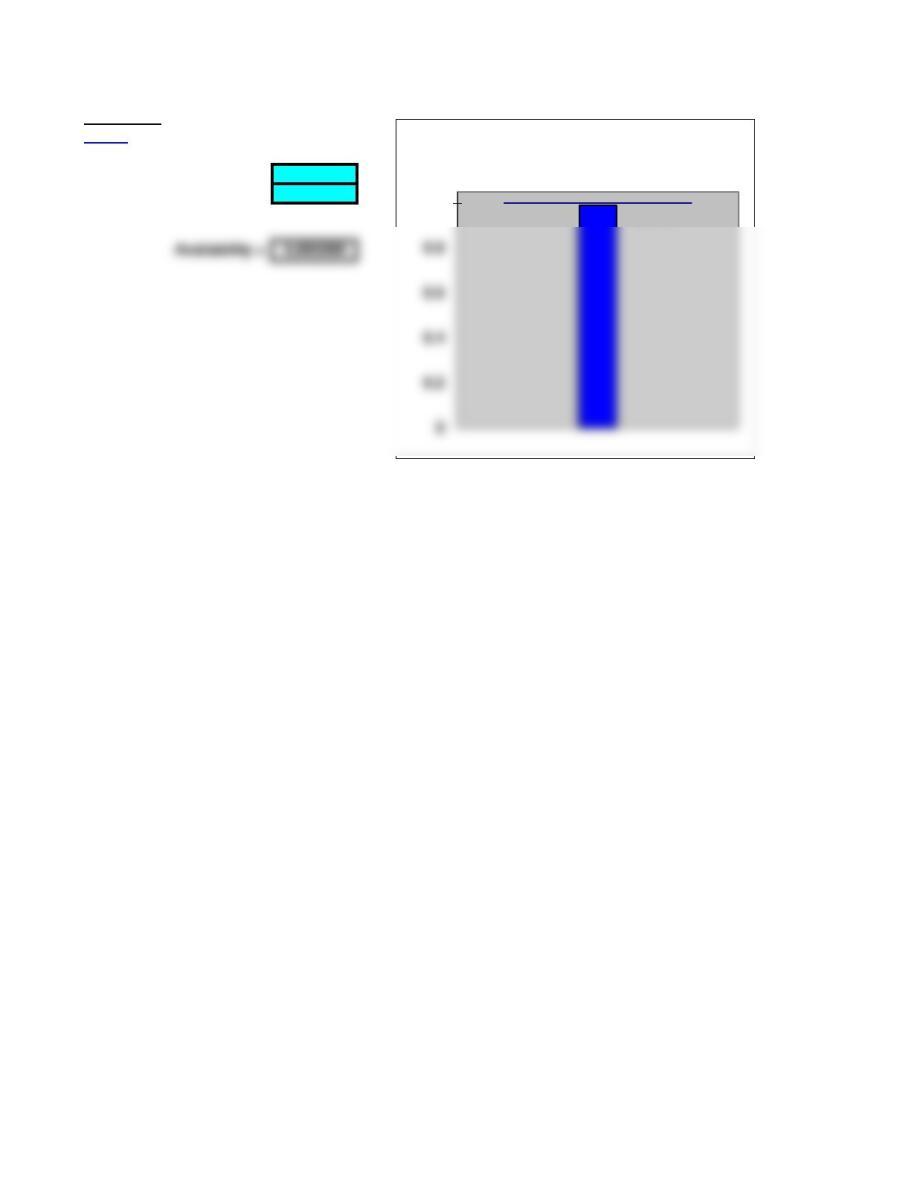
Availability
MTBF = 200
Availability
Lecture Suggestions – Supplement to Chapter 4
<Back
Example 3: Service Life – Normal Distribution
2. Enter data, service life mean = 6 years and standard deviation = 1 year (both given).
3. Parts a and b: you want to find P(failure before T) and P(failure after T) for T=7.
Specify the time T = 7
4. Part c: you want to find the value for T where P(failure before T) = .10.
Trail and error approach:
As you make the changes below, watch P(failure before T), you want it to be equal to .1
Reliability
<Back
0.9000 0.9200
Clear
Example 2
MTBF – Exponential Distribution
<Back 0.00000 0.25
Parameter = 0.25 2.40000 0.1372029
12.00000 0.0124468
14.40000 0.0068309
T / MTBF = 1 16.80000 0.0037489
0.2
0.25
Exponential Distribution
Page 8
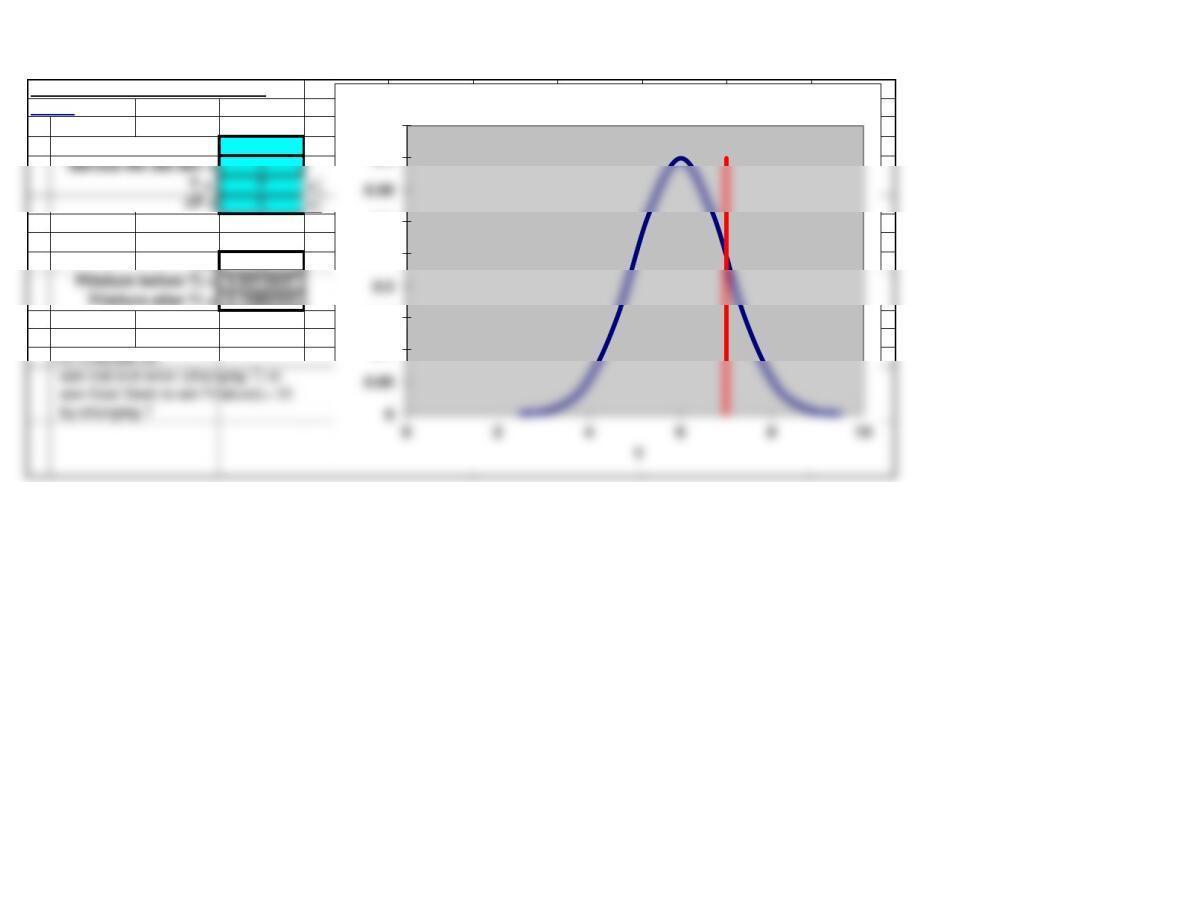
Example 3
Service Life – Normal Distribution
<Back 2.5 0.0008727
3.2 0.0079155
Service life mean = 6 3.9 0.0439836
6.7 0.3122539
7.4 0.1497275
z = 1 8.1 0.0439836
7 0
70.3989423
0.1
0.15
0.25
0.3
0.4
0.45
Normal Distribution
Page 9
Availability
<Back
MTBF = 200
MTR = 2
0.9901
1
Availability
Reliability
<Back
0.8000
0.9000
Clear
Solved Problem 4
MTBF – Exponential Distribution
<Back 0.00000 0.1
Parameter = 0.1 6.00000 0.0548812
MTBF = 10 12.00000 0.0301194
30.00000 0.0049787
36.00000 0.0027324
T / MTBF = 0.5 42.00000 0.0014996
5 0
50.1
0
0.02
0.04
0.08
0.1
0.00 20.00 40.00 60.00 80.00
T
Exponential Distribution
Page 12
Solved Problem 6
Service Life – Normal Distribution
<Back 18000 4.363E-07
19400 3.958E-06
Service life mean = 25000 20800 2.199E-05
26400 0.0001561
27800 7.486E-05
z = 1 29200 2.199E-05
P(failure before T) = 0.8413447 30600 3.958E-06
P(failure after T) = 0.1586553 32000 4.363E-07
27000 0
0.0001
0.00015
0.00025
Normal Distribution
Page 13