Da = 0.1 MSE = 11.80
Period Actual Forecast Error
119 #N/A
218 19 -1
315 18 -3
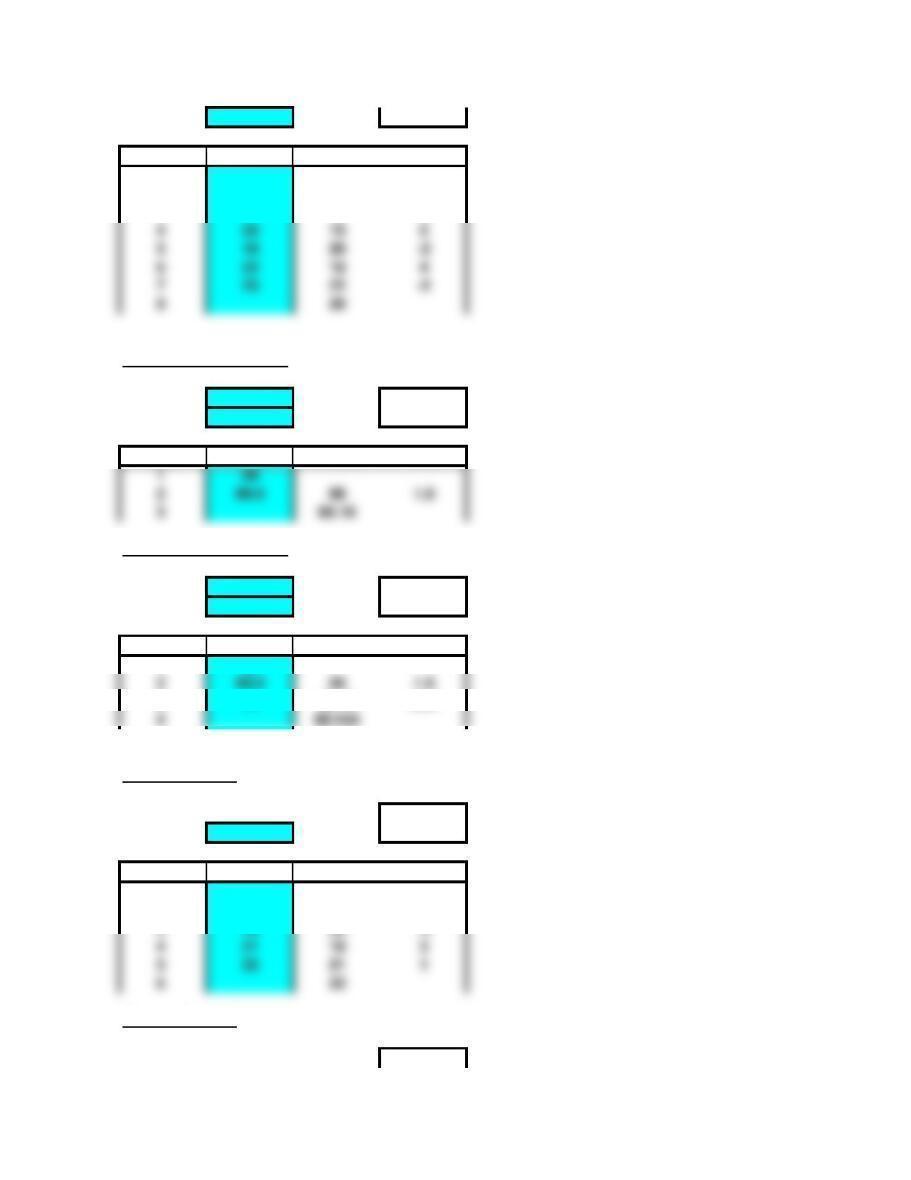
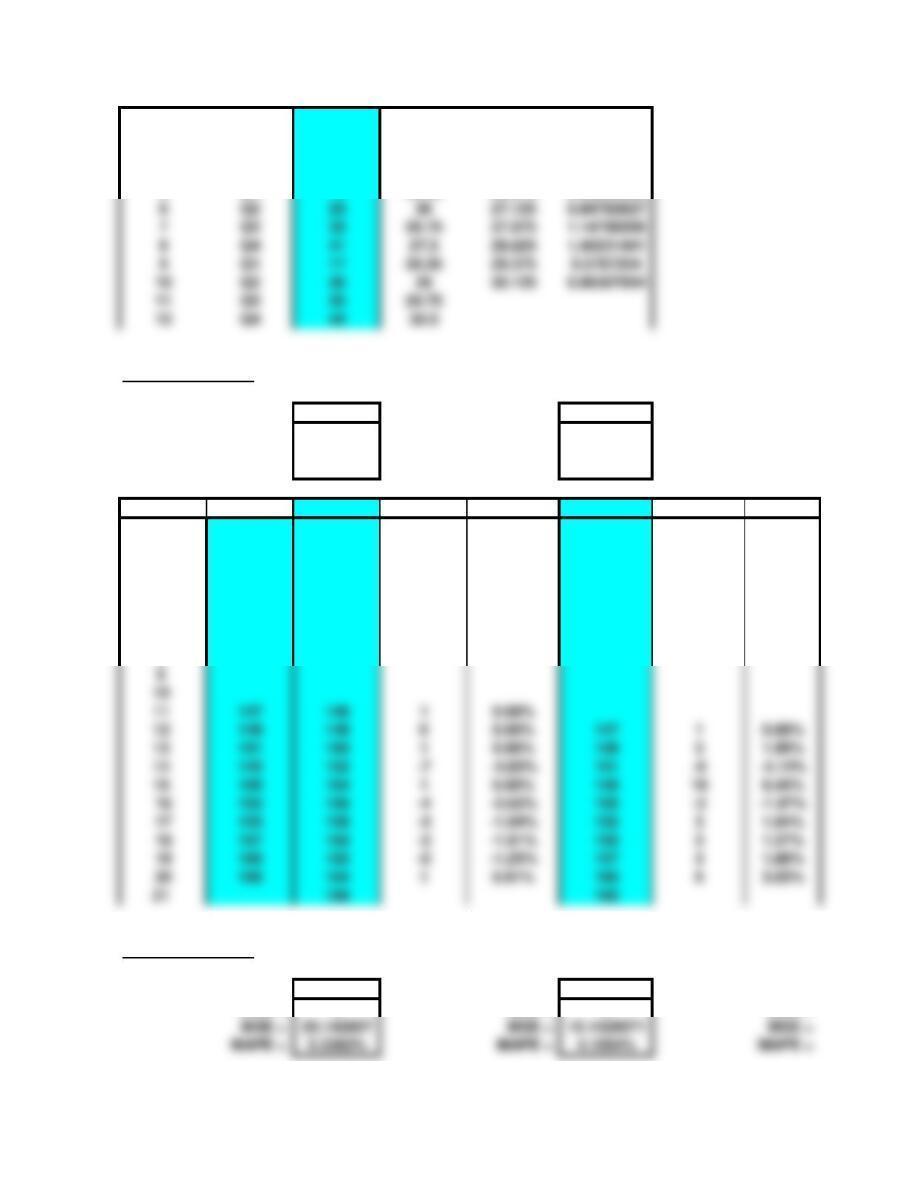
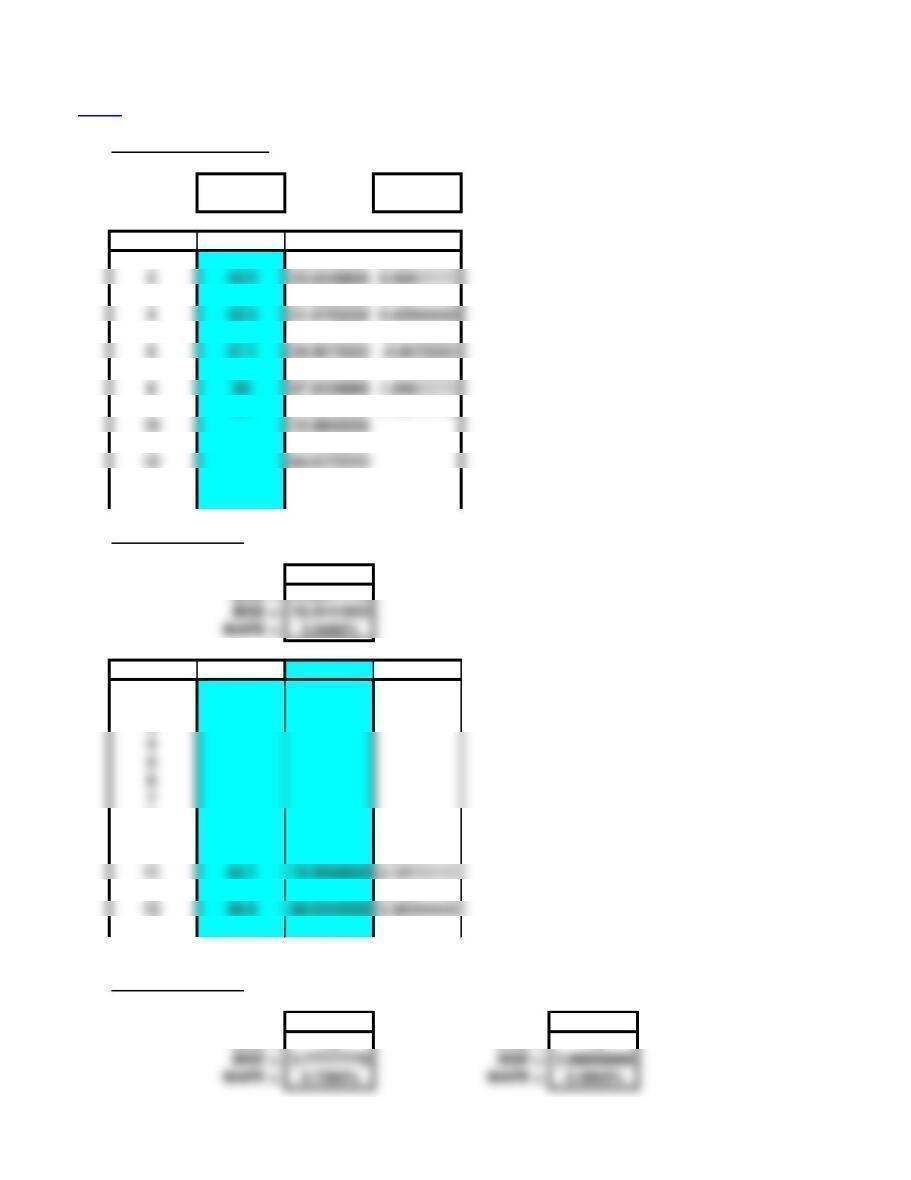
3. Exponential Smoothing
a = 0.1 MAD = 1.60
Da = 0.1 MSE =
Period Actual Forecast Error
188 #N/A
Exponential Smoothing
a = 0.1 MAD = 2.72
Da = 0.1 MSE = 17.31
Period Actual Forecast Error
188 #N/A
392 88.16 3.84
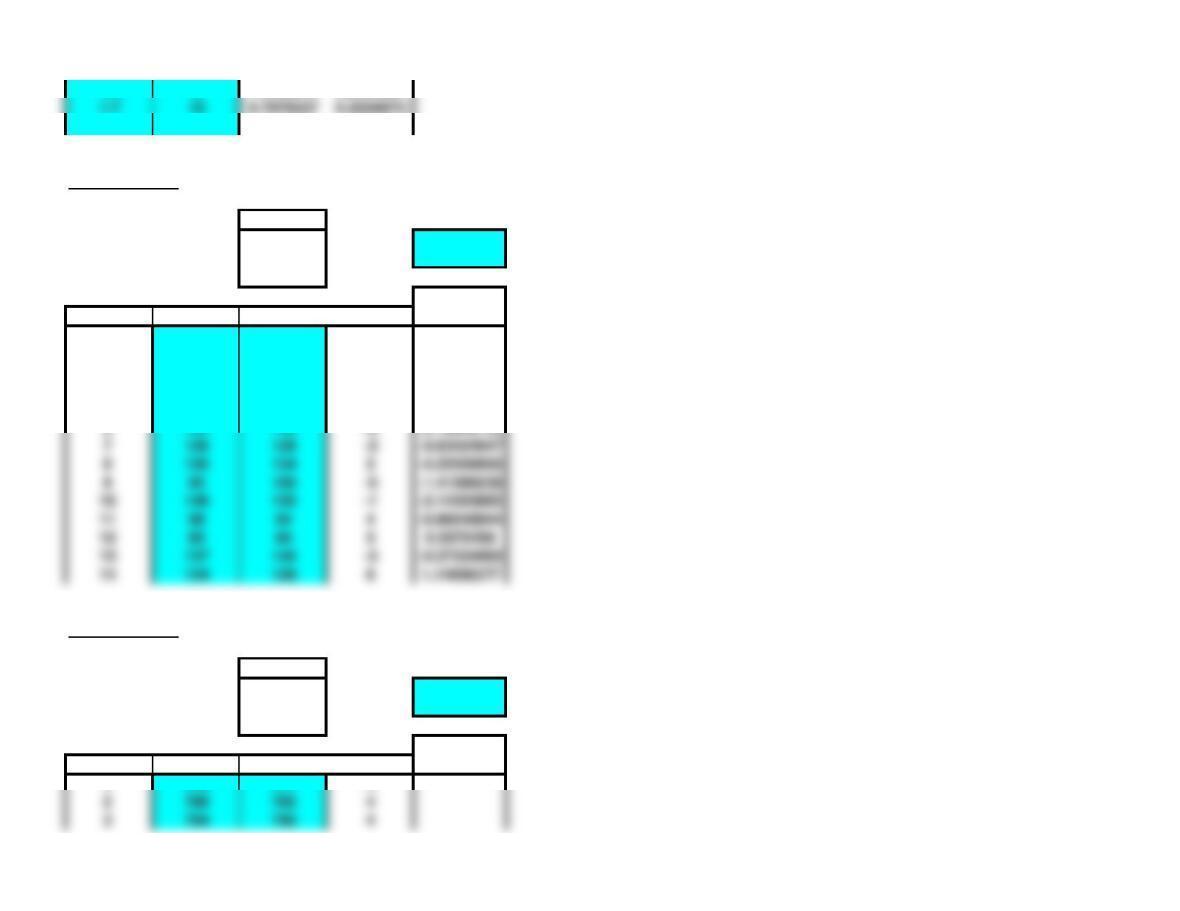
4.a. Moving Average (naive method)
MAD = 2.50
Periods = 1 MSE = 10.00
Period Actual Forecast Error
120 #N/A
222 20 2
318 22 -4
421 18 3
522 21 1
b. Moving Average
MAD = 1.75
420 15 5
518 20 -2
622 18 4
720 22 -2

Periods = 4 MSE =
Period Actual Forecast Error
120 #N/A
222 #N/A
c. Exponential Smoothing
a = 0.3 MAD = 1.90
Da = 0.1 MSE = 5.16
Period Actual Forecast Error
120 #N/A
222 20 2
318 20.6 -2.6
421 19.82 1.18
522 20.174 1.826
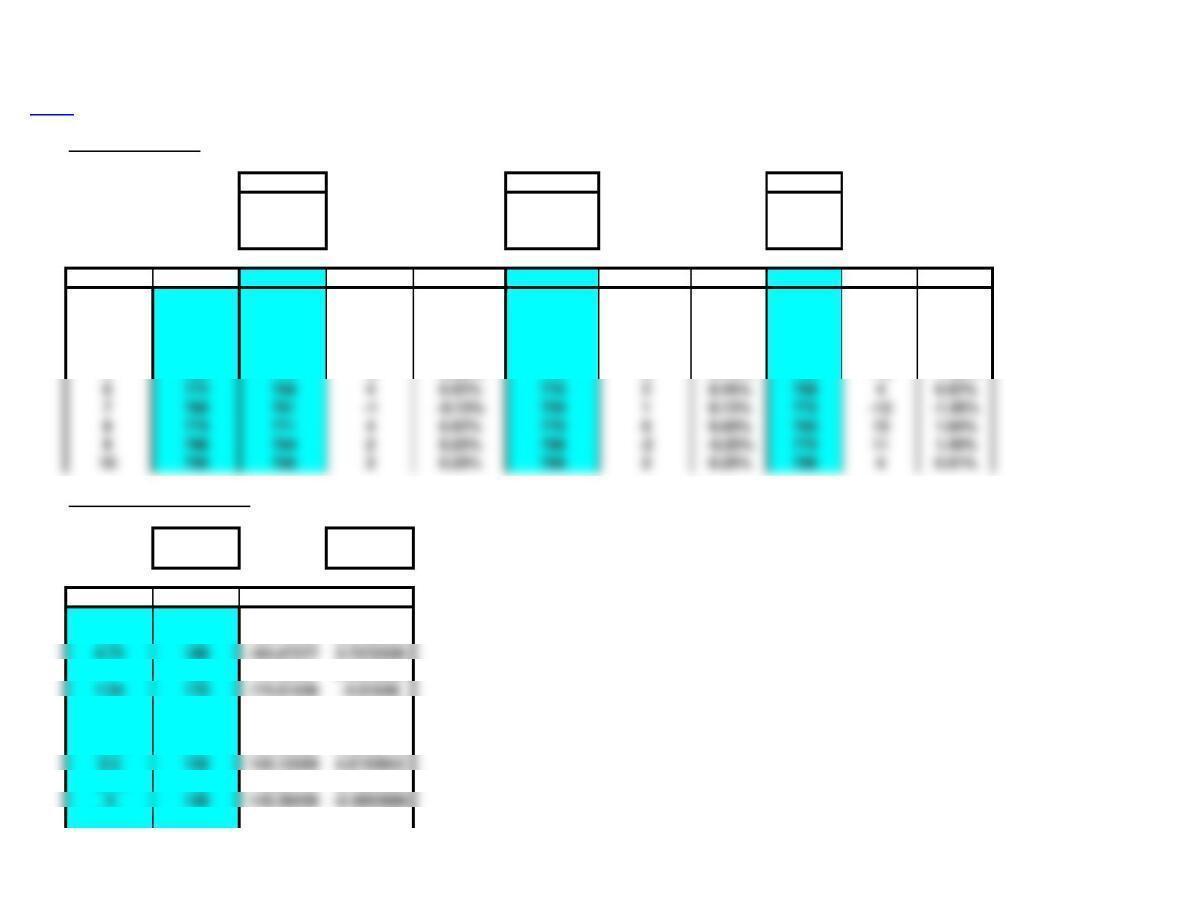
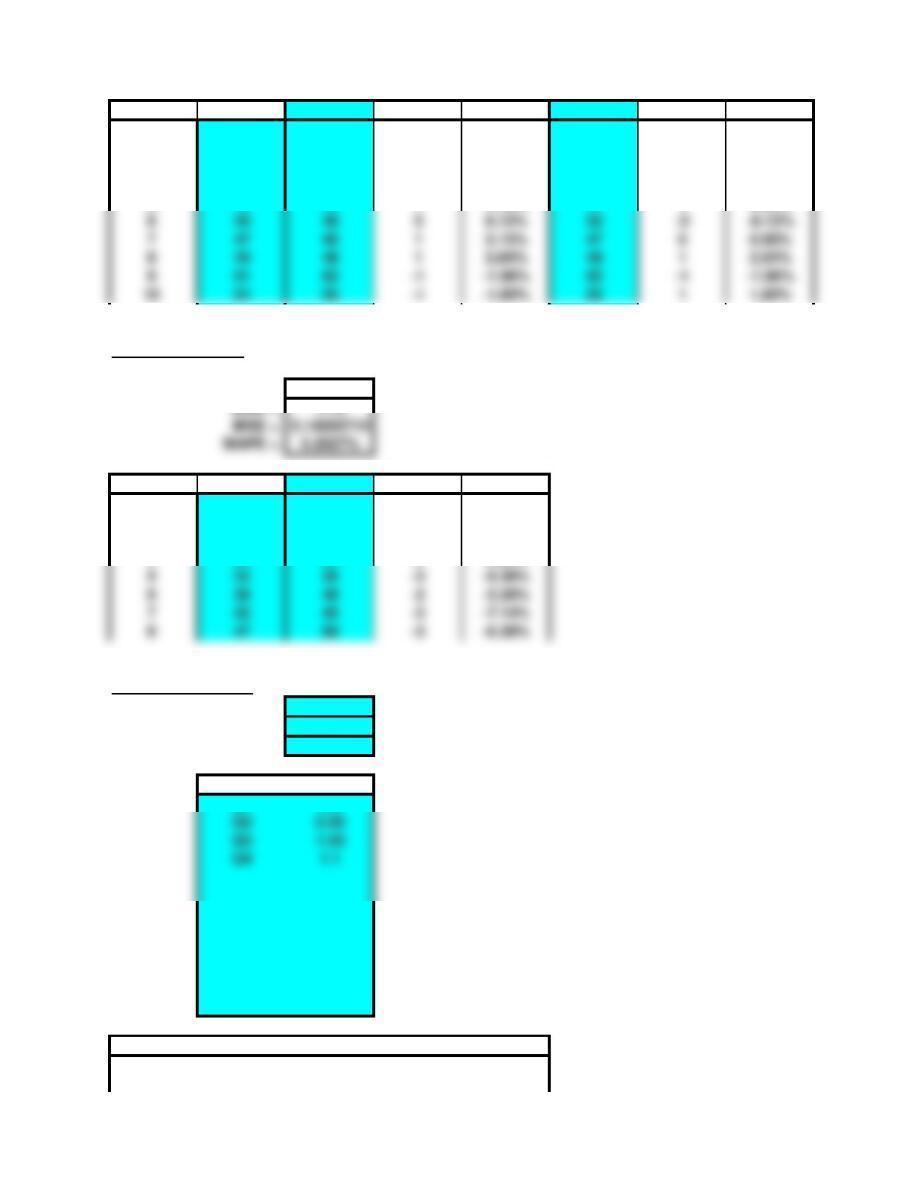
5. Trend and Seasonal
Slope = 15
Season Index
Period Season Trend
1 95
2 110
3 125
4 140
5 155
6 170
7 185
318 #N/A
421 #N/A
522 20.25 1.75

8 200
9 215
7. Linear Trend Equation
Slope = 18.9959 MAD = 7.94
Period Actual Forecast Error
1220 227.47953 -7.4795322
2245 246.4754 -1.4754042
3280 265.47128 14.528724
4275 284.46715 -9.4671483
5300 303.46302 -3.4630203
6310 322.45889 -12.458892
7350 341.45476 8.5452356
8360 360.45064 -0.4506364
9400 379.44651 20.553492
10 380 398.44238 -18.44238
11 420 417.43825 2.5617475
12 450 436.43412 13.565875
14 475 474.42587 0.5741314
15 500 493.42174 6.5782594
19 569.40523
20 588.4011
21 607.39697
22 626.39284
23 645.38872
24 664.38459
25 683.38046
26 702.37633
27 721.37221
28 740.36808
29 759.36395
30 778.35982
31 797.35569
32 816.35157

Chapter 3 – Problems 8-14 Note: This worksheet displays results only, you must copy the shaded
<Back area into the corresponding template to make additional calculations.
8.a. Linear Trend Equation
Slope = 7.0000 MAD = 4.90
Period Actual Forecast Error
1200 202.46667 -2.4666667
2214 209.46667 4.5333333
3211 216.46667 -5.4666667
4228 223.46667 4.5333333
5235 230.46667 4.5333333
6232 237.46667 -5.4666667
7248 244.46667 3.5333333
8250 251.46667 -1.4666667
9253 258.46667 -5.4666667
10 267 265.46667 1.5333333
11 281 272.46667 8.5333333
12 275 279.46667 -4.4666667
13 280 286.46667 -6.4666667
14 288 293.46667 -5.4666667
15 310 300.46667 9.5333333
b. Trend Adjusted Exponential Smoothing
Model Initialization:
Periods = 5
MAD = 6.09 b = 0.2
MSE = 52.52 Db = 0.1
Period Actual Forecast Error
1200 #N/A
2214 #N/A
3211 #N/A
4228 #N/A
5235 232 3
6232 240.9 -8.9
7248 246.41 1.59
8250 254.533 -4.533
9253 260.9145 -7.9145
10 267 266.00957 0.99043

12 275 282.66485 -7.6648501
13 280 287.8813 -7.8812959
9. Trend Adjusted Exponential Smoothing
Model Initialization:
Periods = 5
MAD = 2.45 b = 0.4
MSE = 10.60 Db = 0.1
Period Actual Forecast Error
1210 #N/A
2224 #N/A
3229 #N/A
4240 #N/A
5255 250 5
6265 262.5 2.5
7272 274.75 -2.75
8285 284.875 0.125
9294 295.8875 -1.8875
10. Trend and Seasonal
Slope = 5
Intercept = 70
Number of “seasons” = 12
Season Index
Jul
Aug
Sep
Oct
Nov
Dec
Apr
May
Period Season Trend Index Forecast
1 Jul 75 0 0
2 Aug 80 0 0
3 Sep 85 0 0
14 Aug 140 0 0
15 Sep 145 0 0
16 Oct 150 0 0
17 Nov 155 0 0
18 Dec 160 0 0
19 Jan 165 1.1 181.5
20 Feb 170 1.02 173.4
21 Mar 175 0.95 166.25
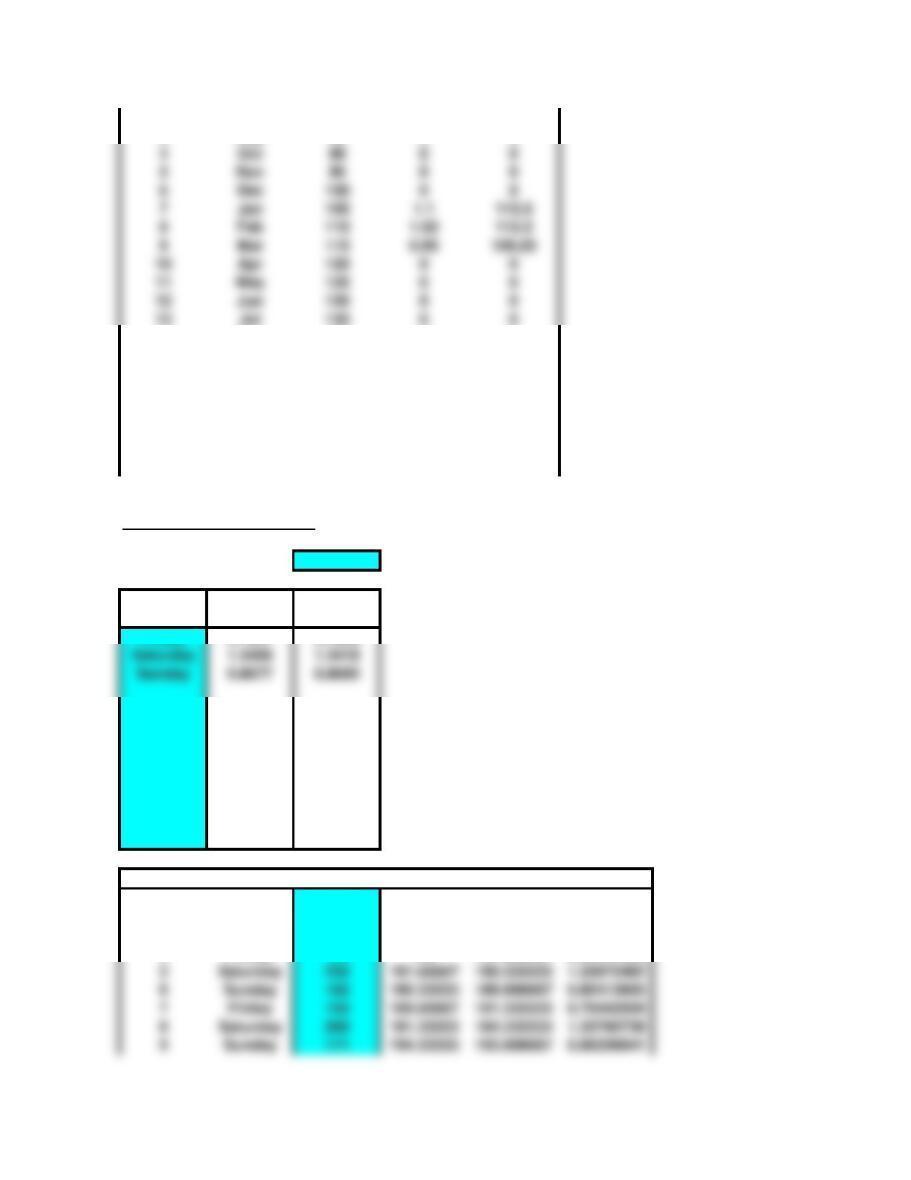
12a. Compute Seasonal Indexes
Number of “seasons” = 3
Season Average Standard
Index Index
Friday 0.7891 0.7898
Period Season Actual MA Center Index
1 Friday 149 #N/A #N/A
2 Saturday 250 #N/A 188.333333 1.32743363
3 Sunday 166 188.33333 190 0.87368421
4 Friday 154 190 191.666667 0.80347826
5 Saturday 255 191.66667 190.333333 1.33975482
6 Sunday 162 190.33333 189.666667 0.85413005
7 Friday 152 189.66667 191.333333 0.79442509
8 Saturday 260 191.33333 194.333333 1.33790738
9 Sunday 171 194.33333 193.666667 0.88296041
10 Apr 120 0 0
12 Jun 130 0 0
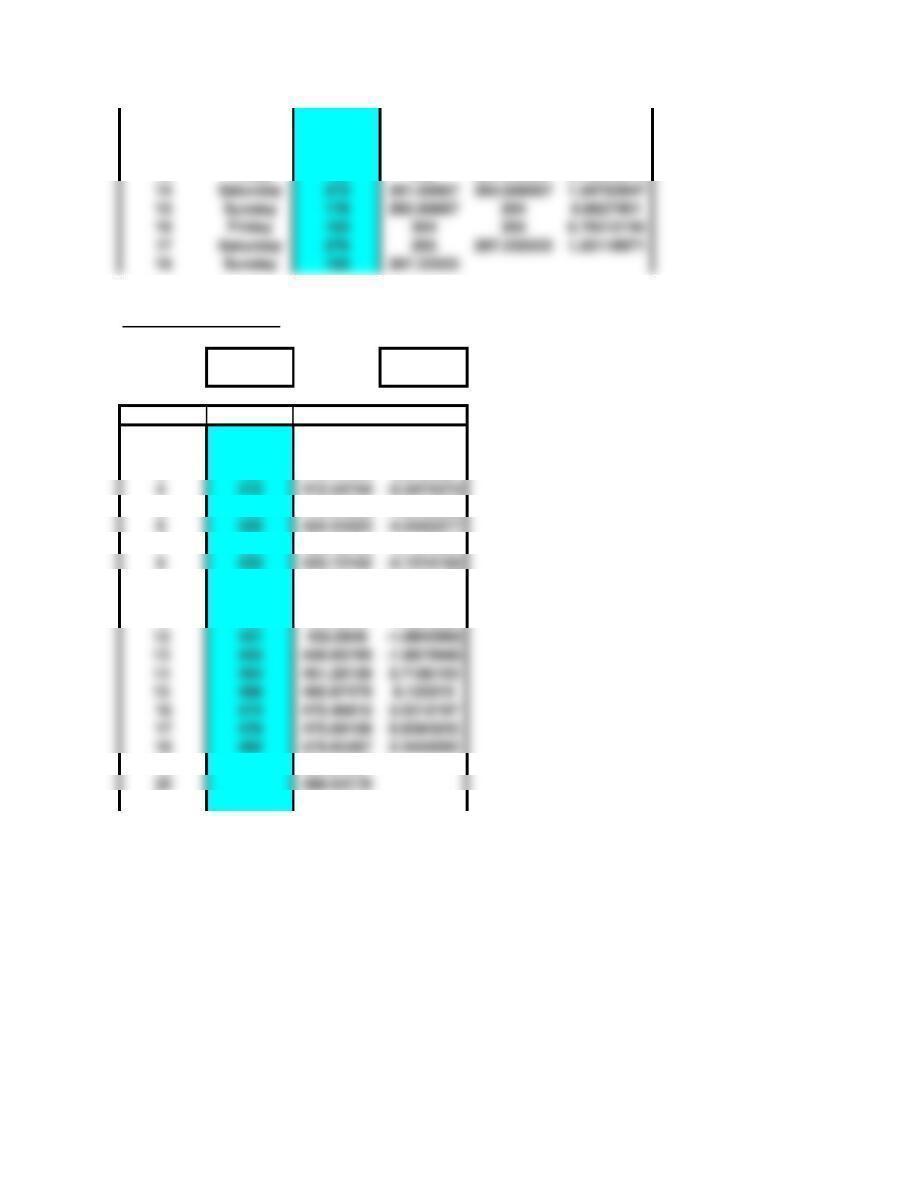
10 Friday 150 193.66667 196.333333 0.76400679
11 Saturday 268 196.33333 197 1.36040609
12 Sunday 173 197 200 0.865
13 Friday 159 200 201.666667 0.78842975
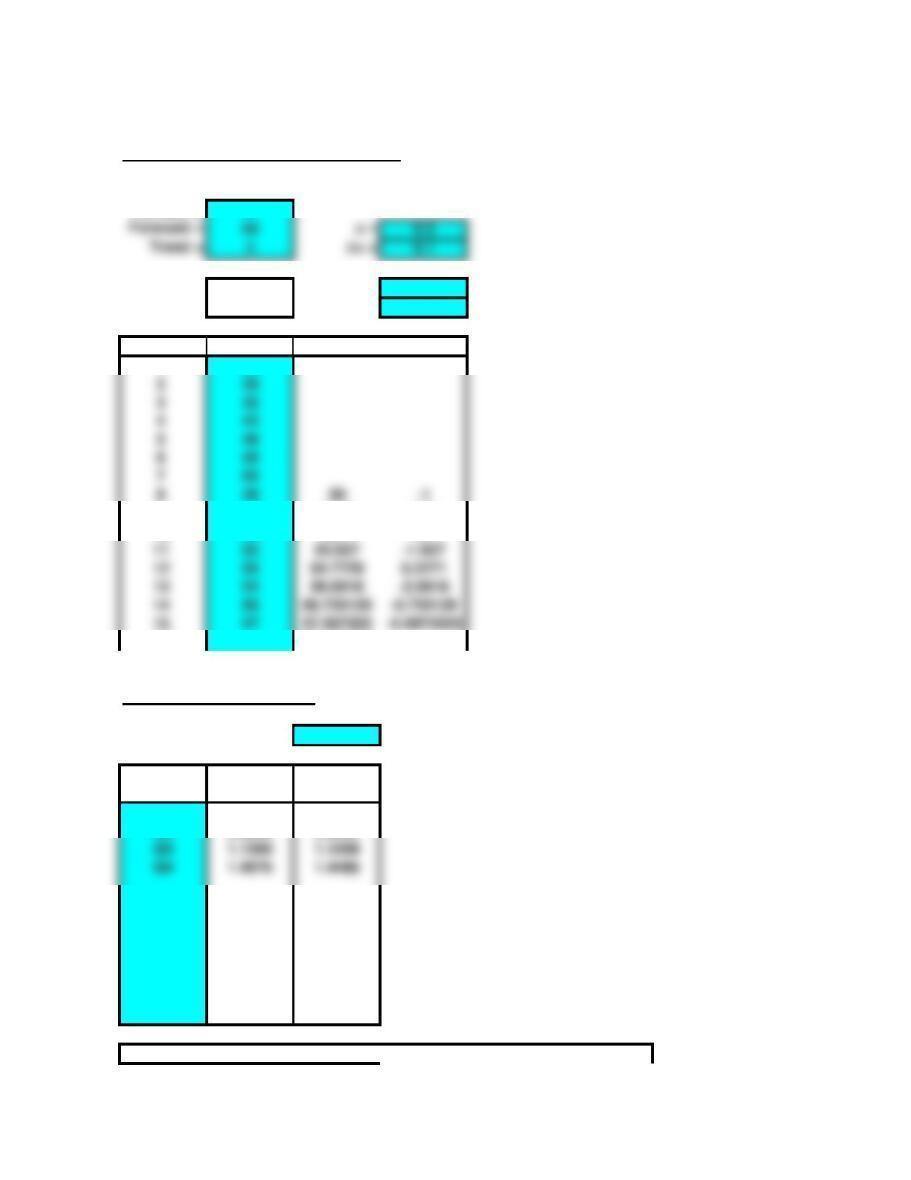
14. Linear Trend Equation
Slope = 4.5934 MAD = 2.91
Intercept = 396.97386 MSE = 15.51
Period Actual Forecast Error
1405 401.56725 3.4327485
2410 406.16065 3.8393533
3420 410.75404 9.245958
4415 415.34744 -0.3474372
5412 419.94083 -7.9408325
6420 424.53423 -4.5342277
7424 429.12762 -5.127623
8433 433.72102 -0.7210182
9438 438.31441 -0.3144135
10 440 442.90781 -2.9078087
11 446 447.5012 -1.501204
13 455 456.68799 -1.6879945
19 484.24837
20 488.84176
21 493.43516
14 Saturday 273 201.66667 202.666667 1.34703947
15 Sunday 176 202.66667 204 0.8627451
16 Friday 163 204 205 0.79512195
17 Saturday 276 205 207.333333 1.33118971
18 Sunday 183 207.33333 #N/A

Chapter 3 – Problems 15-21 Note: This worksheet displays results only, you must copy the shaded
<Back area into the corresponding template to make additional calculations.
15a. Compute Seasonal Indexes
Number of “seasons” = 7
Season Average Standard
Index Index
10.9012 0.9007
30.8840 0.8835
41.0230 1.0224
51.4260 1.4251
61.4820 1.4811
70.4496 0.4494
Period Season Actual MA Center Index
1 1 80 #N/A #N/A
2 2 75 #N/A #N/A
3 3 78 #N/A #N/A
4 4 95 #N/A 90.5714286 1.0488959
7 7 40 90.571429 91.4285714 0.4375
8 1 82 90.857143 91.2857143 0.89827856
9 2 77 91.142857 91.4285714 0.8421875
10 380 91.428571 91.5714286 0.87363495
11 494 91.285714 91.8571429 1.02332815
12 5131 91.428571 92.1428571 1.42170543
13 6137 91.571429 92.2857143 1.48452012
14 742 91.857143 92.7142857 0.45300462
15 184 92.142857 93 0.90322581
16 278 92.285714 93.5714286 0.83358779
17 383 92.714286 94 0.88297872
18 496 93 94.2857143 1.01818182
19 5135 93.571429 94.7142857 1.42533937
20 6140 94 95.2857143 1.46926537
21 744 94.285714 96 0.45833333
22 187 94.714286 96.4285714 0.90222222
23 282 95.285714 97.7142857 0.83918129
24 388 96 98.2857143 0.89534884
25 499 96.428571 98.8571429 1.00144509
26 5144 97.714286 #N/A
27 6144 98.285714 #N/A
28 748 98.857143 #N/A
20.8383 0.8378
16. Trend Adjusted Exponential Smoothing
Model Initialization:
Periods = 8
MAD = 1.57 b = 0.3
MSE = 6.09 Db = 0.1
Period Actual Forecast Error
136 #N/A
238 #N/A
342 #N/A
444 #N/A
548 #N/A
649 #N/A
750 #N/A
849 50 -1
952 51.7 0.3
10 48 53.7 -5.7
16 58.434752
19. Compute Seasonal Indexes
Number of “seasons” = 4
Season Average Standard
Index Index
Q1 0.5548 0.5513
Q2 0.8555 0.8502
Q3 1.1569 1.1498
Q4 1.4576 1.4486
Period Season Actual MA Center Index
1Q1 11 #N/A #N/A
2Q2 20 #N/A #N/A
3Q3 29 #N/A 24.875 1.16582915
4Q4 38 24.5 25.625 1.48292683
5Q1 14 25.25 26.375 0.53080569
20. Forecast Accuracy
Lin Trend Naive
MAD = 2.3 MAD = 4
MSE = 10.111111 MSE = 25.25
MAPE = 1.5149% MAPE = 2.5934%
Period Actual Lin Trend Error % Error Naive Error % Error
1
2
3
4
5
6
7
8
9
21. Forecast Accuracy
F1 F2
MAD = 4 MAD = 3 MAD =
MSE = 25.142857 MSE = 15.1428571 MSE =
6Q2 23 26 27.125 0.84792627
7Q3 32 26.75 27.875 1.14798206
8Q4 41 27.5 28.625 1.43231441
9Q1 17 28.25 29.375 0.5787234
Period Actual F1 Error % Error F2 Error % Error
168 66 22.94% 66 22.94%
275 68 79.33% 68 79.33%
370 72 -2 -2.86% 70 00.00%
474 71 34.05% 72 22.70%
569 72 -3 -4.35% 74 -5 -7.25%
672 70 22.78% 76 -4 -5.56%
780 71 911.25% 78 22.50%
878 74 45.13% 80 -2 -2.56%
Chapter 3 – Problems 22-29 Note: This worksheet displays results only, you must copy the shaded
<Back area into the corresponding template to make additional calculations.
22. Forecast Accuracy
Forecast 1 Forecast 2 Naive
MAD = 2.8 MAD = 3.6 MAD = 10.66667
MSE = 10.444444 MSE = 42.4444444 MSE = 156
MAPE = 0.3587% MAPE = 0.4622% MAPE = 1.3704%
Period Actual Forecast 1 Error % Error Forecast 2 Error % Error Naive Error % Error
1770 771 -1 -0.13% 769 10.13%
2789 785 40.51% 787 20.25% 770 19 2.41%
3794 790 40.50% 792 20.25% 789 50.63%
4780 784 -4 -0.51% 798 -18 -2.31% 794 -14 -1.79%
5768 770 -2 -0.26% 774 -6 -0.78% 780 -12 -1.56%
25. Simple Linear Regression
Slope = -19.5126 r = -0.9848957
Intercept = 315.9829
r2 = 0.9700196
x y Forecast Error
6200 198.90723 1.0927747
6.5 190 189.15092 0.8490808
6.75 188 184.27277 3.7272339
7180 179.39461 0.6053869
7.5 162 169.63831 -7.638307
8160 159.882 0.1179991
8.25 155 155.00385 -0.0038478
8.5 156 150.12569 5.8743053
8.75 148 145.24754 2.7524583
9140 140.36939 –0.3693886
9.25 133 135.49124 -2.4912356
6772 768 40.52% 770 20.26% 768 40.52%
7760 761 -1 -0.13% 759 10.13% 772 -12 -1.58%
8775 771 40.52% 775 00.00% 760 15 1.94%
9786 784 20.25% 788 -2 -0.25% 775 11 1.40%

26. Simple Linear Regression
Slope = 0.5838 r = 0.8690932
Intercept = 66.333333
r2 = 0.7553229
x y Forecast Error
15 74 75.090164 -1.0901639
25 80 80.928051 -0.928051
40 84 89.684882 -5.6848816
32 81 85.014572 -4.0145719
51 96 96.106557 -0.1065574
47 95 93.771403 1.2285974
27. Simple Linear Regression
Slope = 6.1580 r = 0.959241
Intercept = -0.6716621
r2 = 0.9201432
x y Forecast Error
1.6 10 9.1811989 0.8188011
1.3 87.3337875 0.6662125
1.8 11 10.412807 0.5871935
212 11.644414 0.3555858
1.6 99.1811989 -0.1811989
1.5 88.5653951 -0.5653951
1.3 77.3337875 -0.3337875
1.7 10 9.7970027 0.2029973
1.2 66.7179837 -0.7179837
30 83 83.846995 -0.8469945
14 70 74.506375 -4.5063752
15 72 75.090164 -3.0901639
22 85 79.176685 5.8233151
24 88 80.344262 7.6557377
33 90 85.598361 4.4016393
1.4 87.9495913 0.0504087
1.6 99.1811989 -0.1811989
28. Tracking Signal
Forecast
MAD = 4.3571429 Initial = 5
MSE = 24.230769 a = 0.3
MAPE = 3.70%
Tracking
Period Actual Forecast Error Signal
1129 124 5#N/A
2194 200 -6 #N/A
3156 150 6#N/A
491 94 -3 #N/A
585 80 51.4
6132 140 -8 -0.16949153
7126 128 -2 -0.63424947
8126 124 2 -0.25568908
995 100 -5 -1.41586238
29. Tracking Signal
Forecast
MAD = 2.8 Initial = 10
MSE = 10.444444 a =
MAPE = 0.36%
Tracking
Period Actual Forecast Error Signal
1770 771 -1
2789 785 4
3794 790 4

MAD = 3.6 Initial = 10
MSE = 42.444444 a =
MAPE = 0.46%
Tracking
Period Actual Forecast Error Signal
1770 769 1
2789 787 2
3794 792 2
4780 798 -18
5768 774 -6
6772 770 2
7760 759 1
8775 775 0
9786 788 -2
Tracking Signal
Forecast
MAD = 10.666667 Initial = 10
MSE = 156 a =
MAPE = 1.37%
Tracking
Period Actual Forecast Error Signal
1770 #N/A
2789 770 19
3794 789 5
4780 794 -14
5768 780 -12
4780 784 -4
5768 770 -2
6772 768 4
7760 761 -1
8775 771 4
9786 784 2
Tracking Signal

6772 768 4
7760 772 -12
8775 760 15
9786 775 11
Chapter 3 – Problems 31-34 Note: This worksheet displays results only, you must copy the shaded
<Back area into the corresponding template to make additional calculations.
31. Linear Trend Equation
Slope = 4.0183 MAD = 0.98
Intercept = 35.7972222 MSE = 1.89
Period Actual Forecast Error
140.2 39.8155556 0.38444444
348 47.8522222 0.14777778
452.3 51.8705556 0.42944444
555.8 55.8888889 -0.0888889
657.1 59.9072222 -2.8072222
762.4 63.9255556 -1.5255556
869 67.9438889 1.05611111
973.7 71.9622222 1.73777778
10 75.9805556
11 79.9988889
12 84.0172222
13 88.0355556
14 92.0538889
Forecast Accuracy
Forecast 1
MAD = 3.30277778
Period Actual Forecast 1 Error
1
2
3
4
5
6
7
8
9
10 77.2 75.9805556 1.21944444
11 82.1 79.9988889 2.10111111
12 87.8 84.0172222 3.78277778
13 90.6 88.0355556 2.56444444
14 98.9 92.0538889 6.84611111
32. Forecast Accuracy
Alt. 1 Alt. 2
MAD = 1.6 MAD = 1.5
244.5 43.8338889 0.66611111
Period Actual Alt. 1 Error % Error Alt. 2 Error % Error
137 36 12.70% 36 12.70%
239 38 12.56% 37 25.13%
337 40 -3 -8.11% 38 -1 -2.70%
439 42 -3 -7.69% 38 12.56%
545 46 -1 -2.22% 41 48.89%
33. Forecast Accuracy
Forecast 1
MAD = 1.75
Period Actual Forecast 1 Error % Error
115 15 00.00%
221 20 14.76%
323 25 -2 -8.70%
430 30 00.00%
532 35 -3 -9.38%
638 40 -2 -5.26%
742 45 -3 -7.14%
847 50 -3 -6.38%
34. Trend and Seasonal
Slope = 5
Intercept = 10
Number of “seasons” = 4
Season Index
Q1 0.9
Period Season Trend Index Forecast
1Q1 15 0.9 13.5
2Q2 20 0.95 19
649 46 36.12% 52 -3 -6.12%
747 46 12.13% 47 00.00%
849 48 12.04% 48 12.04%
951 52 -1 -1.96% 52 -1 -1.96%

3Q3 25 1.05 26.25
4Q4 30 1.1 33
Tracking Signal
Forecast
MAD = 2.33333333 Initial = 2
MSE = 10.609375 a = 0.4
MAPE = 6.44%
Tracking
Period Actual Forecast Error Signal
114 13.5 0.5 #N/A
220 19 1 2
324 26.25 -2.25 -0.5555556
431 33 -2 -1.7080745
531 31.5 –0.5 -2.787307
637 38 -1 -3.8650418
743 47.25 -4.25 -3.6020612
848 55 -7 -3.6765962
952 49.5 2.5 -3.6832271
5Q1 35 0.9 31.5
6Q2 40 0.95 38
7Q3 45 1.05 47.25
8Q4 50 1.1 55
9Q1 55 0.9 49.5