Case 14 Teaching Note Netflix’s Strategy in 2018
451
Ability to spend suffcient amounts on marketing and advertising to attract and retain a subscriber/
user base that is large enough to be profitable. In order for a movie rental competitor to be profitable,
5. What is Netflix’s strategy in 2018? Which of the five generic competitive strategies discussed
in Chapter 5 most closely fit the competitive approach that Netflix is taking? What type of
competitive advantage is Netflix trying to achieve?
In 2018, Netix had a multipronged strategy to build an ever-growing subscriber base that included:
Aggressively grow its base of subscribers in all countries where it has a presence, but most especially
in those countries it has recently entered. To spur subscriber growth, Netix had boosted marketing
expenditures of all kinds from $25.7 million in 2000 (16.8 percent of revenues) to $142.0 million in
Case 14 Teaching Note Netflix’s Strategy in 2018
452
Use 30-day free trials to help attract new subscribers.
Students should be aware that Netix has made a point of being a first-mover in expanding its geographic
coverage to include close to 100% of the countries in the world where it can do business. Having
established its presence in these countries as of 2018, the strategic priority now is to rapidly grow its
Advertising campaigns of one type or another were underway more or less continuously, with the lure of
1-month free trials usually being the prominent ad feature. Advertising expenses totaled approximately
$205.9 million in 2009, $181.4 million in 2008 and $207.9 million in 2007—ad expenses for 2011 and
2010 were not publicly reported.
Management had boosted marketing expenditures of all kinds (including paid advertising) from $25.7
million in 2000 (16.8 percent of revenues) to $142.0 million in 2005 (20.8 percent of revenues) to
Case 14 Teaching Note Netflix’s Strategy in 2018
453
Which of the Five Generic Strategies Is Netflix Employing? There is some room for students to have
different opinions as to which of the five generic competitive strategies that Netix is using, with a portion of
the class asserting that Netix is pursuing a broad differentiation strategy and others arguing that it is using
a focused differentiation strategy. , and perhaps still others arguing that Netix is quickly transitioning to a
best-cost provider strategy (because Internet/digital delivery of rented movies is far cheaper and faster the
mail delivery). The case states that Netix’s subscriber base consisted of three types of customers: (1) those
Netix’s Efforts to Build Competitive Advantage. Most class members will (or should) recognize that
Netix’s strategy is aimed at building a competitive advantage based on the combined impact of five
strategy elements:
A wide and diverse content library, with a rapidly growing number of original content programs/titles.
ls
Unlimited instant streaming of titles at an attractively low monthly price. The monthly price for unlimited
streaming was a bargain for subscribers who were frequent watchers of titles in Netix’s content library.
6. What does a SWOT analysis of Netflix reveal about the overall attractiveness of its situation?
Netflix’s Resource Strengths and Competitive Assets
Netix has capitalized on having been the first-mover in expanding its market presence to virtually all
of the world’s countries where it was permitted to do business. As a consequence, it was the world’s
biggest and best known provider of streamed content to individuals/households willing to pay a modest
monthly fee for its service.
Case 14 Teaching Note Netflix’s Strategy in 2018
454
•A large, diverse content library, with a rapidly-growing number of original content titles (many,
with multi-season episodes)
• The ability to stream movies to subscribers via a variety of Netix-ready devices, including Netix-
capable Blu-ray players, increasing numbers of Internet-connected TV models and home theater
Netflix’s Resource Weaknesses and Competitive Liabilities
Netix’s service is not appealing to individuals/households who are content to watch regularly-scheduled
network programming and whatever cable programs are available (if they are cable subscribers) or who
Netflix’s External Market Opportunities
Growing its subscriber base in recently-entered countries/geographic areas.
External Threats to Netflix’s Future Profitability
Growing bargaining power on the part of content providers of all types to extract higher fees from
Netix in return for granting Netix the rights to stream their content.
Case 14 Teaching Note Netflix’s Strategy in 2018
455
The entry of more streaming competitors, especially those that have the name recognition, brand power,
and resources to draw subscribers away from Netix (or to lower Netix’s subscriber growth rates in a
You should not miss the opportunity to take the SWOT list to a higher analytical plateau by getting the class to
identify which of Netix’s resource strengths qualify as core competencies and/or distinctive competencies.
A good case can be made that Netix’s proprietary recommendation software qualifies as a distinctive
competence—one that provides competitive advantage currently and has potential for delivering
Conclusions concerning Netix’s situation. You should not let students escape with just compiling four
SWOT lists. The really important part of SWOT analysis comes from drawing conclusions about what we
learn from the four SWOT lists.
7. What is your appraisal of Netflix’s operating and financial performance based on the data
in case Exhibits 1, 2, 5, 6, and 7? What positives and negatives do you see in Netflix’s
performance? Use the financial ratios in Table 4.1 of Chapter 4 as a guide in doing the
calculations needed to arrive at an analysis-based answer to your assessment of Netflix’s
recent financial performance.
Class members need to be pushed to do some number-crunching and diagnosis of the numbers presented in
the case exhibits. The following seem pertinent in evaluating Netix’s performance:
From 2005 through 2017, revenues grew from $682.2 million to $11.7 billion—a compound average
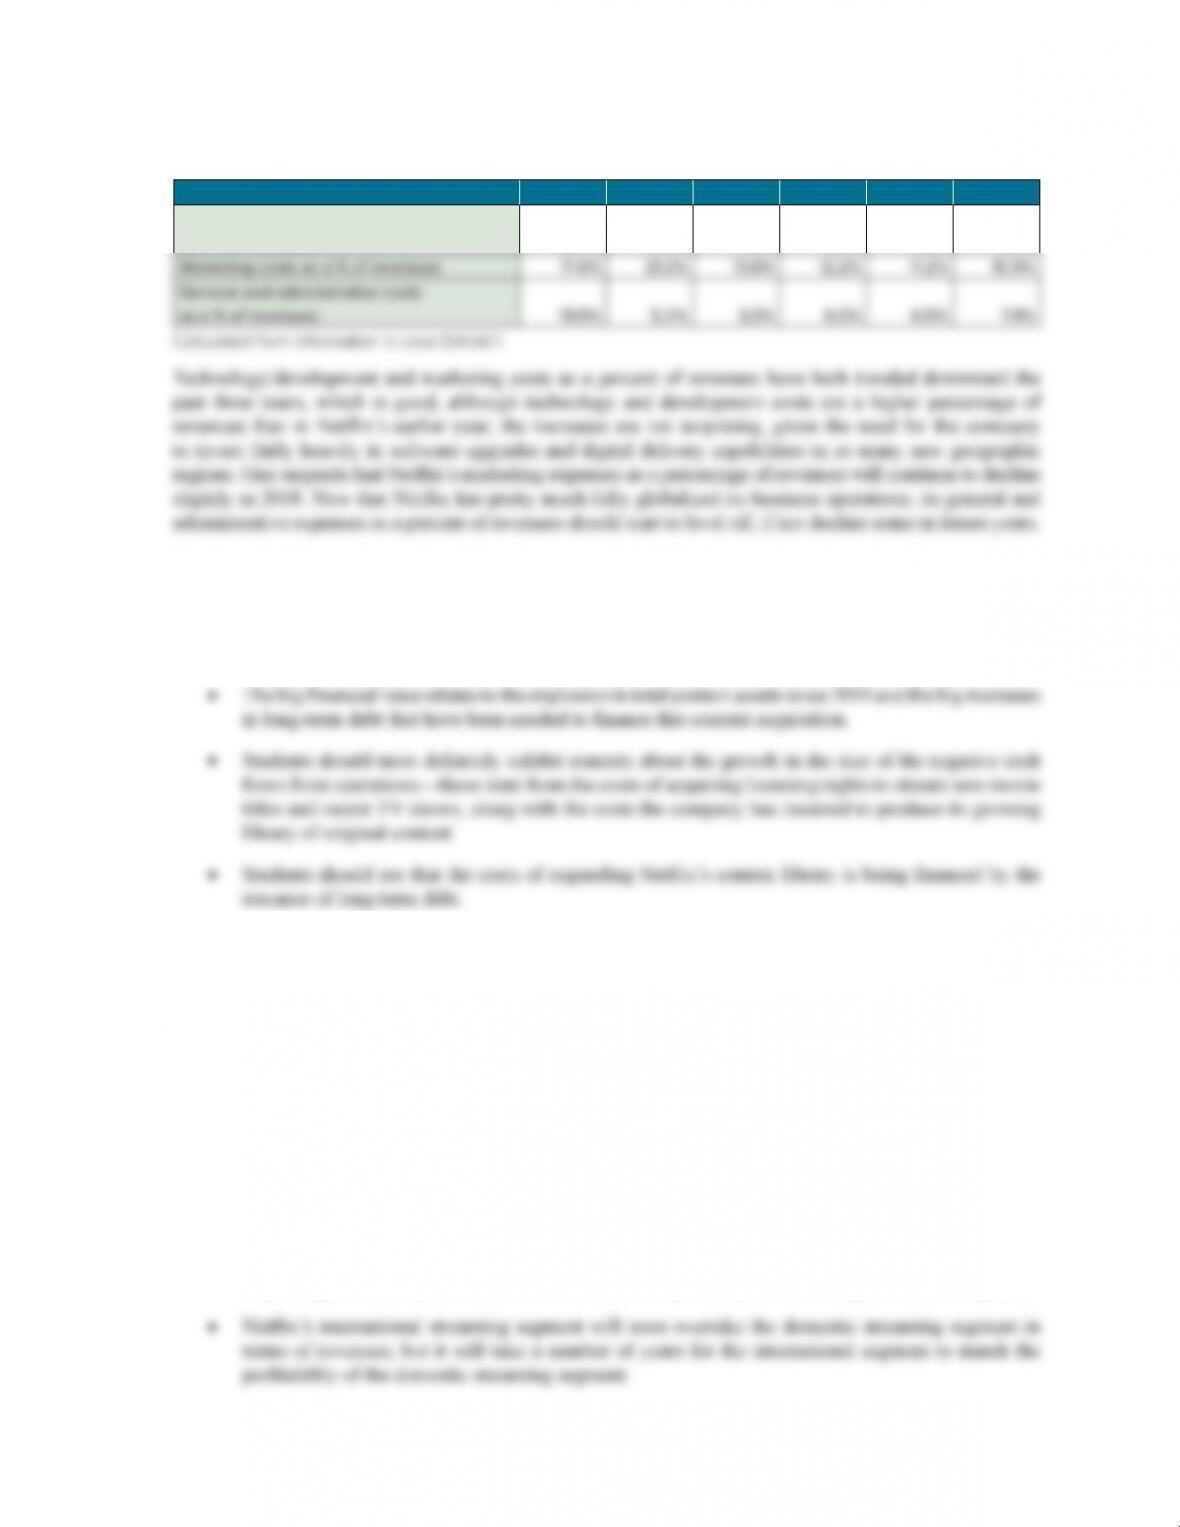
2000 2005 2010 2015 2016 2017
Gross profit margin
(gross profit as a % of revenues) 2.2% 31.9% 37.2% 32.3% 31.7% 34.5%
Calculated from information in case Exhibit 1.
Netix’s profit margins have definitely been skimpy during the 2015-2017 period, but all three percentages
Case 14 Teaching Note Netflix’s Strategy in 2018
456
The following table shows the operating expense ratios for Netix:
2000 2005 2010 2015 2016 2017
Technology and development costs
as a % of revenues 46.9% 5.2% 7.6% 9.6% 9.6% 9.0%
From the balance sheet and cash ow data in case Exhibit 1, class members should be able to determine
the following:
• Netix’s current ratio was 2.57 in 2005, 1.64 in 2010, 1.54 in 2015, 1.25 in 2016, and 1.40 in 2017.
The company’s short-term liquidity has been adequate.
There are several questions you can pose to the class at this juncture (and you might want to have them
ip over to the data in case Exhibits 6 and 7 before answering the questions posed below):
• How long can Netix continue to issue such large amounts of additional long-term debt every year?
• Is the company headed for big financial trouble if it continues to spend so much money on content
acquisition?
• What will it take for the company to continue along its present financial path of issuing large
amounts of debt to finance new content acquisitions?
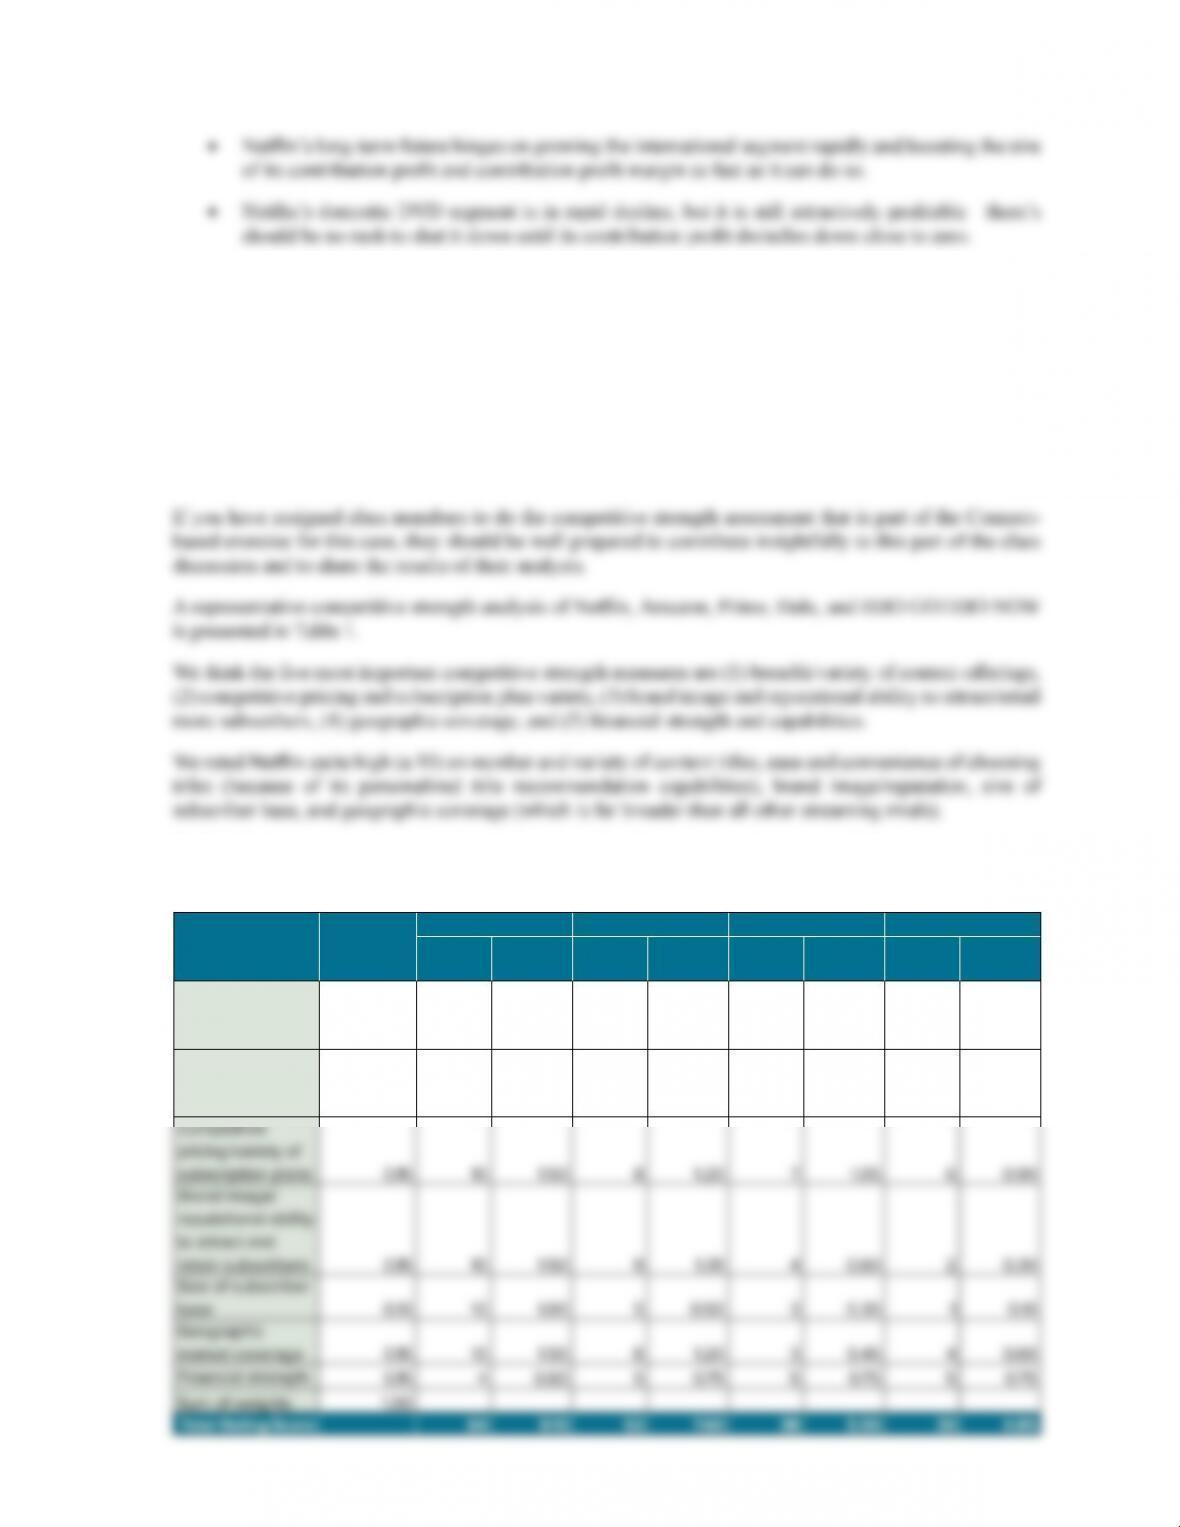
What does the data in case Exhibit 5 tell us about Netix’s business?
Students should take note of the following:
• Netix’s domestic streaming business is a strong performer—all of the performance metrics are
improving across the past three years. Further, this is presently Netix’s largest business segment.
Case 14 Teaching Note Netflix’s Strategy in 2018
457
8. How does Netflix’s competitive strength compare against that of Amazon Prime, Hulu,
and HBO GO/HBO NOW? Do a weighted competitive strength assessment using the
methodology pres en ted in Table 4.4 of Chapter 4 to support your answer. Does Netflix have
a sustainable competitive advantage over either or both of these two rivals in the movie
rental busi ness? Why or why not?
There is ample information in the Netix case for students to do a competitive strength assessment and
practice using the methodology presented in Table 4.4 in Chapter 4. We urge spending about 10-15 minutes
of class time drilling students on proper use of this tool.
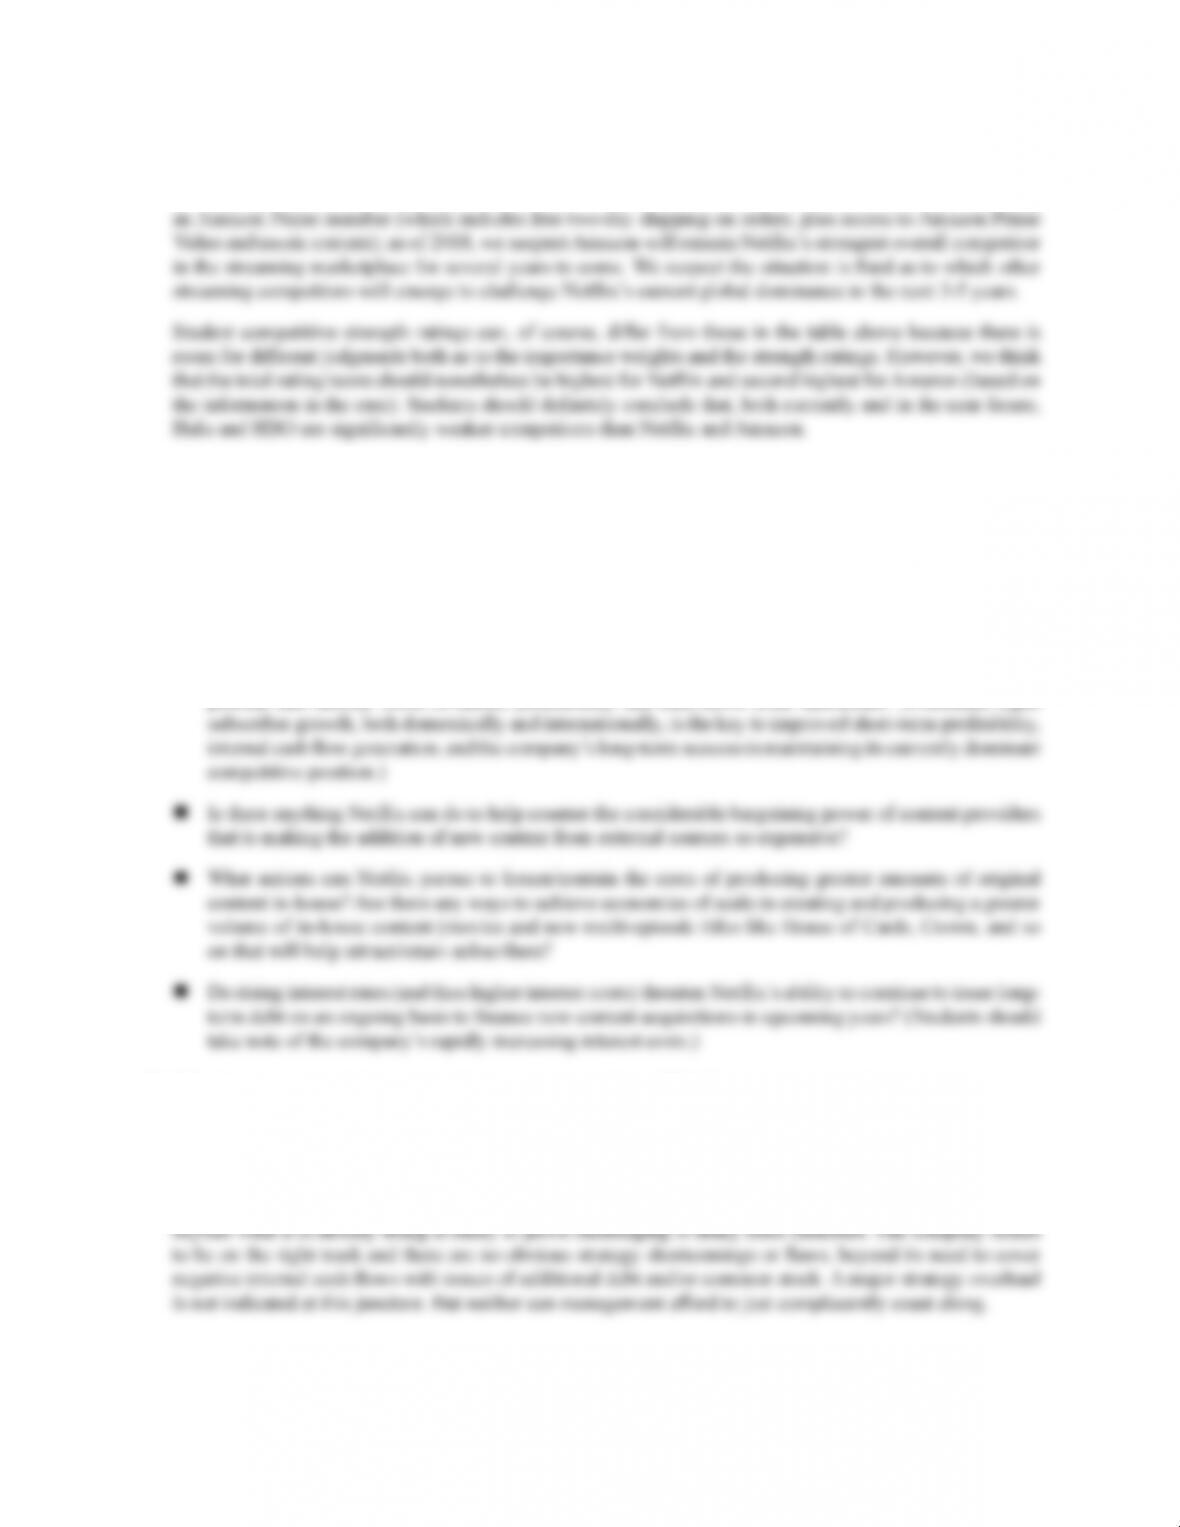
TABLE 1. Competitive Strength Assessments of Netflix, Amazon, Hulu, and HBO
(Rating scale for each strength measure: 1 = very weak; 5 = average; 10 = very strong)
Competitive
Strength
Measures
Importance
Weight
Netflix Amazon Hulu HBO GO/NOW
Strength
Rating
Weighted
Score
Strength
Rating
Weighted
Score
Strength
Rating
Weighted
Score
Strength
Rating
Weighted
Score
Number/variety
of titles in content
library 0.20 10 2.00 91.80 81.60 71.40
Ease and
convenience of
choosing titles 0.10 10 1.00 80.80 80.80 80.80
Case 14 Teaching Note Netflix’s Strategy in 2018
458
The competitive strength ratings in Table 1 indicate that Netix is presently the strongest global streaming
competitor. Amazon is rated as Netix’s most formidable competitor currently because of its streaming
offerings, its brand image/reputation as an online shopping site for consumers, and the attraction of being
9. What 3-4 top priority issues does Netflix management need to address?
We think it is always a good idea to push the class for their assessment of what issues management needs
to address before proceeding to ask for action recommendations. Issue identification (or compilation of a
“worry list”) is a way for students to draw conclusions from all the preceding analysis, plus it sets the stage
for what actions need to be taken.
In Netix’s case, we see several high-priority issues that merit top management consideration:
What, if anything, should Netix do differently in trying to grow its subscriber base as rapidly as is
prudent and thereby boost revenues, profitability, and cash ows from operations? (Continued rapid
10. What recommendations would you make to Netflix CEO Reed Hastings? At a minimum, your
recommendations should cover what to do about each of the top priority issues identified in
question 9.
Students should be pressed to offer practical action recommendations to address the issues identified in the
prior question. But you should appreciate that coming up with good action recommendations for Netix
Case 14 Teaching Note Netflix’s Strategy in 2018
459
A reasonable set of action recommendations might include the following:
Further content additions are going to be more expensive because content providers are very definitely
exercising their considerable bargaining power. It is unclear that there is much that Netix can do to
negate the bargaining power of content providers beyond that of convincing content providers that there
The 30-day free trial seems adequate as a marketing tactic to attract new subscribers. It is hard to
come up with a “better deal” that makes good financial sense for Netix. And marketing expenditures
Heightened competition from Netix’s current and future streaming rivals is certain to occur, but what
Netix can do to combat this competition beyond what it is already doing is far from obvious. It can
It does make sense for Netix management to keep a tight rein on the costs of new content acquisition.
This includes licensing fees to external content providers and the costs of creating and producing in-
house content. expenses. Containing content acquisition costs will protect profitability and help enhance
cash ows from operations, as well as keeping Netix cost competitive and enabling it to charge
Case 14 Teaching Note Netflix’s Strategy in 2018
460
Epilogue
As of Fall 2018, there were several pending developments regarding the entry of new streaming competitors
and the actions of existing competitors. Google’s YouTube had announced plans to expand its streaming options
beyond the realm of viral videos and self-help tutorials via a new subscription service called YouTube Premium,
which debuted in Great Britain in July 2018; YouTube Premium was endeavoring to attract subscribers with
three-month free trials, but its price was £12 per month, about double Netix’s monthly price. A YouTube
Premium subscription included access to a new music streaming service, YouTube Music, which integrated its
music video library with an audio-oriented app not significantly different from those offered by Spotify or Apple
Music. The other selling point of YouTube Premium—aside from ad-free access to its regular service—was its
new catalogue of original film and television content.
Disney had announced it would use its content library to launch a new streaming service in 2019; in July 2018,
Disney agreed to acquire the content portfolio of 21st Century Fox, one of the most formidable content libraries
in all of Hollywood, that included franchises like “Avatar” and “X-Men” and Fox’s regional sports networks
and cable channels (FX and National Geographic) for a purchase price of $71 billion. This gave Disney what
Case 14 Teaching Note Netflix’s Strategy in 2018
461
The following table shows Netix’s quarterly performance for the most recent 5 quarters plus management’s
forecast for Q4 2018:
(in millions except per share data
and Streaming Content
Obligations) Q3’17 Q4’17 Q1’18 Q2’18 Q3’18
Q4’18
Forecast
Total (Including DVD)
Revenue $2,985 $3,286 $3,701 $3,907 $3,999 $4,199
Y/Y % Growth 30.3% 32.6% 40.4% 40.3% 34.0% 27.8%
Operating Income $209 $245 $447 $462 $481 $205
Total Streaming:
Revenue $2,875 $3,181 $3,602 $3,814 $3,911 $4,114
Y/Y % Growth 33.2% 35.3% 43.2% 42.8% 36.0% 29.3%
US Streaming
Revenue $1,547 $1,630 $1,820 $1,893 $1,937 $1,995
Contribution Profit $554 $561 $697 $740 $762 $663
International Streaming
Revenue $1,327 $1,550 $1,782 $1,921 $1,973 $2,119
Contribution Profit (Loss) $62 $135 $272 $298 $338 $211
Consolidated
Net cash (used in) operating
activities $(420) $(488) $(237) $(518) $(690)
Free Cash Flow $(465) $(524) $(287) $(559) $(859)
EBITDA $273 $313 $534 $563 $584
Shares (fully diluted) 447.4 448.1 450.4 451.6 451.9
Streaming Content Obligations*
($B) 17.0 17.7 17.9 18.4 18.6
Case 14 Teaching Note Netflix’s Strategy in 2018
462
To give the company more production capacity for original content, during Q3 management announced the
selection of Albuquerque, New Mexico as the site of a new U.S. production hub, where the company expected
to spend $1 billion annually producing its own original content over the next 10 years and creating up to 1,000
production jobs per year. Netix’s internal studio was already the single largest supplier of content to Netix (on
a cash basis). Netix was also expanding production of its international originals, with projects spanning India,
Mexico, Spain, Italy, Germany, Brazil, France, Turkey and the Middle East. In India, Netix’s hit series Sacred
Games was followed by Ghoul in late August. La Casa de las Flore, Netix’s latest Mexican original, became a
big hit in Q3 2018.