– 546 –
TJX Companies: Its Strategy in O-Price
Home Accessories and Apparel
Overview
In February 2018, TJX Companies, Inc., the world’s largest off-price home accessories and apparel
retailer, completed 42 years of operations with several enviable milestones: the company had edged
up to number 85 on the Fortune 500, surpassed $35 billion in sales, and opened its 4,000th store, guided
by a highly effective global strategy. Sales had grown over eight percent and comparable store sales
increased 2 percent in fiscal year 2018. In the company’s 42-year history, it had experienced an annual
decline in comparable store sales in only one year. The strong earnings trend enabled TJX to increase its
per share dividends for fiscal 2019 by 20 percent, which made 21 consecutive years of dividend increases.
There were no walls between departments in TJX stores—stores could expand and contract merchandise areas
for fast response to market trends and changes in customer preferences. TJX had rapid inventory turnover, which
enabled the company to buy close to need, having visibility into current fashion and pricing trends. The company
sourced its merchandise from around the world from a group of over 20,000 vendors in over 100 countries. TJX
was an industry leader in innovation: the company relentlessly tested new ideas, trying to identify the current
fashions and top brands, and leveraging information from their global worldwide purchasing network. Also,
the company was financially strong, which gave it the ability to invest in the growth of its business. These key
success factors gave TJX management confidence in the company’s ability to achieve corporate goals for global
growth.
*
case 21 teaching note
Case 21 Teaching Note TJX Companies: Its Strategy in O-Price Home Accessories and Apparel
547
Given TJX’s steadily increasing sales and profits in its present structure, President Herrman needed to decide
whether the company should divert part of its attention and resources, and attempt to boost its internet sales?
Also, given the outstanding sales growth driven by opening new stores worldwide, should the company stay the
course, or would concentration on certain geographical locations produce more sales and profits?
There is ample detail in the case for students to evaluate:
■ TJX’s global strategy
Suggestions for Using the Case
The TJX Companies case is brand new, and a very popular case that generates significant interest and classroom
discussion. Almost every student—domestic and international- will be familiar with one or more of TJX’s
business segments, and many will have shopped in the stores. This new case will provoke a lively, interesting
class discussion of whether it was possible for a multinational brick-and-mortar firm to grow and be profitable
in the time of Amazon and internet retailing. Differences of opinion will emerge about how long the brick-and-
mortar chain can survive using its present strategy, the pros and cons of the company’s strategy, and the best
options for the future.
Spirited debate will focus on the viability and sustainability of TJX’s strategic mission and business model,
and whether they are optimally aligned with the off-price retail industry. Students will have differing opinions
Some students will suggest that TJX focus on expanding its relatively new internet sales segment “Sierra Trading
Post” and begin a move from brick-and-mortar to a predominately internet retailer, or at least work to significantly
increase the internet percentage of its business. Can the new CEO Ernie Herrman succeed in keeping the company
on its very strong uptrend? What chance does TJX have to succeed in its present competitive configuration?
What, if any, changes in strategy are needed at The TJX Companies?
Case 21 Teaching Note TJX Companies: Its Strategy in O-Price Home Accessories and Apparel
548
To facilitate your use of assignment questions and making them available to students, we have posted a file
of the Assignment Questions contained in the instructor resources section of the Connect Library for the
22nd Edition.
Utilizing the Guide to Case Analysis. If this is your first assigned case, you may find it beneficial to have
class members read the Guide to Case Analysis located in the instructor resources section of the Connect Library.
Suggested Assignment Questions for an Oral Team Presentation or Written Case Analysis. We
believe the “TJX Companies: Its Strategy in Off-Price Home Accessories and Apparel Retailing” case is quite
well-suited for written assignments and/or oral team presentations. Our suggested assignment questions are as
follows:
■ Ernie Herrman, President and CEO of TJX Companies has employed you as a consultant to assess the
company’s overall situation and recommend a set of actions to improve the company’s future prospects.
Prepare a report to Mr. Herman that includes: (1) an evaluation of TJX’s mission and business model and
■ Prepare a brief report to The TJX Companies’ CEO Ernie Herrman outlining the 2–3 top priority issues
that TJX needs to address to seize additional global market share. Where should he focus his efforts
and resources? What business segments should lead the way and what geographic regions should get
immediate attention? Address the actions you believe he must initiate to increase market share while
Case 21 Teaching Note TJX Companies: Its Strategy in O-Price Home Accessories and Apparel
549
Assignment Questions
1. Describe TJX’s strategic vision and corporate strategy. Is its vision and strategy consistent with the
characteristics of the retail sector? Support your answer.
2. What are TJX’s key resources and capabilities? Does a VRIN analysis suggest that any offer competitive
advantage potential? How well are the company’s capabilities aligned with external opportunities? Is the
company well-positioned to defend against competitive threats?
3. Using the data in case Exhibits 6 and 7, what does an analysis of TJX, Inc.’s consolidated financial
performance reveal about the company’s profitability and liquidity?
Teaching Outline and Analysis
1. Describe TJX’s strategic vision and corporate strategy. Is its vision and strategy consistent
with the characteristics of the retail sector? Support your answer.
TJX’s mission was to deliver great value to our customers every day. The company did this by offering a
rapidly changing assortment of quality, fashionable, brand name, and designer merchandise generally 20
percent to 60 percent below full-price retailers’ (including department, specialty, and major online retailers)
regular prices on comparable merchandise.
Case 21 Teaching Note TJX Companies: Its Strategy in O-Price Home Accessories and Apparel
550
2. What are TJX’s key resources and capabilities? Does a VRIN analysis suggest that any
oer competitive advantage potential? How well are the company’s capabilities aligned
with external opportunities? Is the company well-positioned to defend against competitive
threats?
TJX’s key resources and capabilities include the thousands of stores around the world, its global supply chain
and distribution network, its capabilities in operating a highly flexible and customer responsive business, its
world-class buying organization, and innovativeness. That these are valuable in the off-price retail industry
Case 21 Teaching Note TJX Companies: Its Strategy in O-Price Home Accessories and Apparel
551
3. Using the data in case Exhibits 6 and 7, what does an analysis of TJX, Inc.’s consolidated
financial performance reveal about the company’s profitability and liquidity?
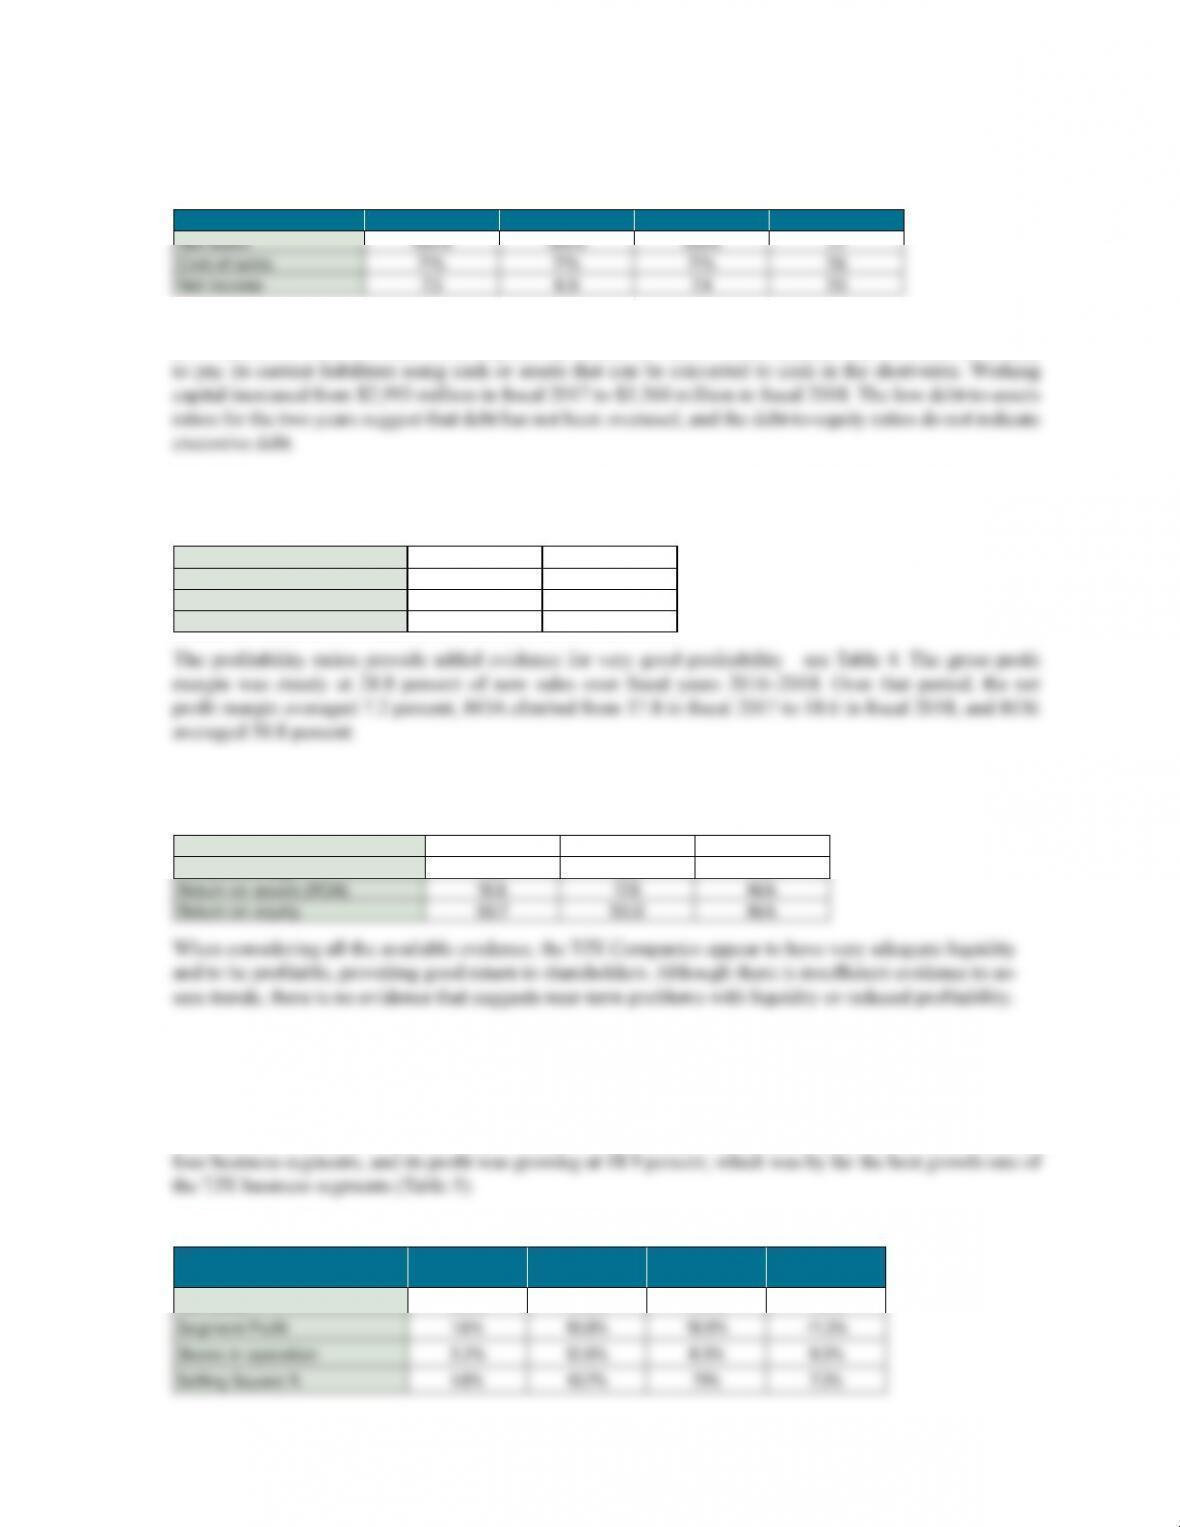
The data provided in the case indicates that TJX is very liquid and profitable. The common size balance
sheet shows an average 21 percent of total assets in cash and cash equivalents, and an average of about
29 percent of total assets in inventories (Table 1). A key aspect of TJX’s business model is high inventory
turnover; consequently, inventory write-down should be minimal. The modest level of inventory for a global
TABLE 1. Common Size Balance Sheet for TJX Companies, Fiscal 2017–Fiscal 2018
Fiscal Year
2018 2017
% %
Assets:
Cash & cash equivalents 19.6 22.7
Liabilities:
Current liabilities 36.5 36.9
Equity:
Common stock 4.5 5.0
The common size income statement indicates a steady cost of sales that was 71 percent of net sales for fiscal
Case 21 Teaching Note TJX Companies: Its Strategy in O-Price Home Accessories and Apparel
552
TABLE 2. Common Size Income Statement for TJX Companies, Fiscal 2016–Fiscal 2018
Fiscal Year
2018 2017 2016 2016–2018
%%%%
Calculation of liquidity ratios reinforces the argument for TJX’s good liquidity. The current ratios for fiscal
2071 and 2018 were 1.63 and 1.66, respectively (Table 3). These values indicate that TJX had the ability
TABLE 3. Key Liquidity and Leverage Ratios for TJX Companies, Fiscal 2017–Fiscal 2018
Fiscal Year Ended
Feb. 3, 2018 Jan. 28, 2017
Current ratio 1.66 1.63
Working capital (millions) $3,360 2,993
Debt-to-assets .63 .65
Debt-to-equity 1.73 1.86
TABLE 4. Key Profitability Financial Ratios for TJX Companies, Fiscal 2016–Fiscal 2018
Fiscal Year Ended
Feb. 3, 2018 Jan. 28, 2017 Jan. 30, 2016
Gross profit margin 28.8 28.9 28.8
Net profit margin 7.3 6.9 7. 4
4. Compare TJX’s business segments. Which segment appears to have the greatest potential?
Are any business units a detriment to overall corporate performance? Support your answer.
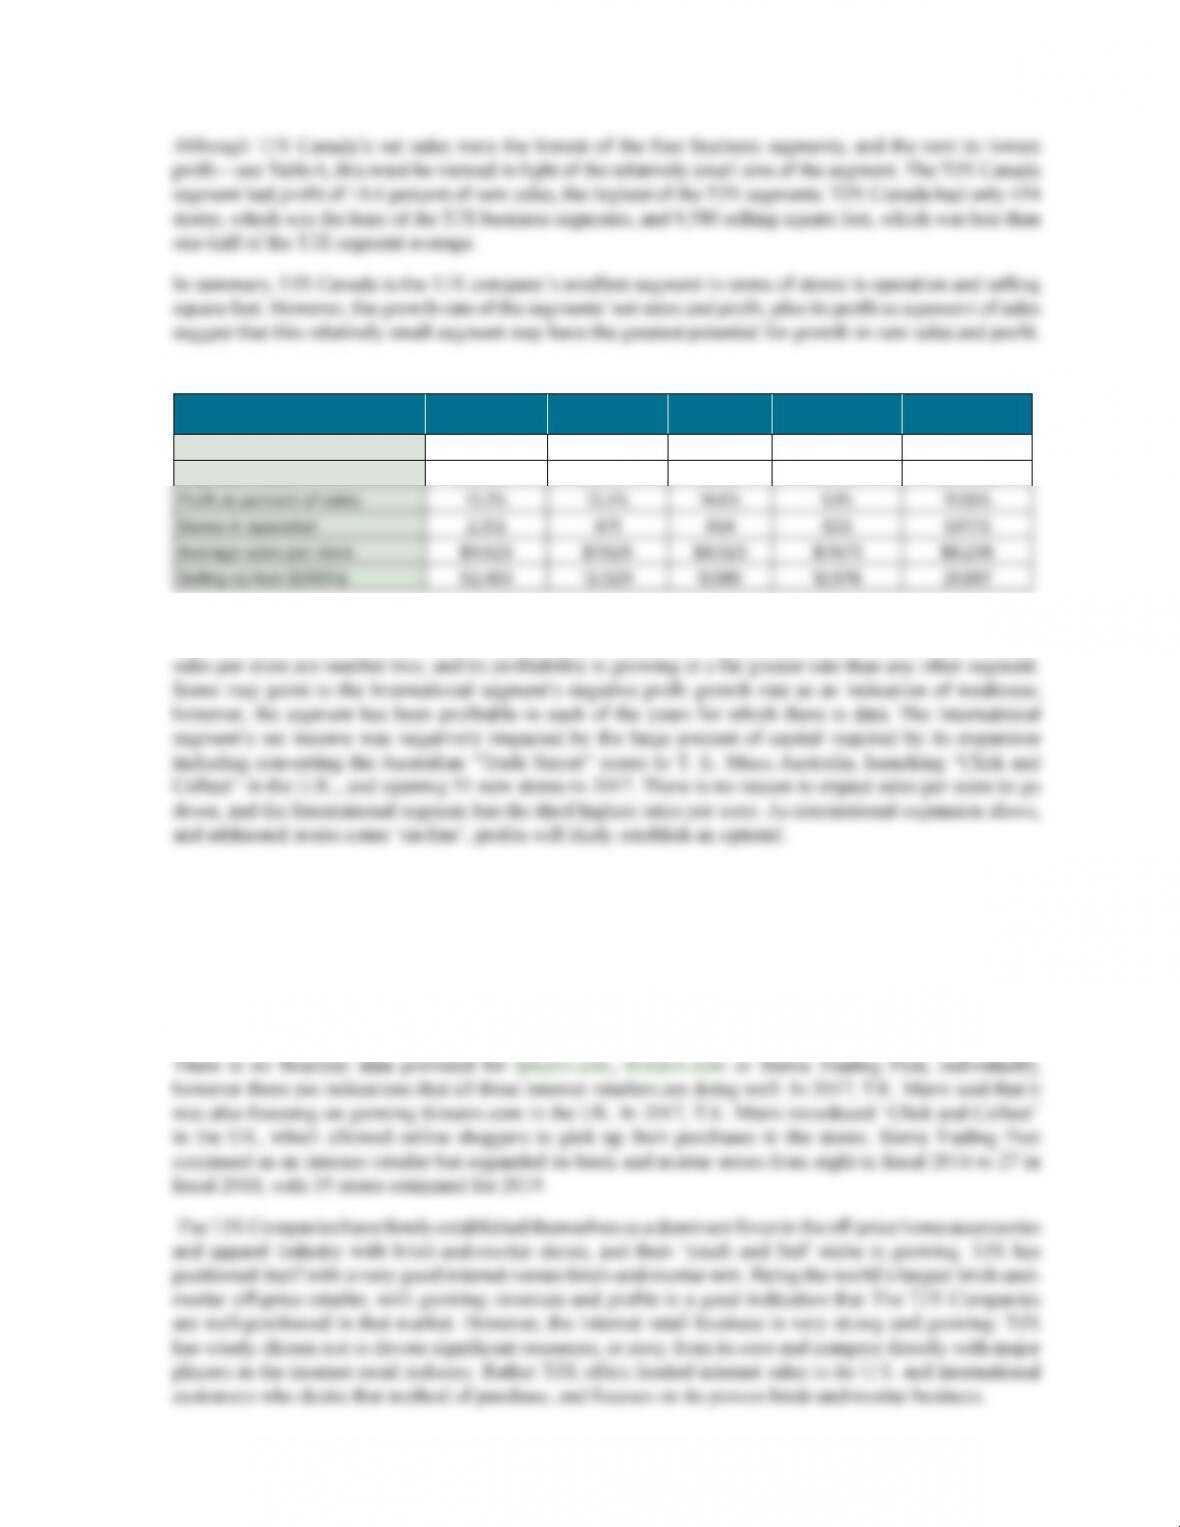
TJX Canada appears to have the greatest potential, based on the financial and other information presented
in the case. The net sales for TJX Canada were growing at 13.0 percent (CAGR), the second best rate of the
TABLE 5. The TJX Companies Segment CAGR Comparison
CAGR Marmaxx Homegoods
TJX
Canada
TJX
International
Net Sales 5.6% 14.3% 13.0% 7.2%
Case 21 Teaching Note TJX Companies: Its Strategy in O-Price Home Accessories and Apparel
553
TABLE 6. The TJX Companies Segment 2018 Sales and Profit Comparison
(Dollars in millions) Marmaxx Homegoods
TJX
Canada
TJX
International Average
Net Sales $22,249.1 $5,116.3 $3,642.3 $4,856.9 $8,966.2
Segment Profit $2,949.4 $674.5 $530.1 249.2 $1,100.8
There are no business units that pose a threat to TJX’s overall corporate performance. Although the Canadian
segment had the lowest net sales, its profit as a percent of sales is the highest of the four TJX segments, average
5. Does TJX have a good internet versus brick-and-mortar mix? Are there opportunities to
revise the retailing approach of its business units?
TJX has very limited internet operations. In 2009, T.K. Maxx launched its e-commerce site, tkmaxx.com in
the UK, and in 2012, TJX acquired a U.S. off-price Internet retailer, Sierra Trading Post. T.J. Maxx launched
its e-commerce site, tjmaxx.com, in 2013. The following year, Sierra Trading Post opened two brick-and-
mortar stores to bring its off-price outdoor apparel to more consumers.
Case 21 Teaching Note TJX Companies: Its Strategy in O-Price Home Accessories and Apparel
554
6. What recommendations would you make to TJX management to improve business unit and
corporate performance? Support your recommendations.
The best recommendations for The TJX Companies is to “stay the course” with respect to its business model
and brick-and-mortar/internet mix, keep a presence in internet retailing, but not get into a competitive war
with Amazon. Another recommendation is to focus expansion on business units/geographic regions that
appear to have the greatest profit potential.
Epilogue
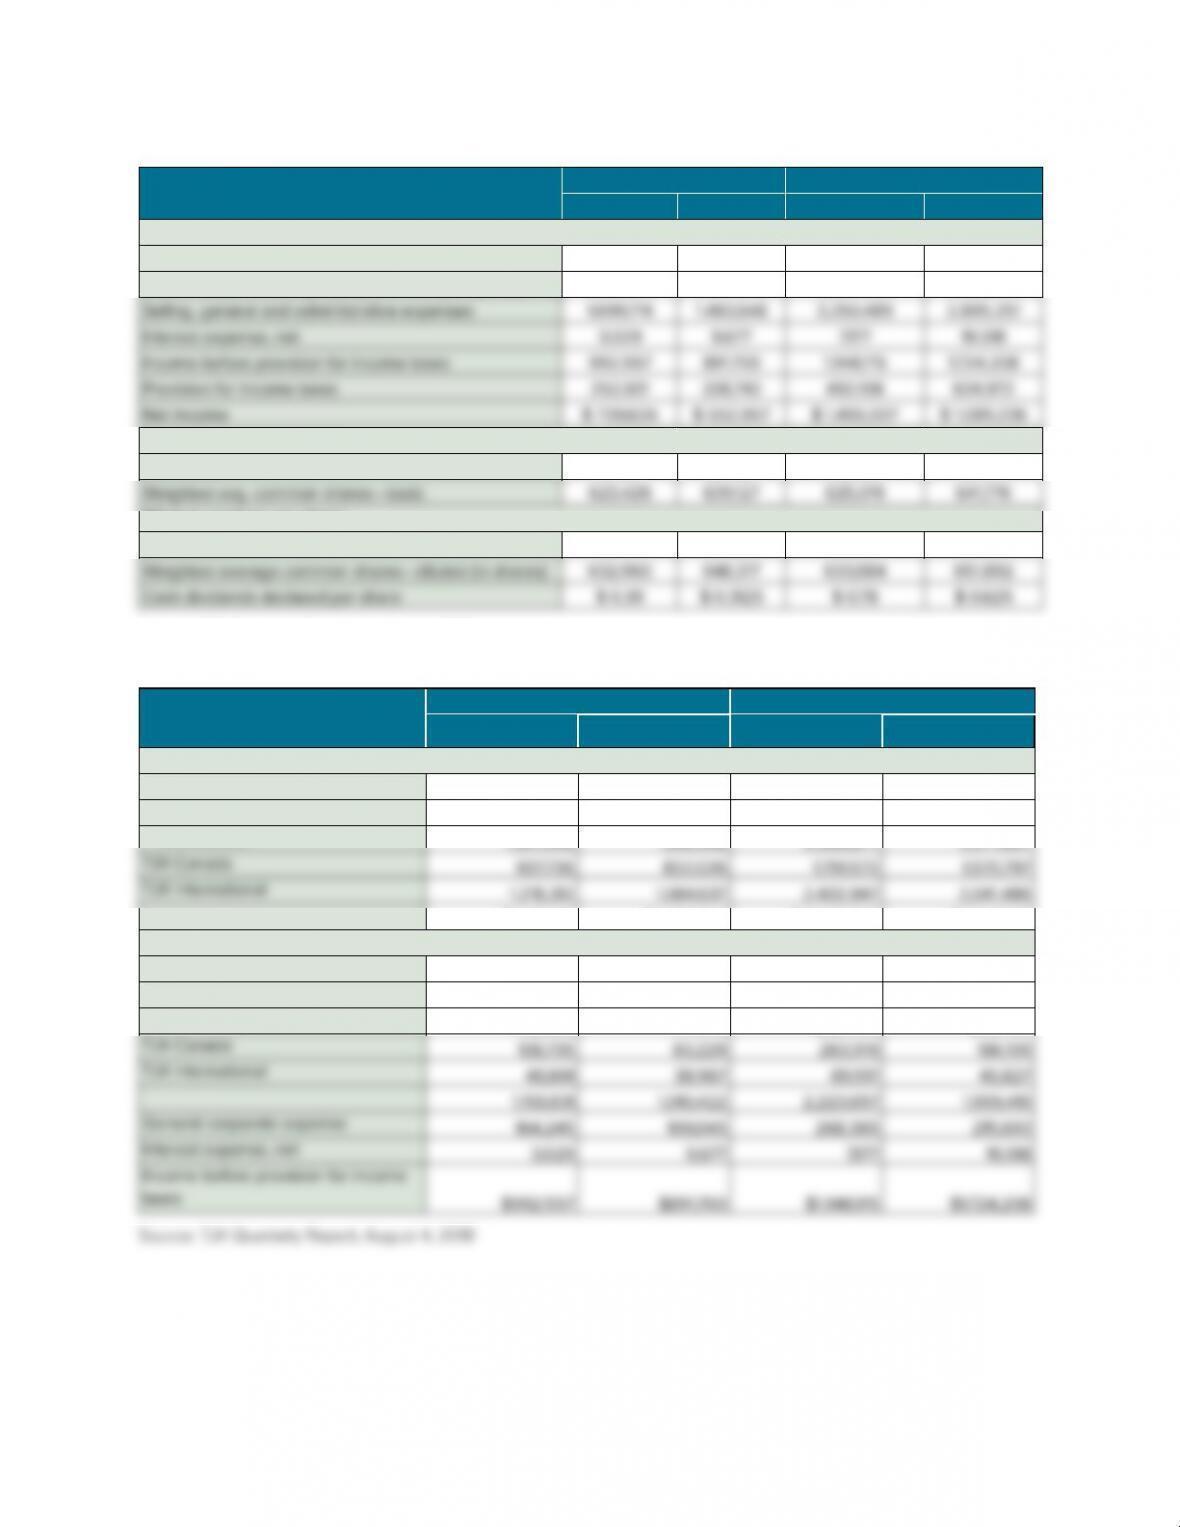
The TJX Companies’ Second Quarter (ended August 4, 2018), 2019 Report showed continued robust growth
in sales and profits. Net sales for the second quarter of Fiscal 2019 increased 12% to $9.3 billion. Consolidated
comparable store sales increased 6% over the comparable period last year ending August 5, 2017. Net income
for the second quarter was $740 million and diluted earnings per share were $1.17, versus the prior year’s $.85.
Excluding an $.18 benefit due to items related to the 2017 Tax Cuts and Jobs Act, adjusted diluted earnings per
share were $.99.
Case 21 Teaching Note TJX Companies: Its Strategy in O-Price Home Accessories and Apparel
555
Consolidated Statements of Income—USD ($)
shares in Thousands, $ in Thousands 3 Months Ended 6 Months Ended
Aug. 04, 2018 Jul. 29, 2017 Aug. 04, 2018 Jul. 29, 2017
Income Statement
Net sales $ 9,331,115 $ 8,357,700 $ 18,019,835 $16,141,724
Cost of sales, including buying and occupancy costs 6,635,815 5,972,675 12,814,054 11,502,747
Basic earnings per share:
Net income $ 1.19 $ 0.87 $ 2.33 $ 1.70
Diluted earnings per share:
Net income $ 1.17 $ 0.85 $ 2.30 $ 1.67
Source: TJX Quarterly Report, August 4, 2018
TJX’s business segments:
In thousands
Thirteen Weeks Ended Twenty-Six Weeks Ended
August 4, 2018 July 29, 2017 August 4, 2018 July 29, 2017
Net sales:
In the United States:
Marmaxx $5,847,721 $5,284,639 $11,228,639 $10,251,774
HomeGoods 1,327,346 1,156,398 2,596,677 2,277,667
$9,331,115 $8,357,700 $18,019,835 $16,141,724
Segment profit:
In the United States:
Marmaxx $830,315 $746,881 $1,580,771 $1,434,046
HomeGoods 142,090 141,345 289,450 293,437
Case 21 Teaching Note TJX Companies: Its Strategy in O-Price Home Accessories and Apparel
556
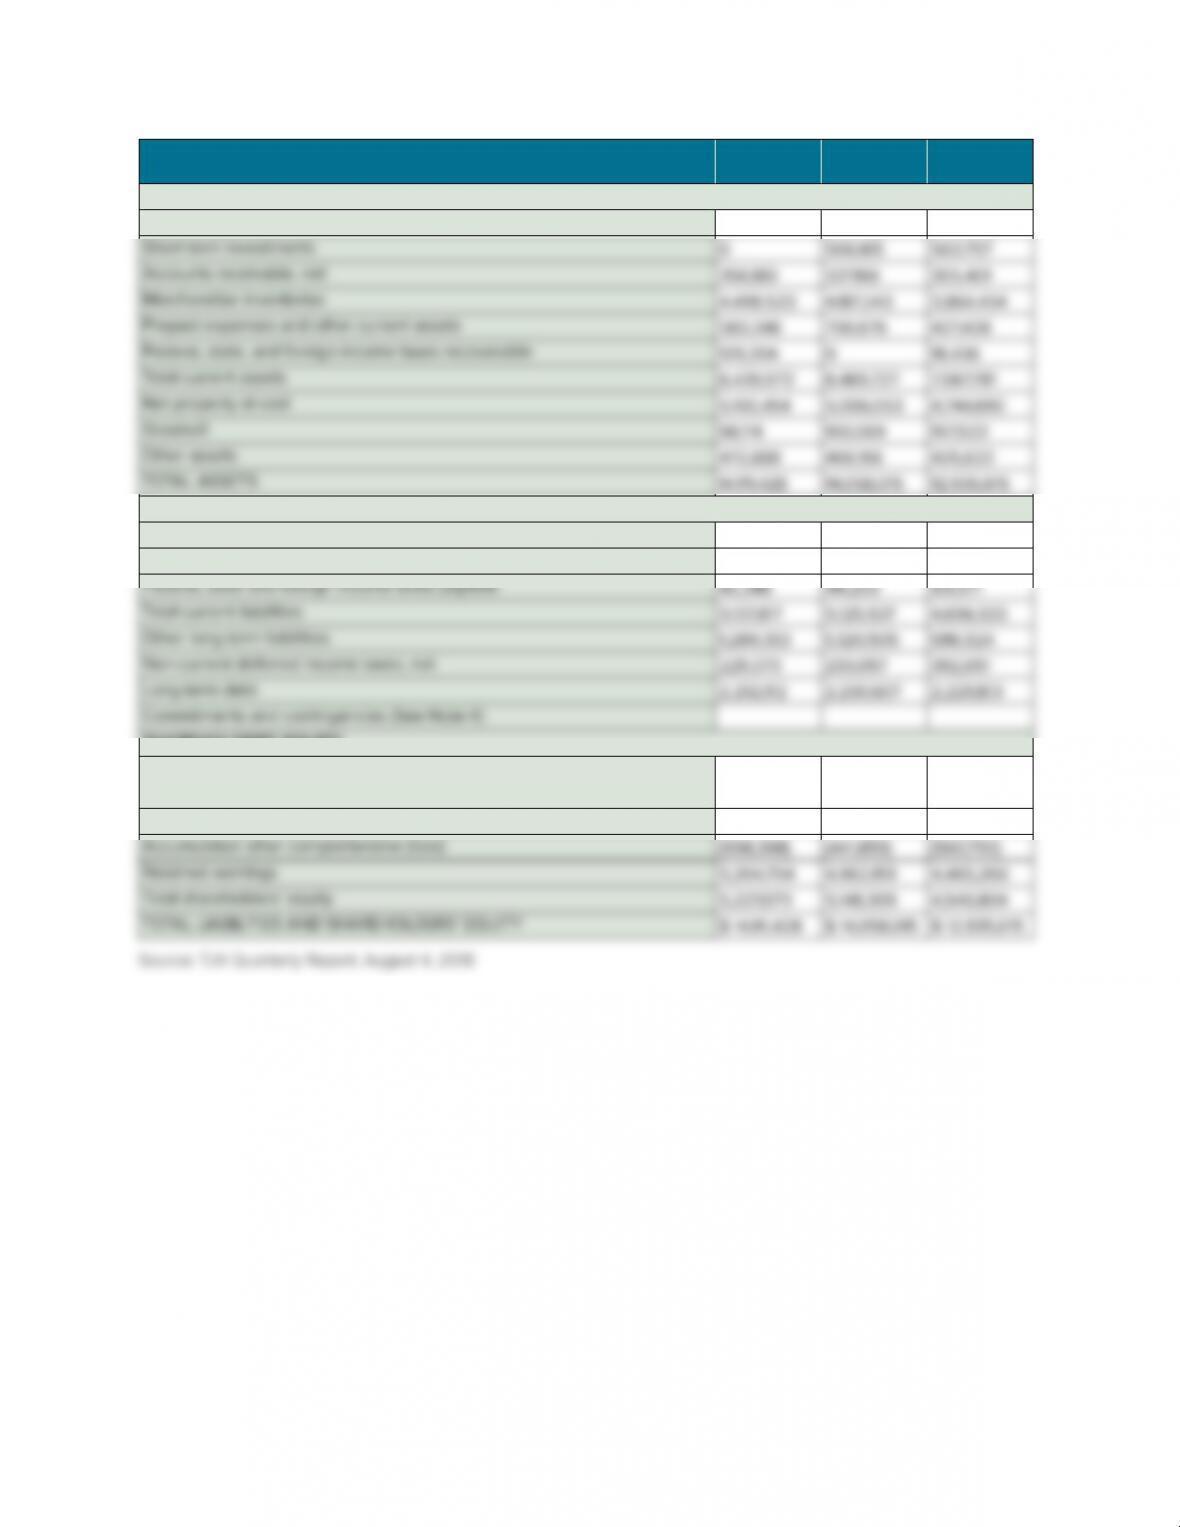
Consolidated Balance Sheets—USD ($)
$ in Thousands
Aug. 04,
2018
Feb. 03,
2018
Jul. 29,
2017
Current assets:
Cash and cash equivalents $ 2,872,717 $ 2,758,477 $ 2,449,305
Current liabilities:
Accounts payable 2,683,285 2,488,373 2,346,548
Accrued expenses and other current liabilities 2,414,186 2,522,961 2,208,014
SHAREHOLDERS’ EQUITY
Common stock, authorized 1,200,000,000 shares, par value $1, issued and
outstanding 620,766,706; 628,009,022 and 636,274,241 respectively 620,767 628,009 636,274
Additional paid-in capital 0 0 0
For the latest information on developments at the TJX Companies, please visit the Investor Relations section at
www.TJX.com and check out the company’s recent press releases and financial results.