– 570 –
Pepsico’s Diversification Strategy
in 2018
Overview
PepsiCo was the world’s largest snack and beverage company with 2017 net revenues of approximately $63.5
billion. The company’s portfolio of businesses in 2018 included Frito-Lay salty snacks, Quaker Chewy
granola bars, Pepsi soft drink products, Tropicana orange juice, Lipton Brisk tea, Gatorade, Propel, SoBe,
Quaker Oatmeal, Cap’n Crunch, Aquafina, Rice-A-Roni, Aunt Jemima pancake mix, and many other regularly
consumed products. The company viewed the lineup as highly complementary since most of its products could
be consumed together. For example, Tropicana orange juice might be consumed during breakfast with Quaker
Oatmeal, Stacy’s pita chips and Sabra hummus might make a nice snack, and Doritos and a Mountain Dew might
be part of someone’s lunch. In 2018, PepsiCo’s business lineup included 22 $1 billion global brands.
The company’s top managers were focused on sustaining the impressive performance that had been achieved
since its restructuring through strategies keyed to product innovation, close relationships with distribution allies,
international expansion, and strategic acquisitions. Newly introduced products such as Mountain Dew Ice,
Doritos Blaze tortilla chips, Sweet Potato Sun Chips, LIFEWTR functional waters, Lemon Lemon sparkling
lemonade, and the 1893 premium line of flavored colas accounted for 15%-20% of all new growth in recent years.
New product innovations that addressed consumer health and wellness concerns were important contributors to
the company’s growth, with PepsiCo’s better-for-you and good-for-you products becoming focal points in the
company’s new product development initiatives. .
In addition to focusing on strategies designed to deliver revenue and earnings growth, the company maintained
an aggressive share repurchase and dividend policy, with a planned $7 billion returned to shareholders in 2018
through share repurchases of $2 billion and dividends of approximately $5 billion. The company bolstered
its cash returns through carefully considered capital expenditures and acquisitions and a focus on operational
: Will the Company’s New
Acquisitions Restore Its Growth
case 23 teaching note
Case 23 Teaching Note Pepsico’s Diversification Strategy in 2018
571
Suggestions for Using the Case
This case is ideal for opening the module on corporate diversification strategies. The case teaches well because
the majority of students are likely to be regular consumers of PepsiCo’s products. Class debate should center on
whether PepsiCo’s diversification strategy has contributed to increased shareholder value. Analysis of the case
data will lead students to conclude that PepsiCo’s top managers have built a fine collection of businesses capable
of delivering impressive earnings and cash flows. Students will recognize the success PepsiCo management has
achieved in exploiting strategic fit opportunities across business units, acquiring new businesses to strengthen
the overall quality of its business line up, and increasing revenues and earnings in international markets. The
issue in 2018 is how PepsiCo management should best revise its corporate strategy to increase revenues and net
profits despite a reliance on a core business competing in a declining industry.
The assignment questions provided in the Student Edition of the Online Learning Center (OLC) are designed to
introduce students to use the tools and concepts in Chapter 8. Students are required to assess the attractiveness
of such food and beverage industries as soft drinks, bottled water, ready to drink teas and coffees, snack foods,
chilled juices, isotonic beverages, grain based snacks, flavored grains, ready to eat and hot cereals, and other
breakfast foods. Students will also be required to evaluate the competitive strength of PepsiCo’s various business
units. The assignment questions require students to construct an attractiveness/strength matrix and consider
the strategic fits and resource fits among its businesses. These analytical steps, along with their assessment of
PepsiCo’s financial performance, puts students in good position to develop solid recommendations of what
PepsiCo’s new top management team should do to sustain the company’s stellar corporate performance.
The assignment questions and teaching outline presented below reflect our thinking and suggestions about
how to conduct the class discussion and what aspects to emphasize.
Case 23 Teaching Note Pepsico’s Diversification Strategy in 2018
572
To facilitate your use of study questions and making them available to students, we have posted a file of the
assignment questions contained in this teaching note for the PepsiCo’s Diversification Strategy in 2018 case
on the Instructor’s section of the Connect Library for the 22nd edition. (We should also point out that there is a
set of study questions posted in the Instructor’s Section of the Connect Library for each of the 32 cases included
in the 22nd edition.)
The Connect-based Exercise for the PepsiCo’s Diversification Strategy in 2018 Case. The auto-
graded exercise for the PepsiCo case requires that students answer a series of multiple choice questions
related to Assignment Questions 1–7. Question 8 is left as open-ended question that allows students to fully
discuss recommendations for addressing strategic issues confronted by the company.
It should take class members roughly 35–45 minutes to complete the exercise, assuming they have done a
conscientious job of reading the case and absorbing the information it contains. Seven of the eight questions in
the PepsiCo case exercise on Connect are automatically graded and entered in your electronic grade book that
Video for Use with the PepsiCo’s Diversification Strategy in 2018 Case. There is an accompanying
6:09 YouTube video that you might want to show the class (or have students watch on their own). It is titled
“PepsiCo CFO Says Beverage Business is ‘Getting Back on Track’.” The link to the video is http://www.youtube.
com/watch?v=90kcyQZ/iQ-M.
You will find that this case works well for oral team presentations and for a written assignment outside of class.
Our suggested assignment questions are
PepsiCo’s Board of Directors has employed you as a consultant to assess PepsiCo’s diversified business
portfolio in 2018 and to make recommendations as to what actions PepsiCo’s top management team
should now take to increase shareholder value to new highs. Your report should contain a 2–3 page
Case 23 Teaching Note Pepsico’s Diversification Strategy in 2018
573
Assignment Questions
1. What is PepsiCo’s corporate strategy? Briefly identify the business strategies that PepsiCo is using in each
of its consumer business segments in 2018.
2. What is your assessment of the long-term attractiveness of the industries represented in PepsiCo’s business
portfolio?
3. What is your assessment of the competitive strength of PepsiCo’s different business units?
4. What does a 9-cell industry attractiveness/business strength matrix displaying PepsiCo’s business units look
like?
5. Does PepsiCo’s portfolio exhibit good strategic fit? What value-chain match-ups do you see? What
opportunities for skills transfer, cost sharing, or brand sharing do you see?
Teaching Outline and Analysis
1. What is PepsiCo’s corporate strategy? Briefly identify the business strategies that PepsiCo
is using in each of its consumer business segments in 2018.
PepsiCo’s corporate strategy.
Basic approach: related diversification (of highly complementary products)
The businesses are all concerned with consumer foods and beverages and share key success factors:
branding, importance of advertising, new product development, operating efficiencies, and strong
distribution.
Case 23 Teaching Note Pepsico’s Diversification Strategy in 2018
574
2. What is your assessment of the long-term attractiveness of the industries represented in
PepsiCo’s business portfolio?
It is important to recognize that, with the exception of a few Quaker products, PepsiCo has diversified into
convenience food and beverage industries rather than the broader processed foods industry. Students should
recognize that the company’s snacks and beverages offer more growth potential and are more profitable
than the overall food and beverage industry based upon the case discussion of the snack food and beverage
3. What is your assessment of the competitive strength of PepsiCo’s dierent business units?
Students will have little trouble determining that PepsiCo has done an exceptional job of building a lineup of
businesses with strong competitive positions in their respective industries. The company holds number one
Case 23 Teaching Note Pepsico’s Diversification Strategy in 2018
575
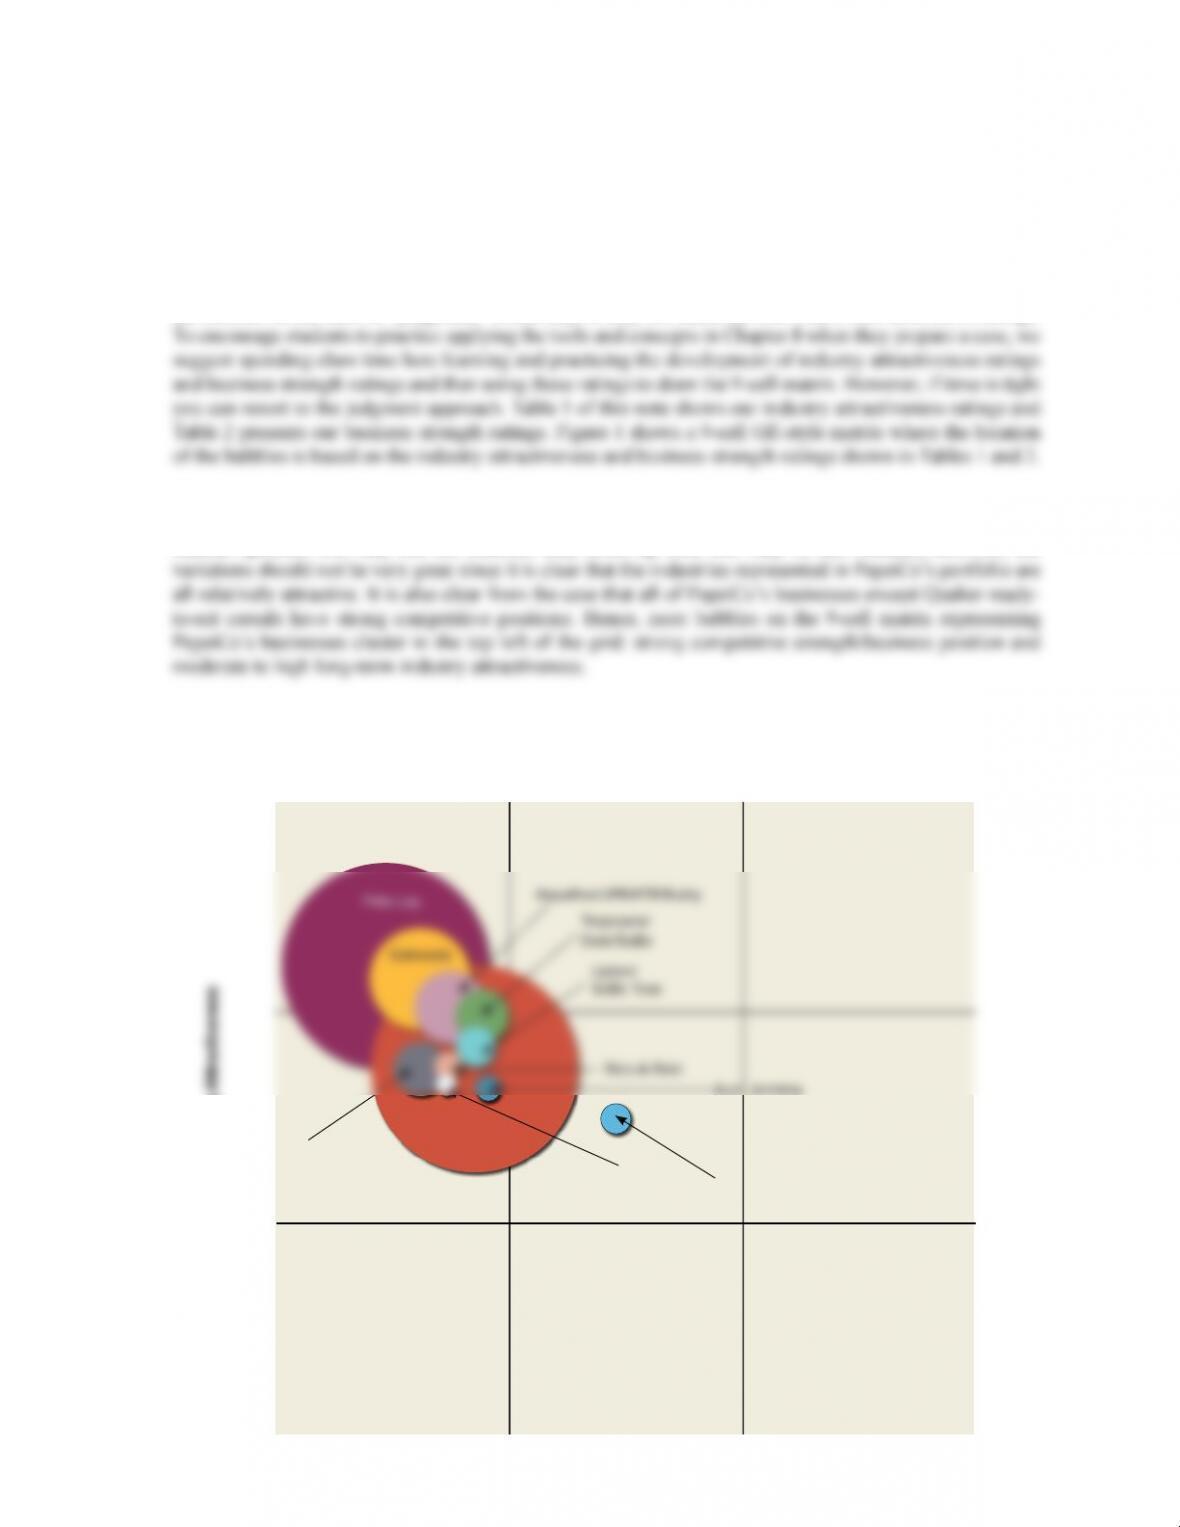
TABLE 1. Industry Attractiveness Assessment for PepsiCo’s Businesses
(Scale 1 = very low attractiveness, 5 = average attractiveness, 10 = very strong attractiveness)
Unweighted/Weighted Ratings for Industries Represented in PepsiCo’s Portfolio
Attractiveness
Measure Wt.
Soft
Drinks
Bottled
Water
Chilled
Juices
Functional
Beverages
RTD
Tea
RTD
Coee
Salty
Snacks
Hot
Cereals
RTE
Cereals
Flavored
Grains
Other
Breakfast
Market size
and growth
rate .20 8/1.6 8/1.6 6/1.2 8/1.6 7/1.4 2/.4 8/1.6 4/.8 4/.8 2/.4 2/.4
Industry
Resource
requirements .15 8/1.2 7/1.1 7/1.1 7/1.1 5/.8 5/.8 8/1.2 6/.9 6/.9 6/.9 6/.9
TABLE 2. Competitive Position/Business Strength Calculations for PepsiCo’s Business Units
(Scale 1 = very weak, 5 = average, 10 = very strong)
Unweighted/Weighted Ratings for Industries Represented in PepsiCo’s Portfolio
Attractiveness
Measure
Wt. Pepsi-Cola
Aquafina/
LIFEWTR/
Bubly
Tropicana/
Dole/SoBe Gatorade
Lipton/
SoBe
Starbucks
Frappucino Frito-Lay
Quaker
Oatmeal
Quaker
Cereals
Rice-A-
Roni
Aunt
Jemima
Market size
and growth
rate .20 9/1.8 10/2.0 10/2.0 10/2.0 10/2.0 10/2.0 10/2.0 10/2.0 4/.8 10/2.0 10/2.0
Emerging
opportunities
and threats .15 9/1.35 9/1.35 9/1.35 9/1.35 7/1.05 7/1.05 10/1.5 9/1.35 9/1.35 9/1.35 10/1.5
Resource
Case 23 Teaching Note Pepsico’s Diversification Strategy in 2018
576
4. What does a 9-cell industry attractiveness/business strength matrix displaying PepsiCo’s
business units look like?
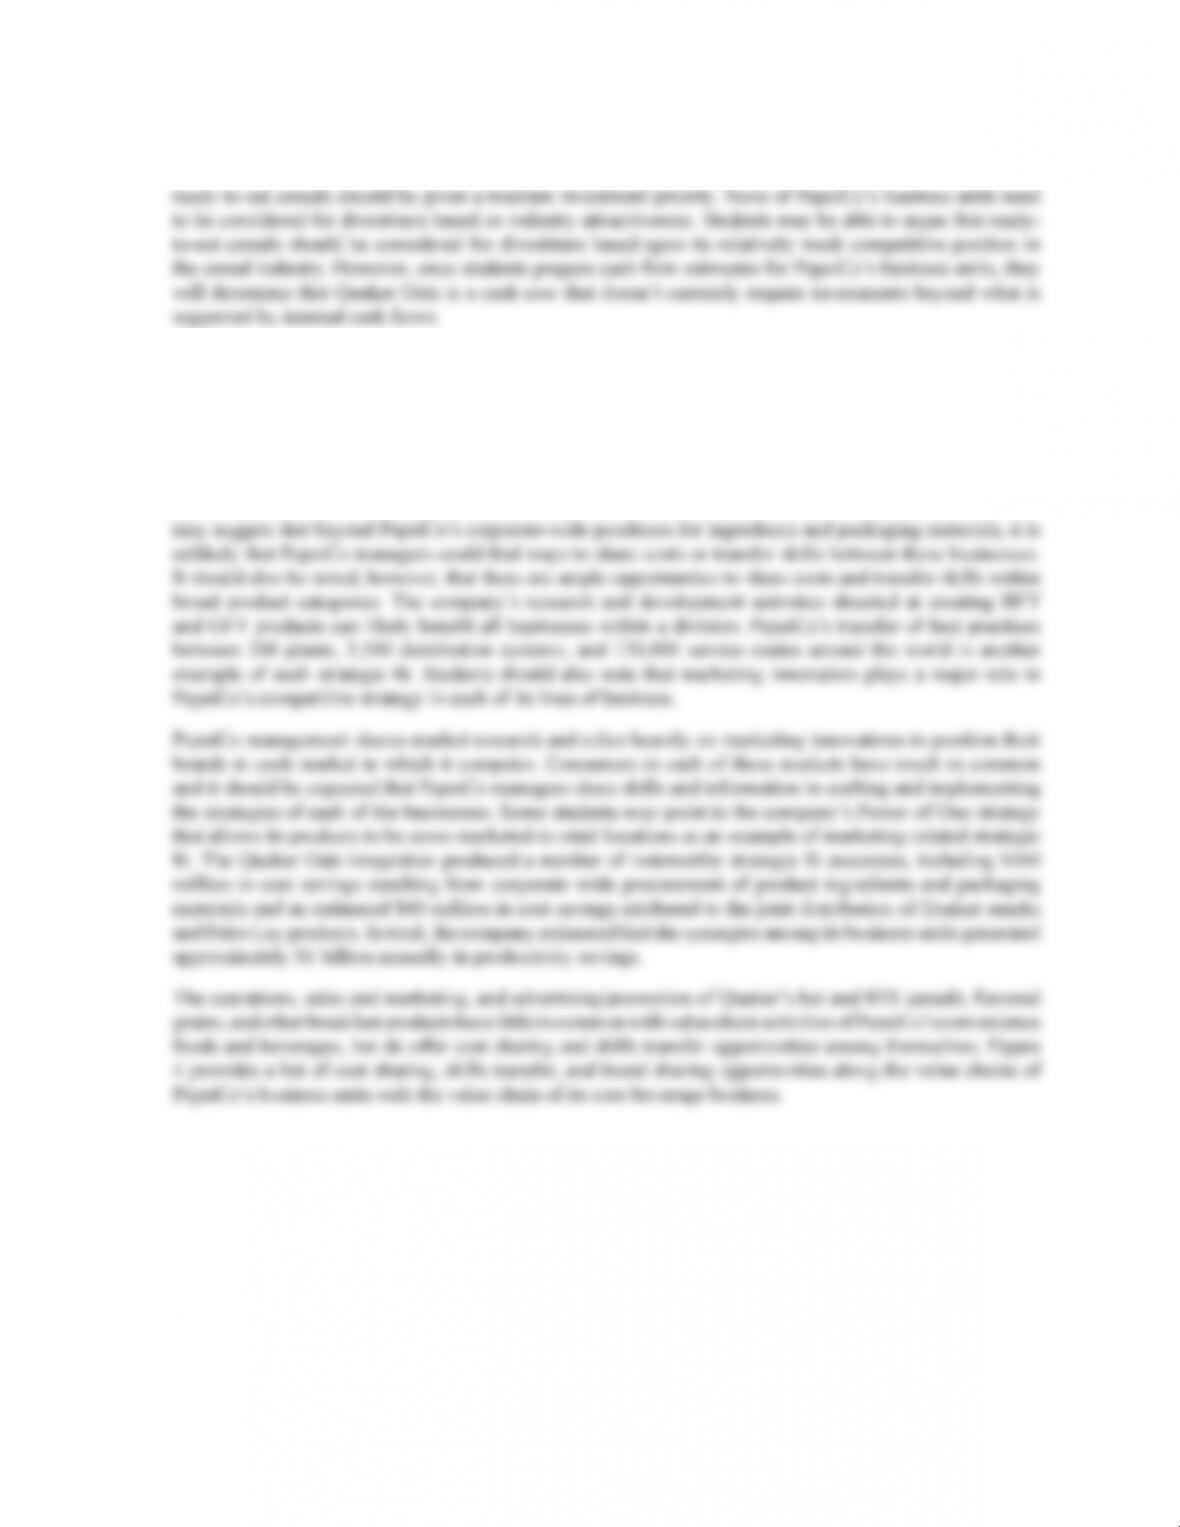
Construction of a 9-cell industry attractiveness/business strength matrix for PepsiCo using rigorous
methodology, requires students to calculate industry attractiveness ratings for each of the industries in which
PepsiCo competes and do competitive strength ratings for each of PepsiCo’s business units. These ratings
should then be used to plot the location of the bubbles on the 9-cell grid. Otherwise, students end up locating
the bubbles on the basis of “judgment,” which may or may not match up well with a well-done set of ratings.
There’s ample room for judgmental differences regarding selection of the factors, the weights, and the
ratings used to draw a 9-cell GE matrix depicting PepsiCo’s portfolio. Therefore, you should expect that
student opinions will vary and the matrices they come up with will vary. In this instance, however, the
FIGURE 1. Sample Industry Attractiveness/Competitive Strength Matrix of Pepsico’s Domestic
Businesses
Strong Weak
Competitive Strength/Business Position
Long–Term Industry Attractiveness
High
Pepsi-Cola
Aquafina/LIFEWTR/Bubly
Tropicana/
Dole/SoBe
Quaker
Oatmeal
Starbucks
Frappucino
Quaker Cereal
Low
Case 23 Teaching Note Pepsico’s Diversification Strategy in 2018
577
The 9-cell GE-style matrix analysis (Figure 1) indicates that PepsiCo’s portfolio consists chiefly of “grow
and build” businesses that should be given a high priority for investment. Students should conclude that
5. Does PepsiCo’s portfolio exhibit good strategic fit? What value-chain match-ups do you see?
What opportunities for skills transfer, cost sharing, or brand sharing do you see?
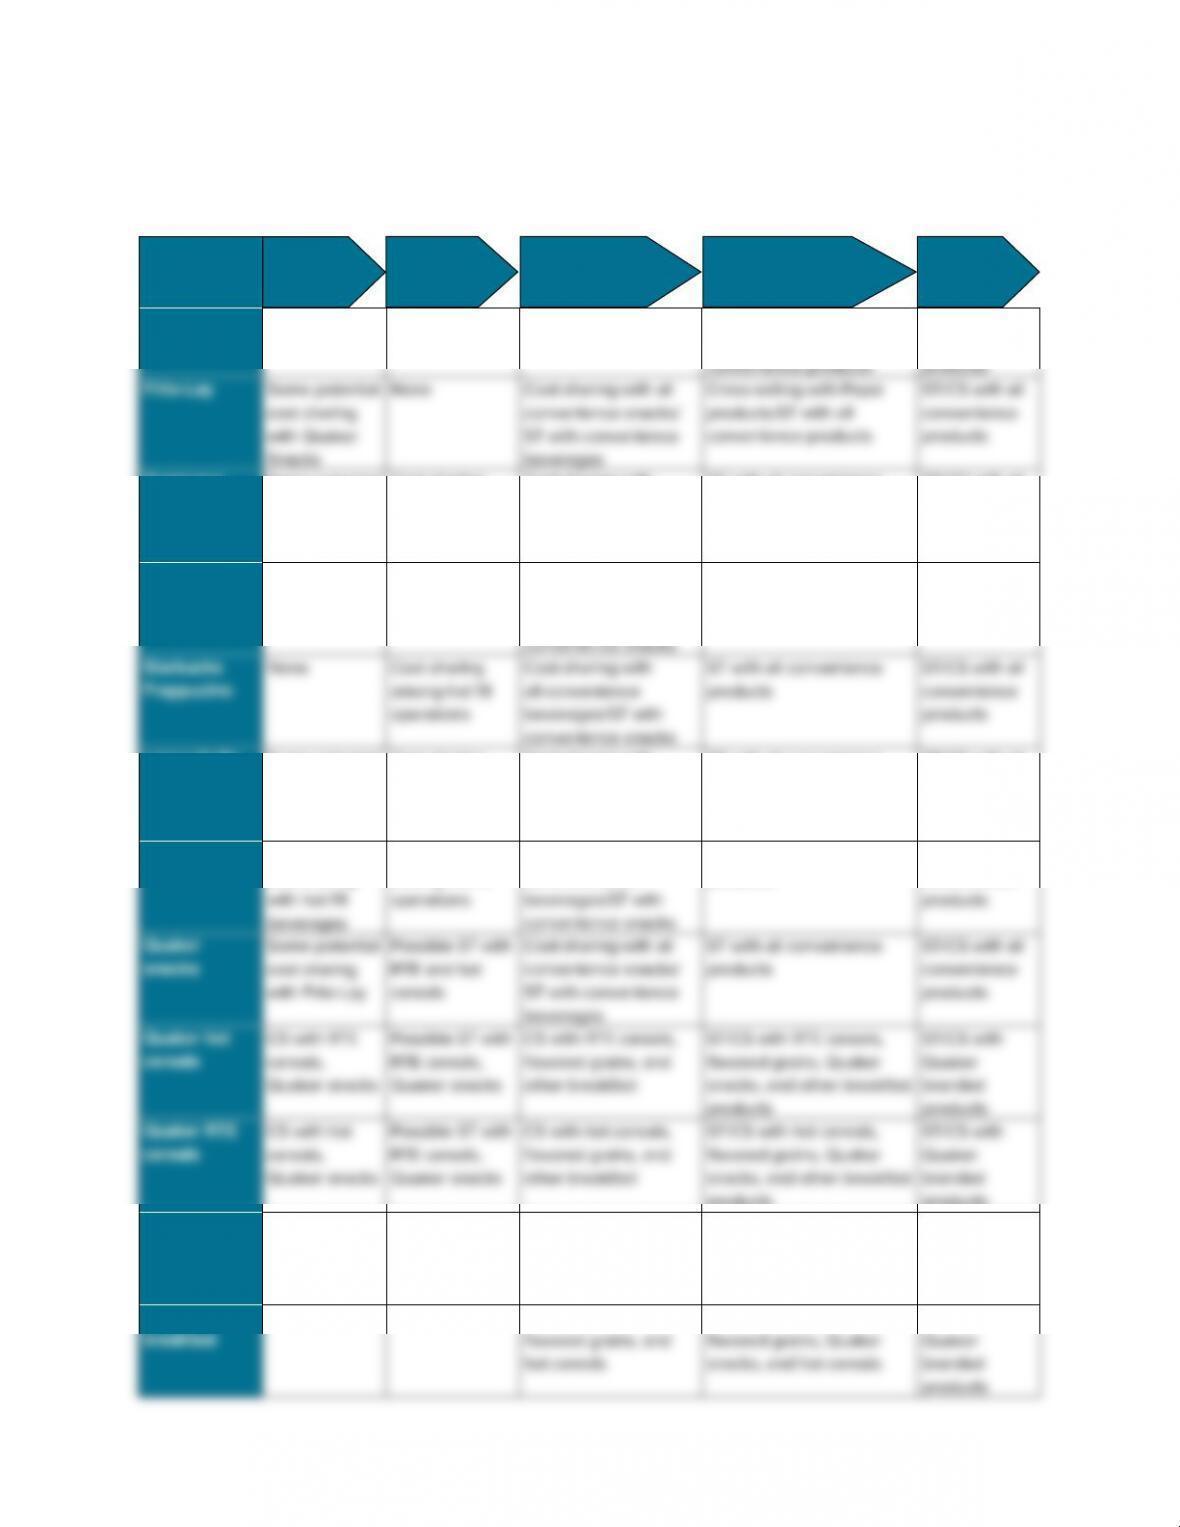
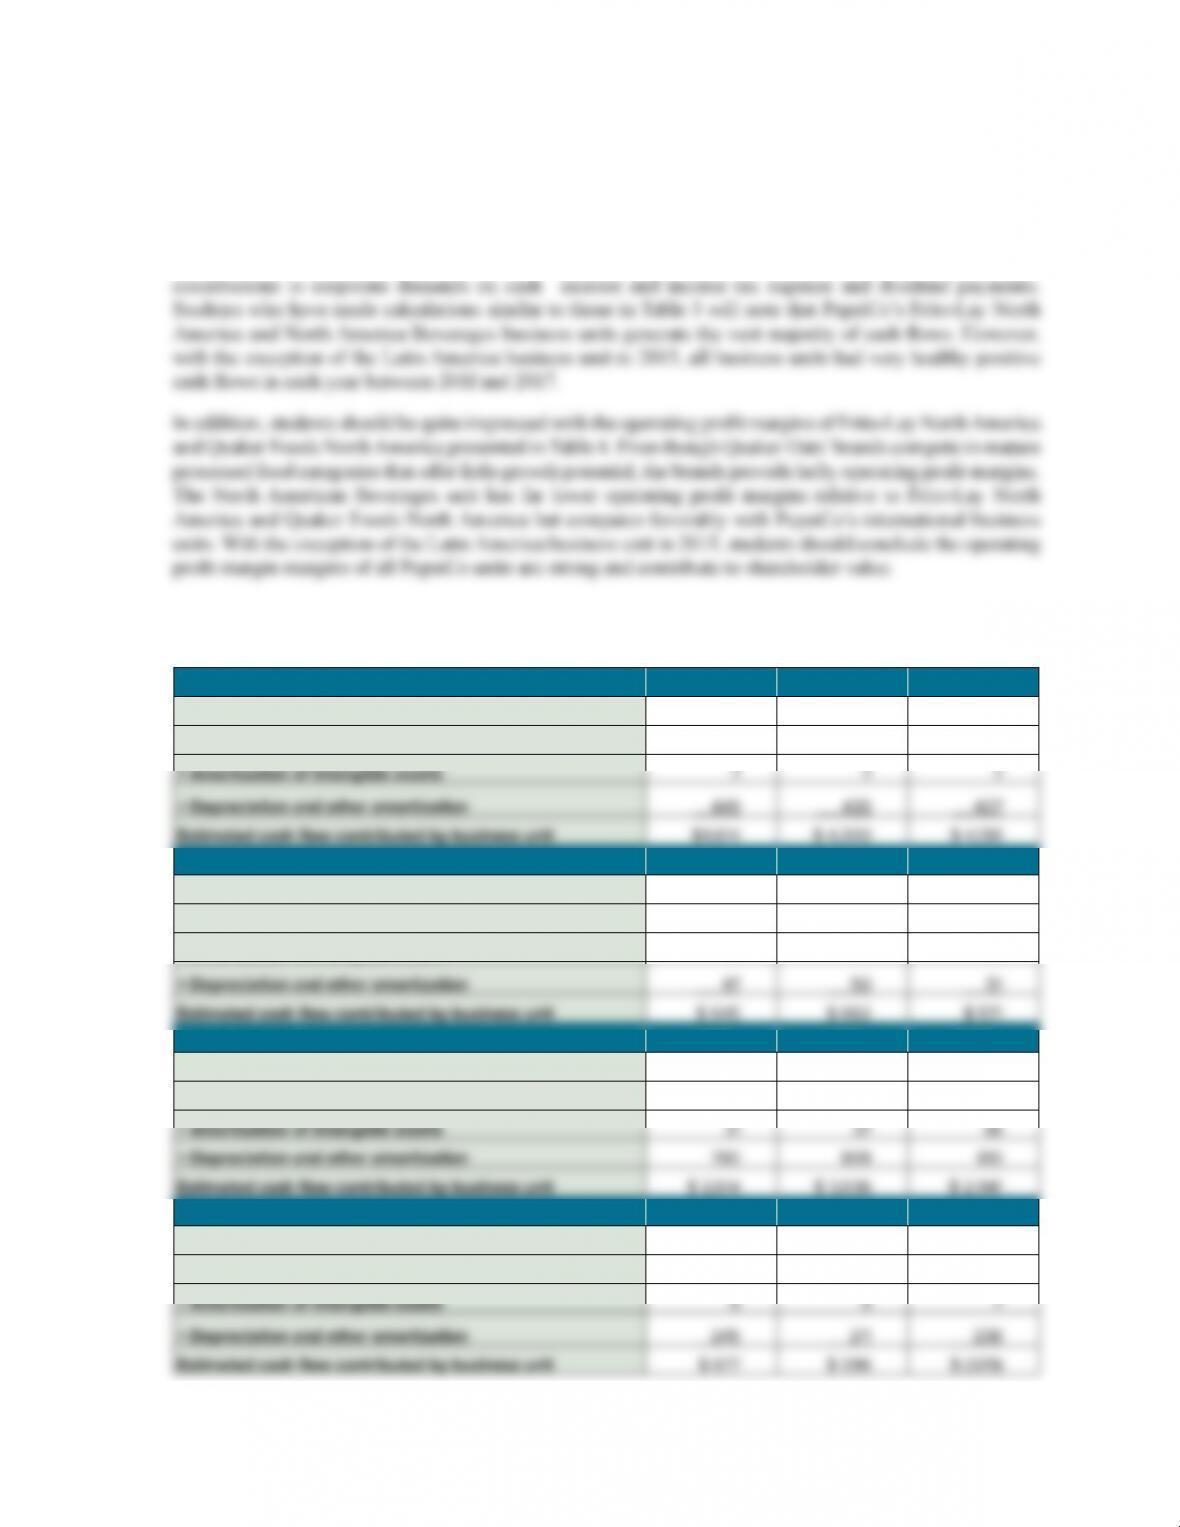
Substantial cost sharing and skills transfer opportunities exist between PepsiCo’s beverage brands and
between its various snack brands, but there appear to be less strategic fit opportunities across business
platforms. The operating processes vary greatly between bottled water and functional beverage bottling, soft
drink concentrate production, grain-based food products production, and snack food production. Students
Case 23 Teaching Note Pepsico’s Diversification Strategy in 2018
578
FIGURE 2. Assessment of Strategic Fit Potentials Between PepsiCo’s Business Units
CS = cost sharing benefits ST = skills transfer opportunities
Value Chain Activities
Business Unit
Pepsi Cola
None None None Cross-selling with Frito-
Lay products/ST with all
ST/CS with all
convenience
Snacks
beverages
Tropicana/
Dole/SoBe
Some potential
cost sharing
with hot fill
beverages
Cost sharing
among hot fill
operations
Cost sharing with
all convenience
beverages/ST with
convenience snacks
ST with all convenience
products
ST/CS with all
convenience
products
Aquafina/
LIFEWTR/
Bubly
None Cost sharing
among hot fill
operations
Cost sharing with
all convenience
beverages/ST with
ST with all convenience
products
ST/CS with all
convenience
products
convenience snacks
Lipton/SoBe
teas
Some potential
cost sharing
with hot fill
beverages
Cost sharing
among hot fill
operations
Cost sharing with
all convenience
beverages/ST with
convenience snacks
ST with all convenience
products
ST/CS with all
convenience
products
Gatorade
Some potential
cost sharing
Cost sharing
among hot fill
Cost sharing with
all convenience
ST with all convenience
products
ST/CS with all
convenience
products
products
Quaker
flavored
grains
None None CS with RTE and hot
cereals and other
breakfast
ST/CS with RTE and hot
cereals, Quaker snacks,
and other breakfast
products
ST/CS with
Quaker
branded
products
Quaker other
None None CS with RTE cereals,
ST/CS with RTE cereals,
ST/CS with
Purchasing Operations Distribution Sales & Marketing Advertising
/Promotion
Case 23 Teaching Note Pepsico’s Diversification Strategy in 2018
579
Does PepsiCo’s portfolio exhibit good resource fit? What are the cash flow characteristics of each of
PepsiCo’six segments? Which businesses are the strongest contributors to PepsiCo’s free cash flows?
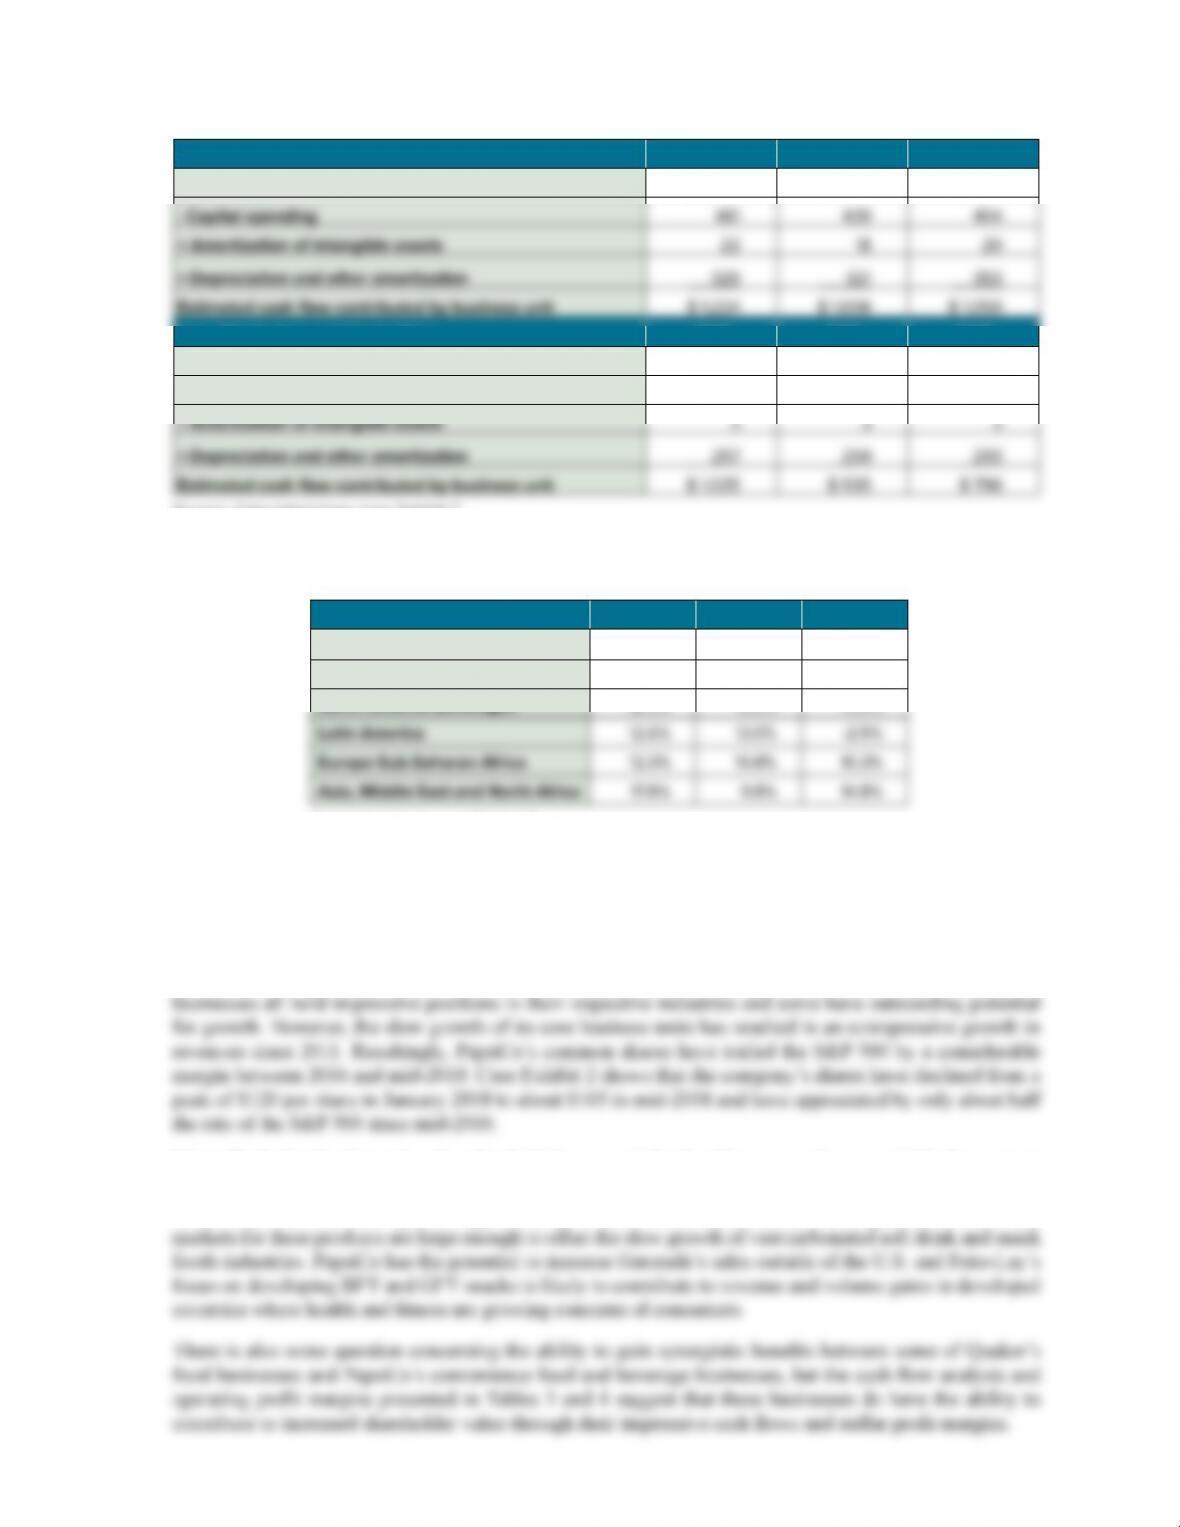
Students who have reviewed case Exhibit 5 should easily recognize that the portfolio has very good resource
fit, with the company’s businesses generating free cash flows of $8.1 billion in 2015, $7.7 billion in 2016,
and $7.2 billion in 2017. Table 3 presents the cash flow estimates of each of the six business units before
TABLE 3. Estimated Cash Flow Before Interest and Income Tax Expense and Dividend Payments
for Pepsico’s Business Units, 2015–2017
Frito-Lay North America
2017 2016 2015
Operating profit $4,823 $ 4,659 $ 4,304
– Capital spending 665 801 608
Quaker Foods North America
2017 2016 2015
Operating profit $ 642 $ 653 $ 560
– Capital spending 44 41 40
+ Amortization of intangible assets — — —
North America Beverages
2017 2016 2015
Operating profit $ 2,707 $ 2,959 $ 2,785
– Capital spending 904 769 695
Latin America
2017 2016 2015
Operating profit $ 908 $ 887 $ (206)
– Capital spending 481 507 368
+ Amortization of intangible assets 5 5 7
+ Depreciation and other amortization 245 211 238
Estimated cash flow contributed by business unit $ 677 $ 596 $ (329)
— Income taxes2 448 82 265
— Capital expenditures 423 38 384
— Dividend payments3 741 136 438
Estimated free cash flow $2,508 376 301
Case 23 Teaching Note Pepsico’s Diversification Strategy in 2018
580
Europe Sub-Saharan Africa
2017 2016 2015
Operating profit $ 1,354 $ 1,108 $ 1,081
Asia, Middle East and North Africa
2017 2016 2015
Operating profit $ 1,073 $ 619 $ 941
– Capital spending 308 381 441
Source: Calculated from case Exhibit 7.
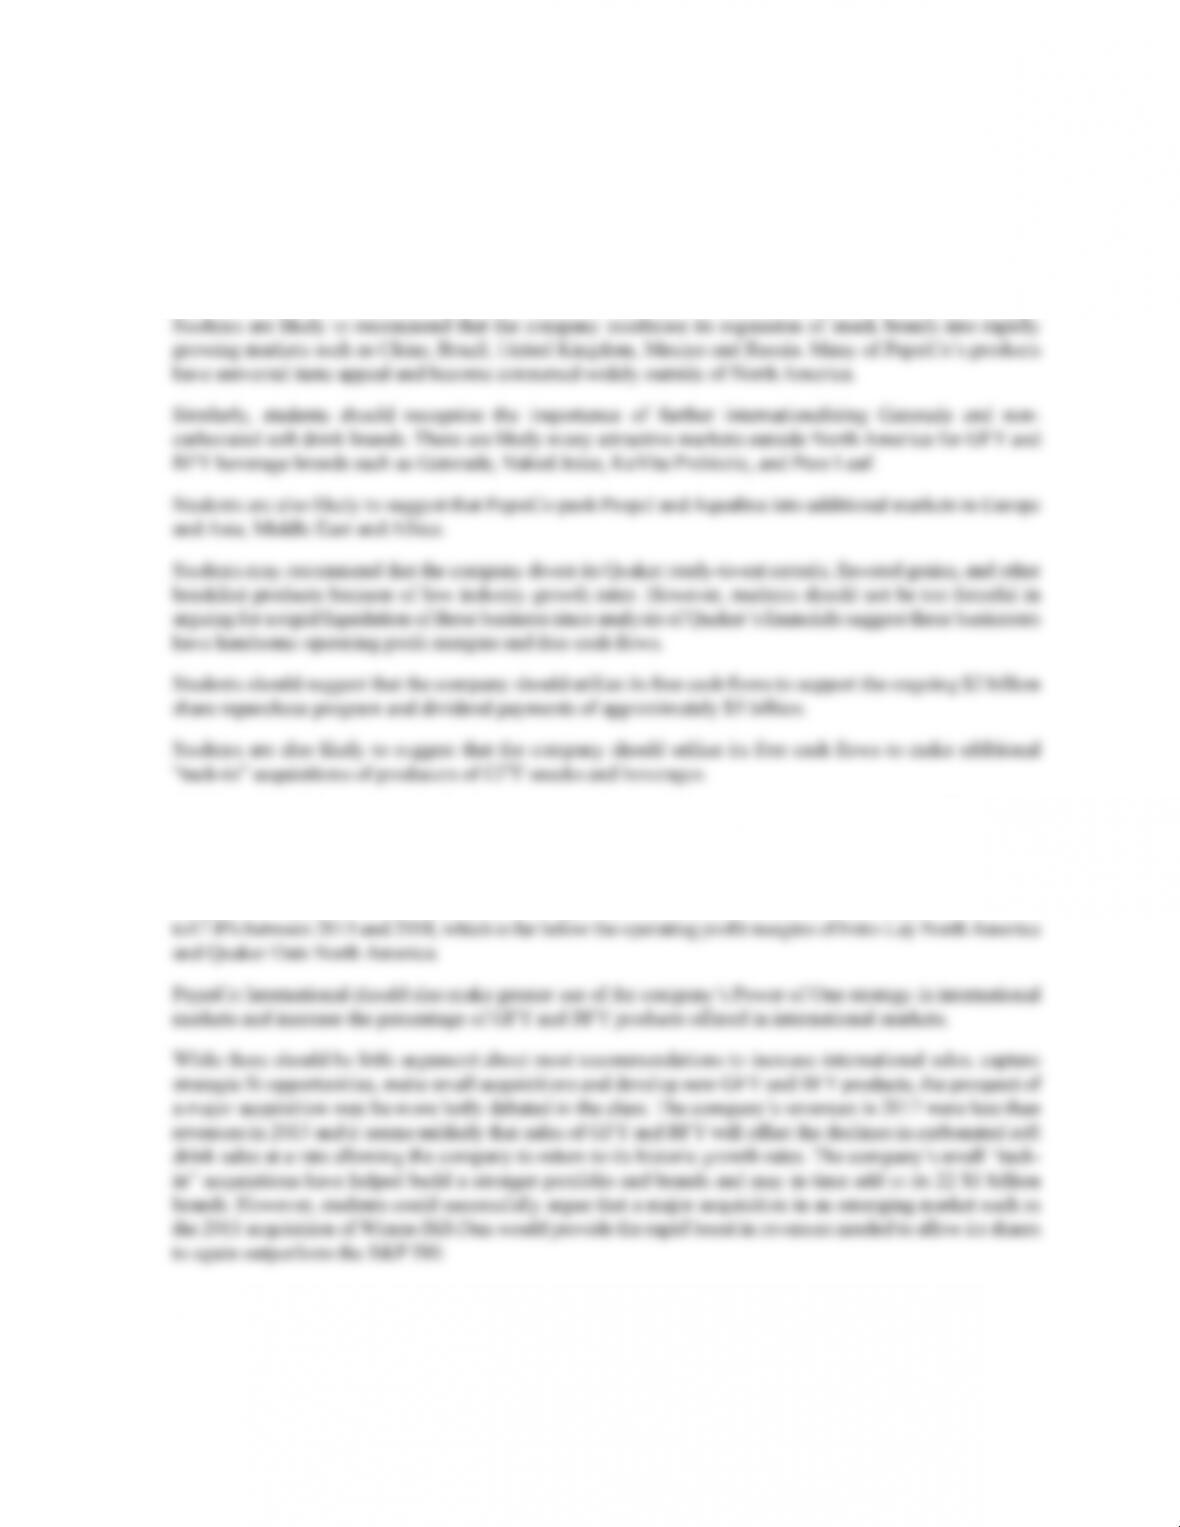
TABLE 4. Operating Profit Margins By Pepsico Business Segment, 2015–2017
2013 2012 2011
Frito-Lay North America 30.5% 30.0% 29.1%
Quaker Foods North America 25.6% 25.5% 22.0%
North America Beverages 12.9% 13.9% 13.5%
Calculated from case Exhibit 7.
Based on the preceding analysis, what is your overall evaluation of PepsiCo’s business portfolio in 2018? Does
the portfolio provide the company’s shareholders with an opportunity for above-average market returns?
Students will likely commend PepsiCo’s chief managers for building a collection of food and beverage brands
capable providing shareholders with the opportunity for above-average market returns. The company’s
It is unlikely that the domestic sales of soft drinks or snack foods will grow much more quickly than current
annual growth rates, but Gatorade, Propel, Aquafina, LIFEWTR, Stacy’s Chips, KeVita, Bubly Sparkling
Water, and Pure Leaf offer growth opportunities in North America. Students should question whether the
Case 23 Teaching Note Pepsico’s Diversification Strategy in 2018
581
What strategic actions should PepsiCo management take to improve the corporation’s financial and market
performance? Should its free cash flows be used to fund additional share repurchase plans, pay higher
dividends, make acquisitions, expand internationally, or for other purposes? What other strategic actions
should be pursued by corporate level management?
Students may struggle with what moves are needed next at PepsiCo, but should be able to recommend most
of the following:
Students will likely recommend that the company continue to develop BFY and GFY snacks and beverages.
Students should also recommend that PepsiCo pursue more aggressive efforts to execute its Performance
with Purpose plan within its North American Beverages and international divisions. The operating profit
margins of PepsiCo’s North American Beverages and international divisions have ranged from -2.5%
Epilogue
You can check for the company’s latest financial reports and press releases at its investor web site (www.pepsico.
com).