21
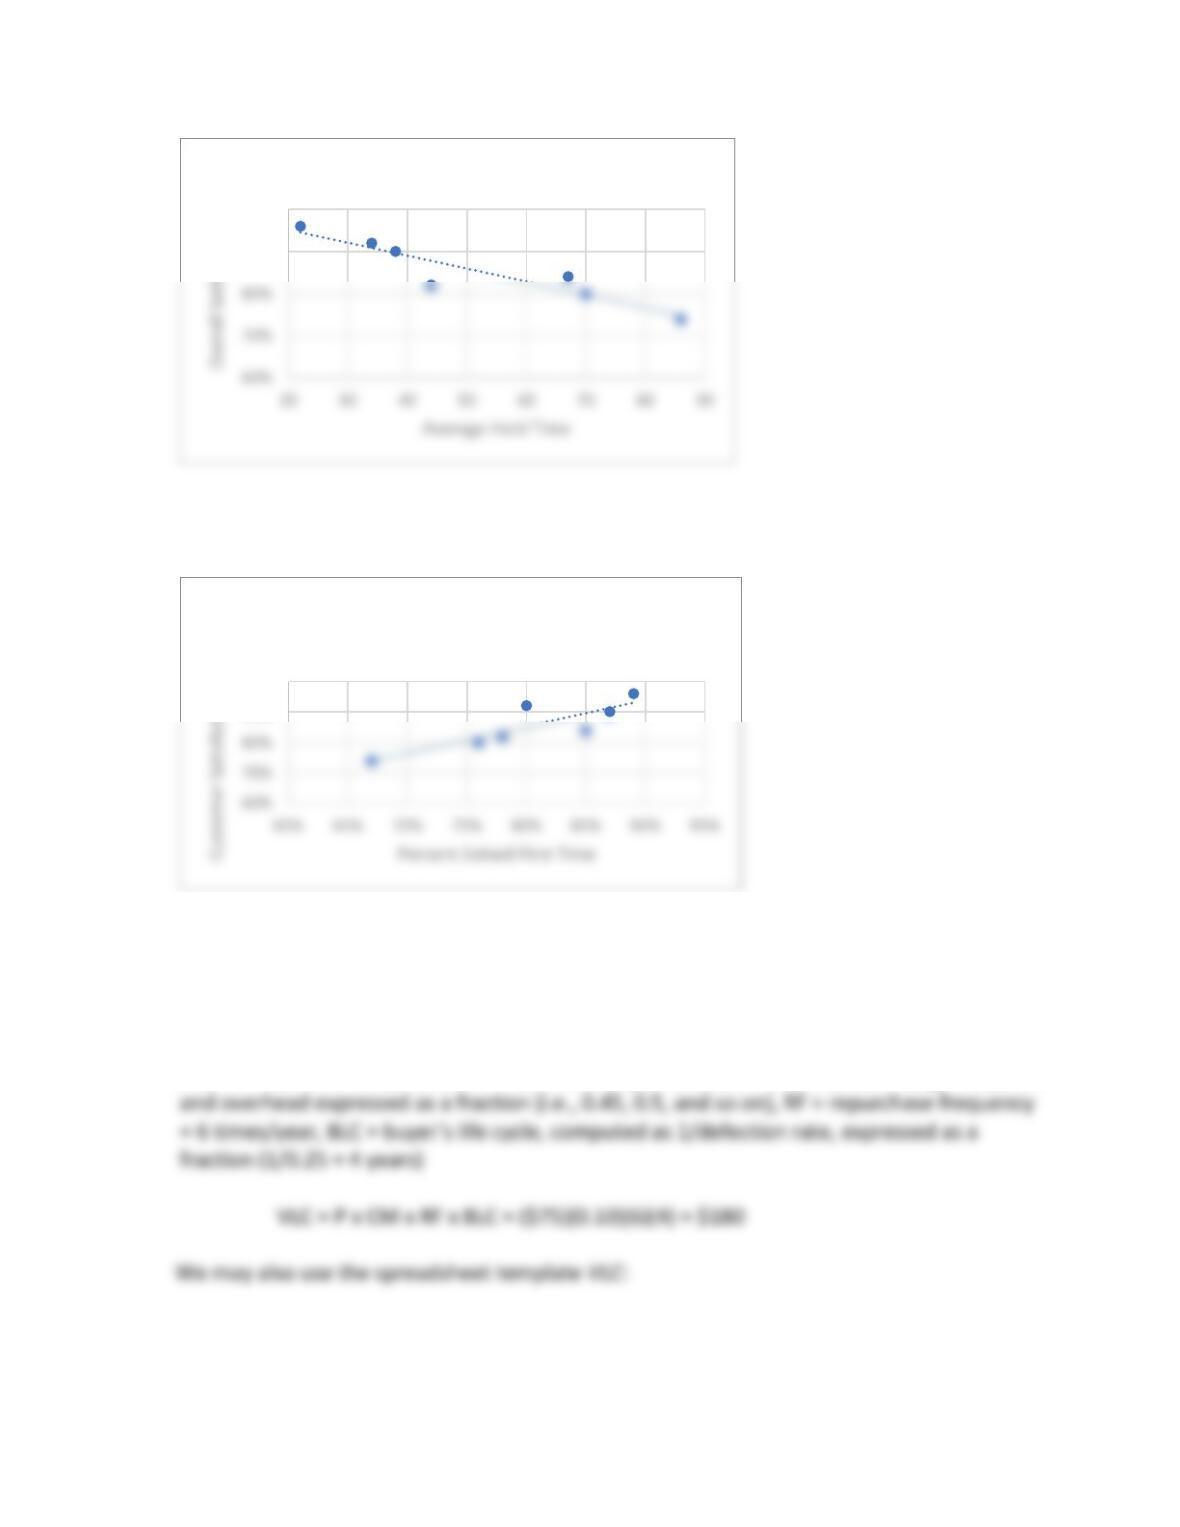
There also appears to be a positive relationship between Percent Solved the First Time and
Customer Satisfaction.
46. Use the Excel template VLC to find the average value of a loyal customer (VLC) in a target
market segment if the average purchase price is $75 per visit, the frequency of repurchase
is six times per year, the contribution margin is 10 percent, and the average customer
defection rate is 25 percent?
VLC = P x CM x RF x BLC, where P = the revenue per unit, CM = contribution margin to profit
90%
100%
Customer Satisfaction vs Hold TIme
100%
Customer Satisfaction vs Percent Solved
First TIme
22
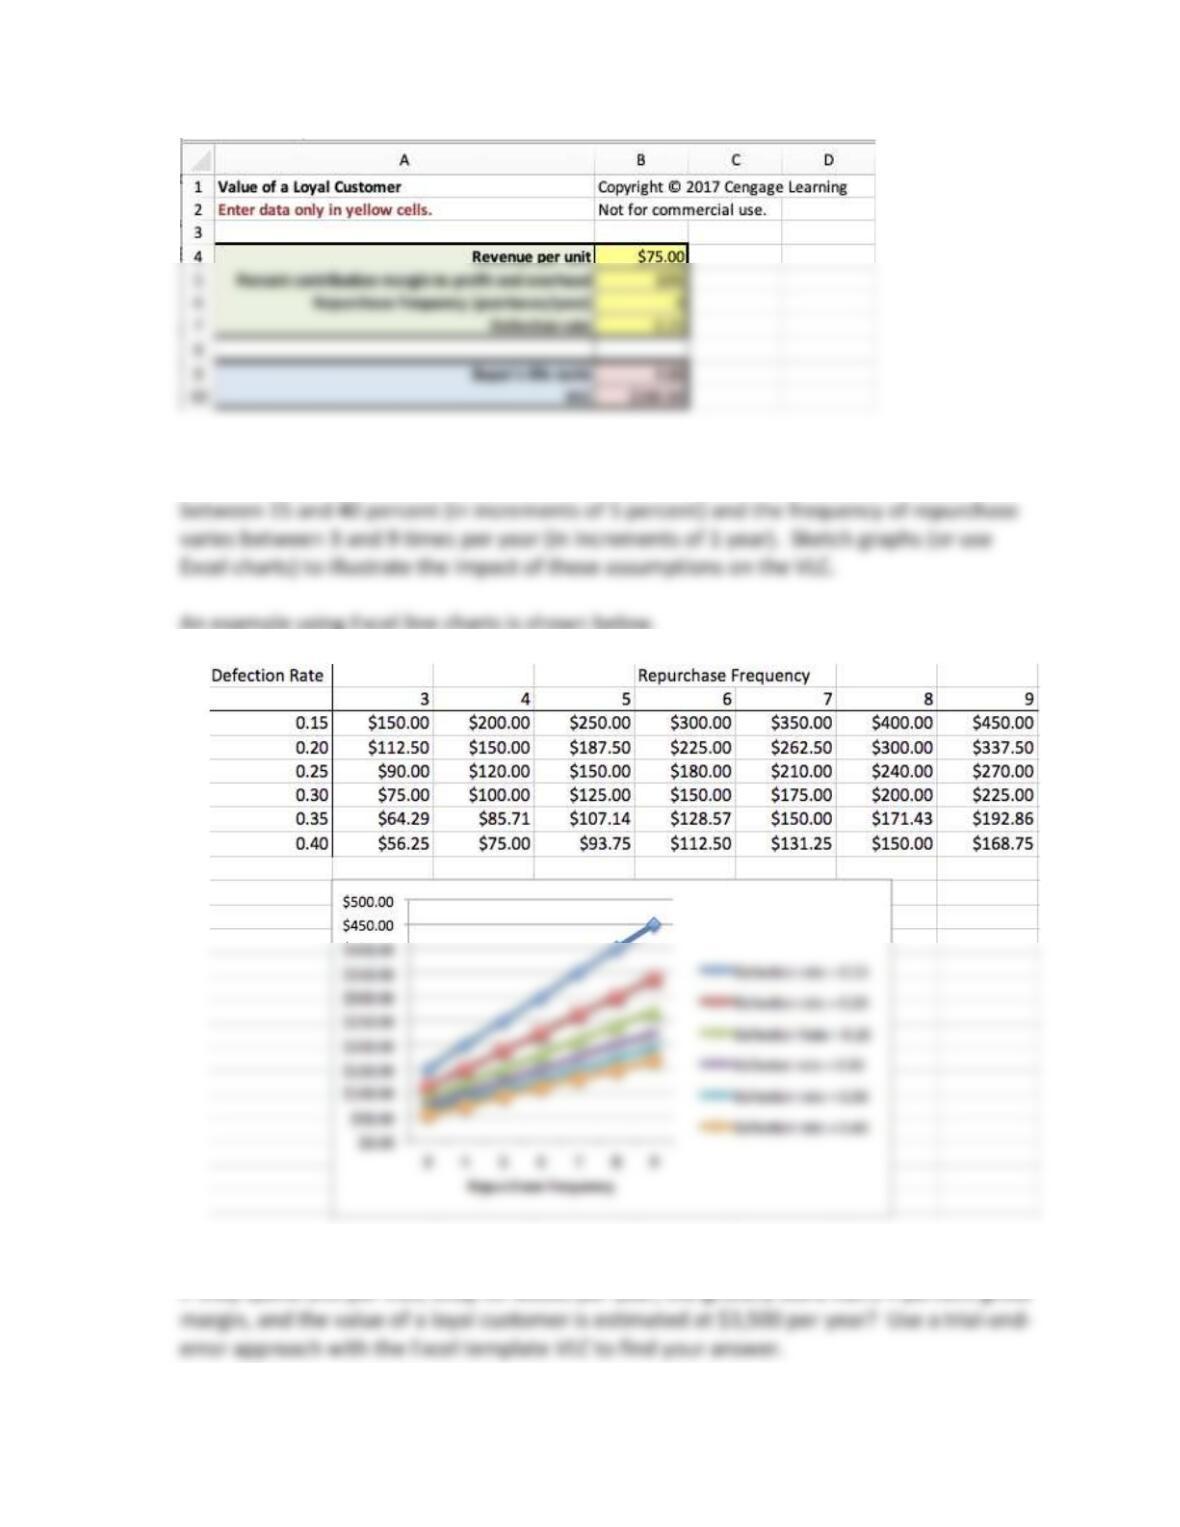
47. Using the base case data in question 46, use the Excel template VLC to analyze how the
value of a loyal customer (VLC) will change if the average customer defection rate varies
48. What is the average defection rate for grocery store shoppers in a local area of a large city
23
DR = 0.0267 (The average customer defection rate is 2.7%.)
The VLC spreadsheet template may be used using a trial and error approach. A more
accurate approach is to use Excel’s Goal Seek tool; however, students may not be familiar
49. What is a grocery store’s contribution margin (CM) if the average purchase price is $86.55
per visit, the customer defection rate is 0.10, the VLC is $1,800, and 52 purchases are made
per year? Use a trial-and-error approach with the Excel template VLC to find your answer.
VLC = P x CM x RF x BLC = ($86.55)(CM)(0.52)(10) = $1,800
24
50. Use the Excel template VLC to estimate the value of a loyal customer for a loyal Craftsman
tool buyer? Assume the contribution margin is 0.25, the purchase price is $300 for a
certain set of tools, and the repurchase frequency is every 5 years, and the customer
defection rate is 10 percent. If the target market segment for this tool set is one million
customers and this firm has a 27 percent market share, what is the VLC for this firm’s
target market.
VLC = P x CM x RF x BLC = ($300)(0.25)(0.2)(10) = $150
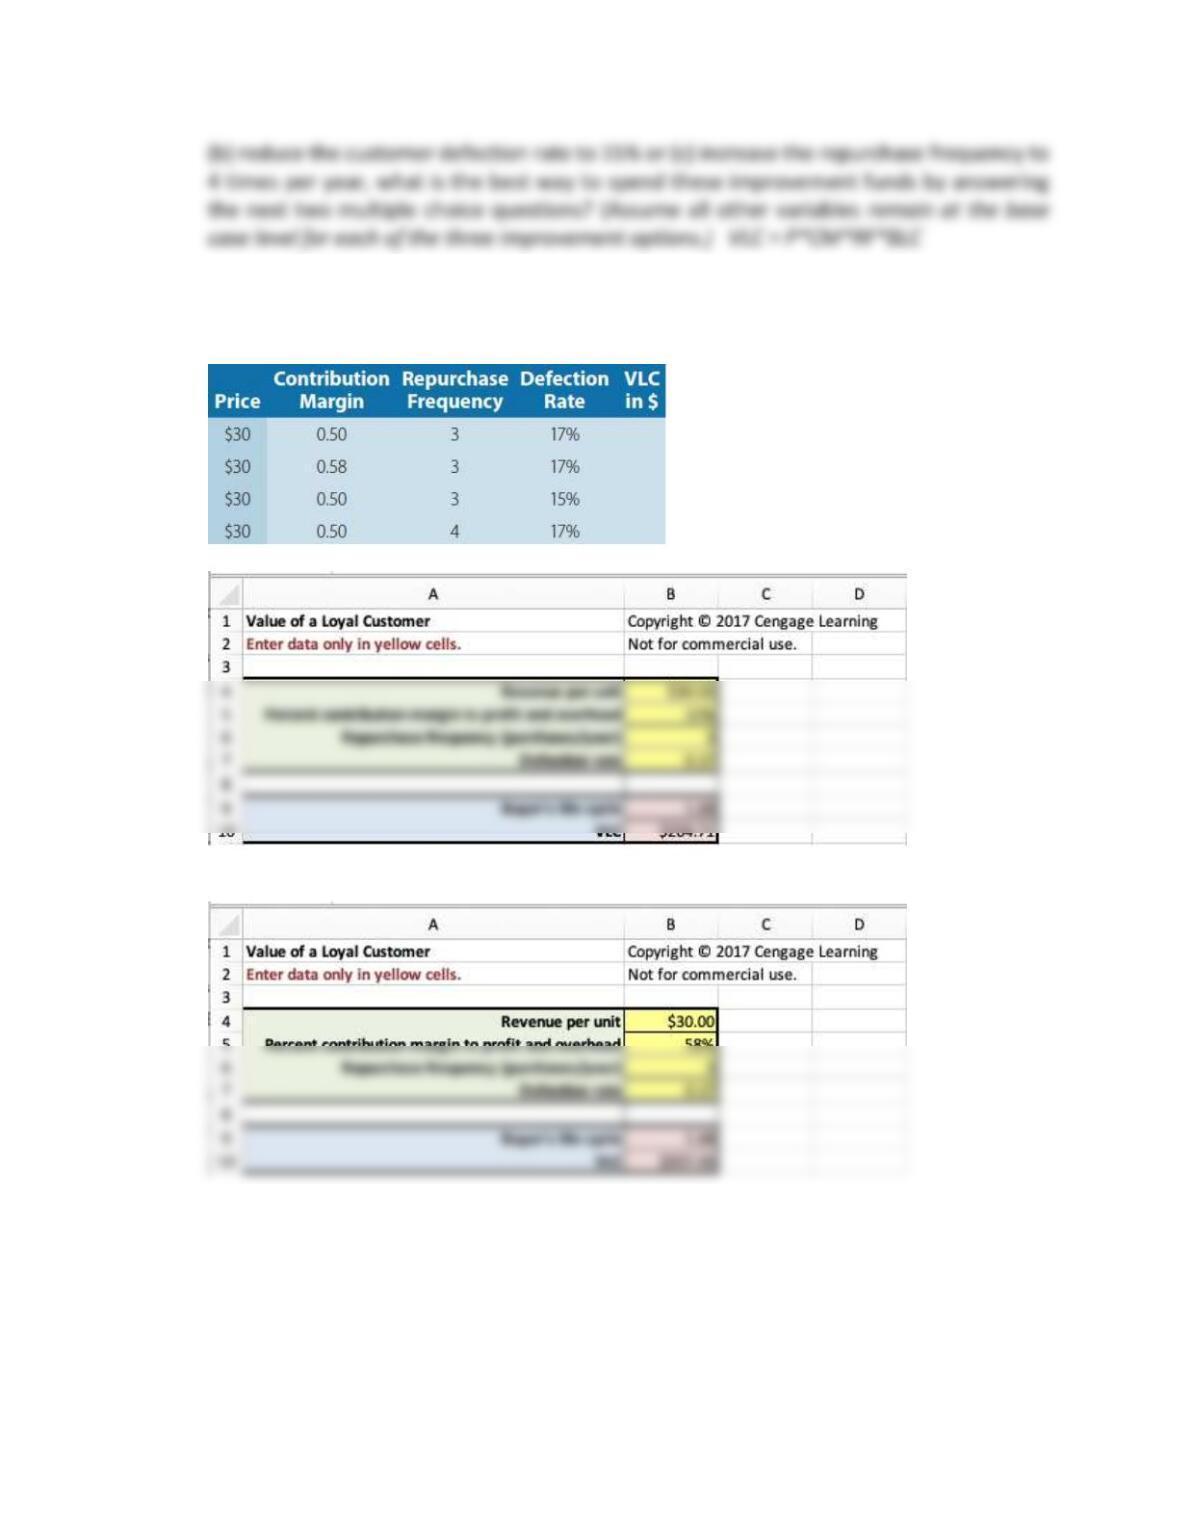
51. A retail store sells a popular cosmetic called Devine and the store manager was given
$100,000 by the corporate office to improve store performance any way she thinks best.
25
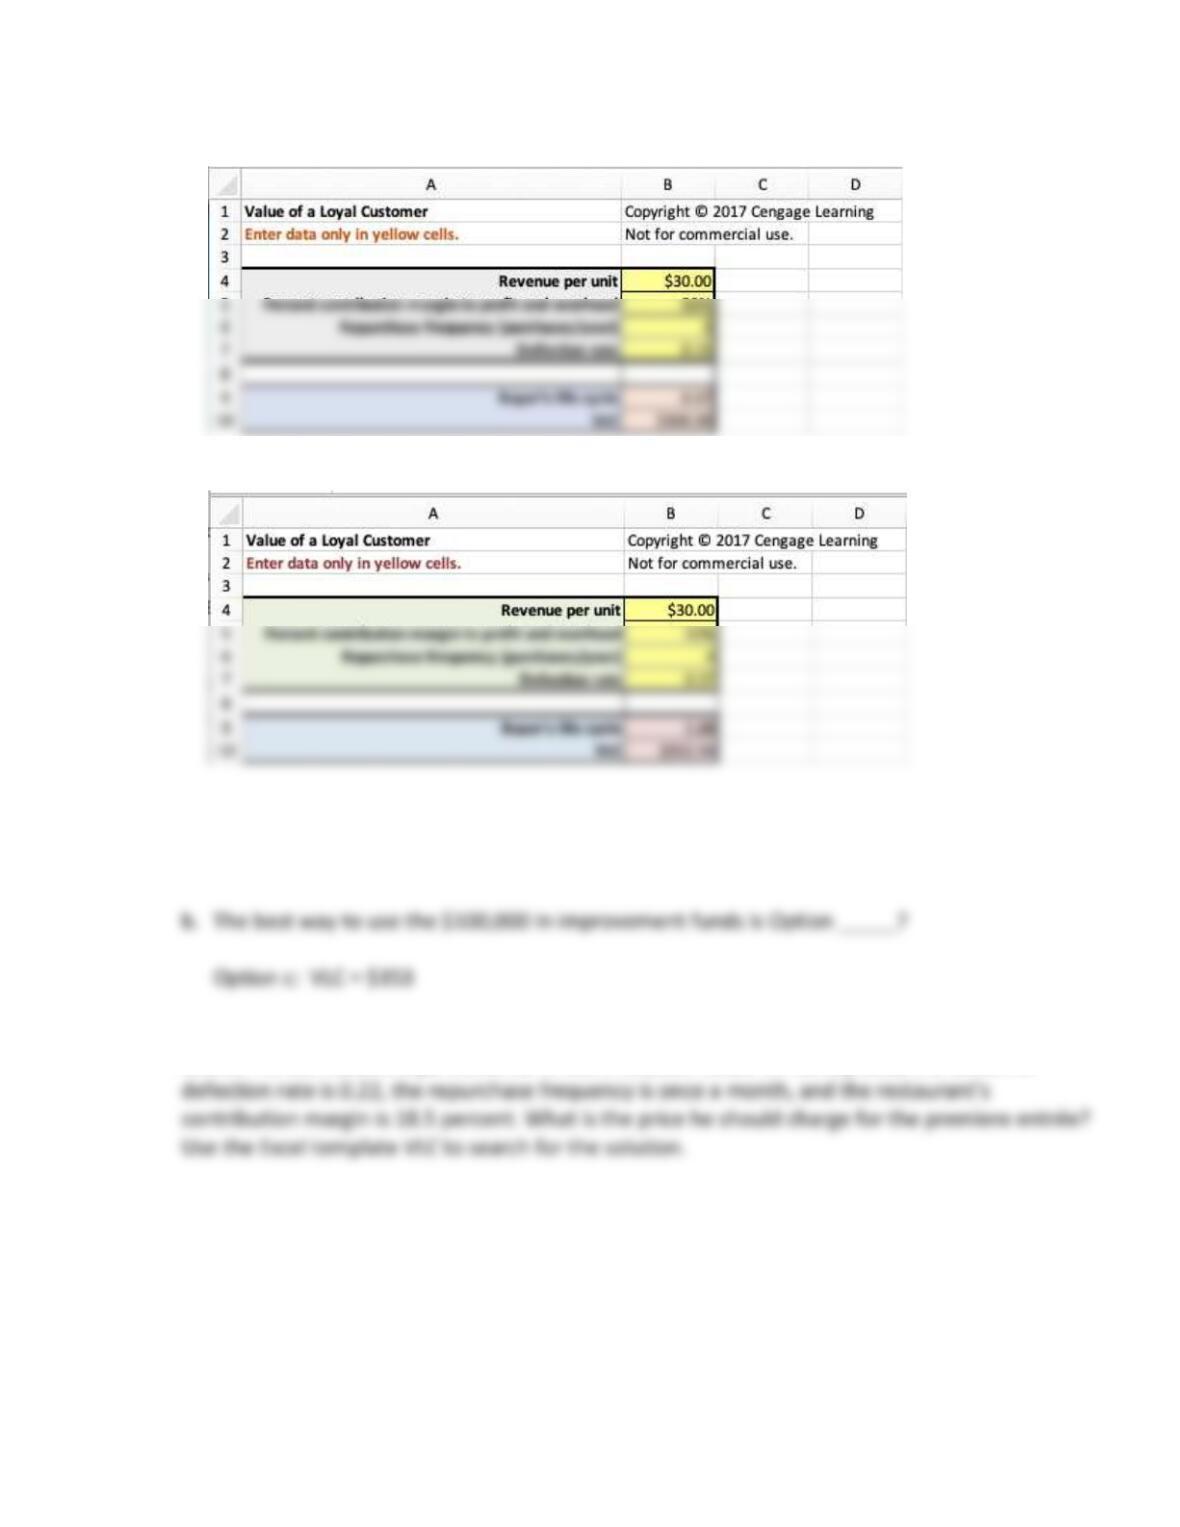
Use the Excel template VLC to answer these questions and summarize your answers using the
table below.
Option (a)
26
Option (b)
Option (c)
a. The value of a loyal customer (VLC) for improvement option (a) is _____?
BLC = 1/0.17 = 6.67 years; VLC = $307
52. The manager at Raphael’s Four-Star Italian Restaurant wants to set the price of their premiere
entrée. He estimates a loyal customer is worth $1,000. Based on survey data, the customer
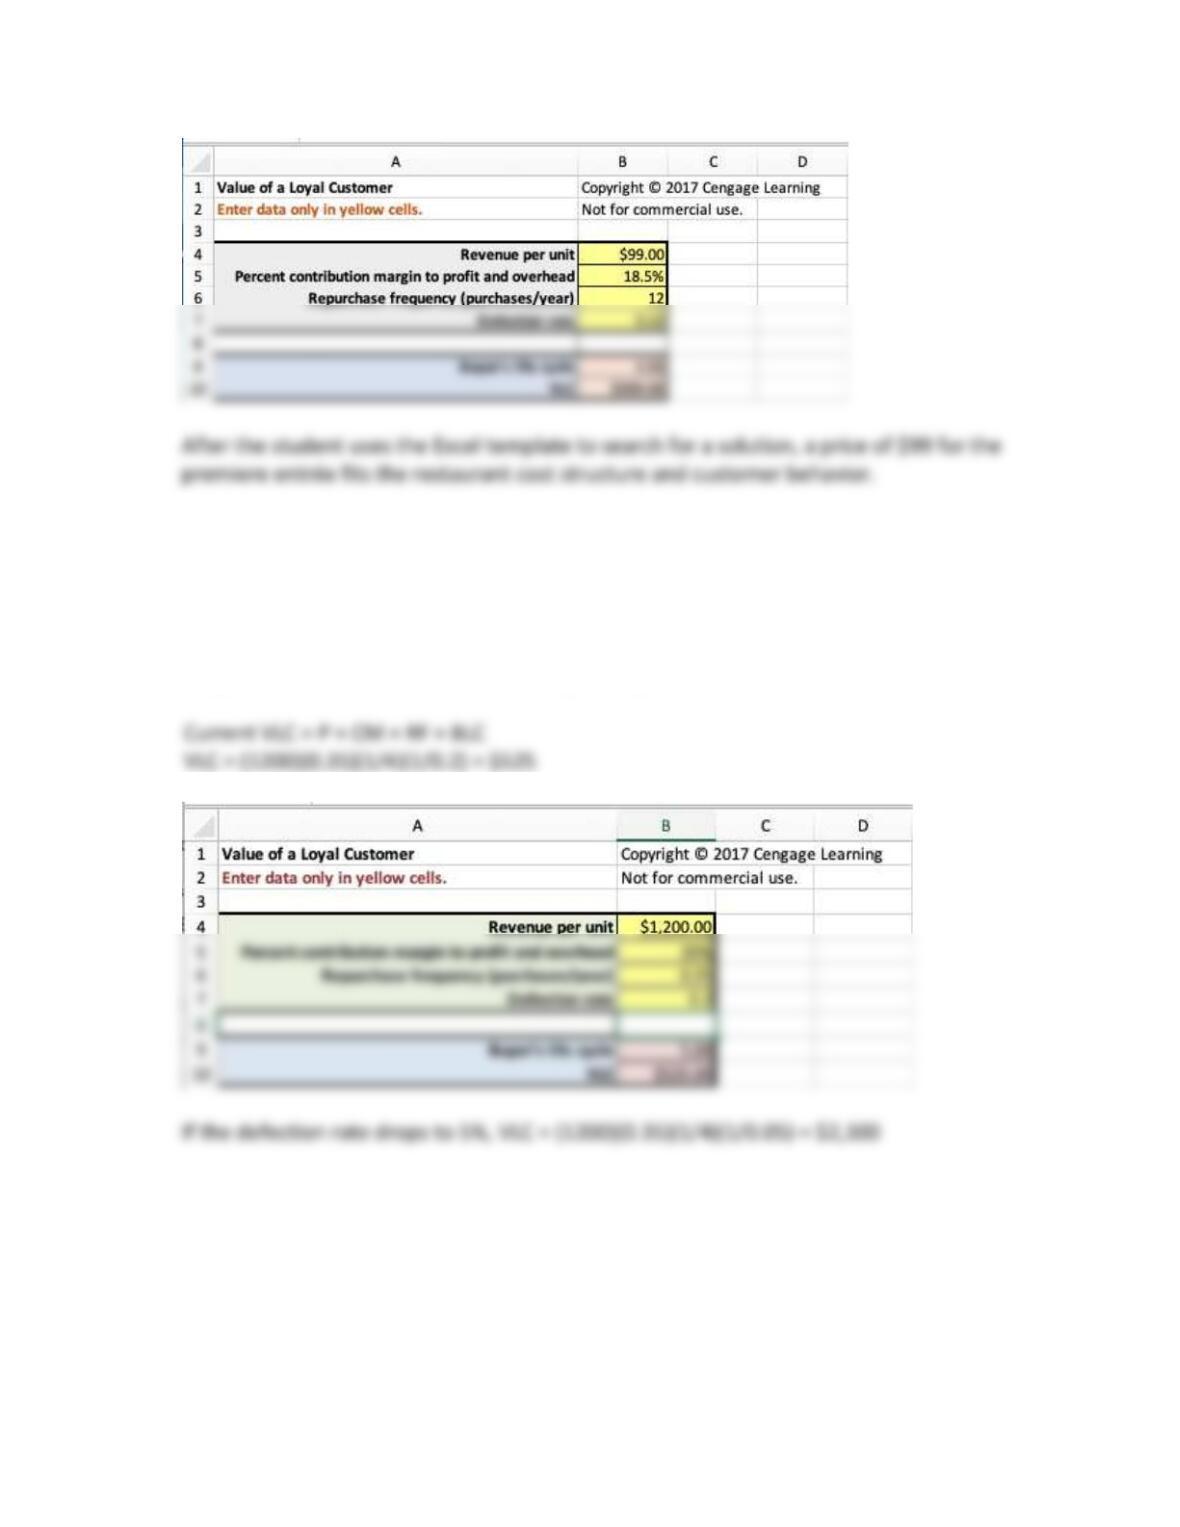
27
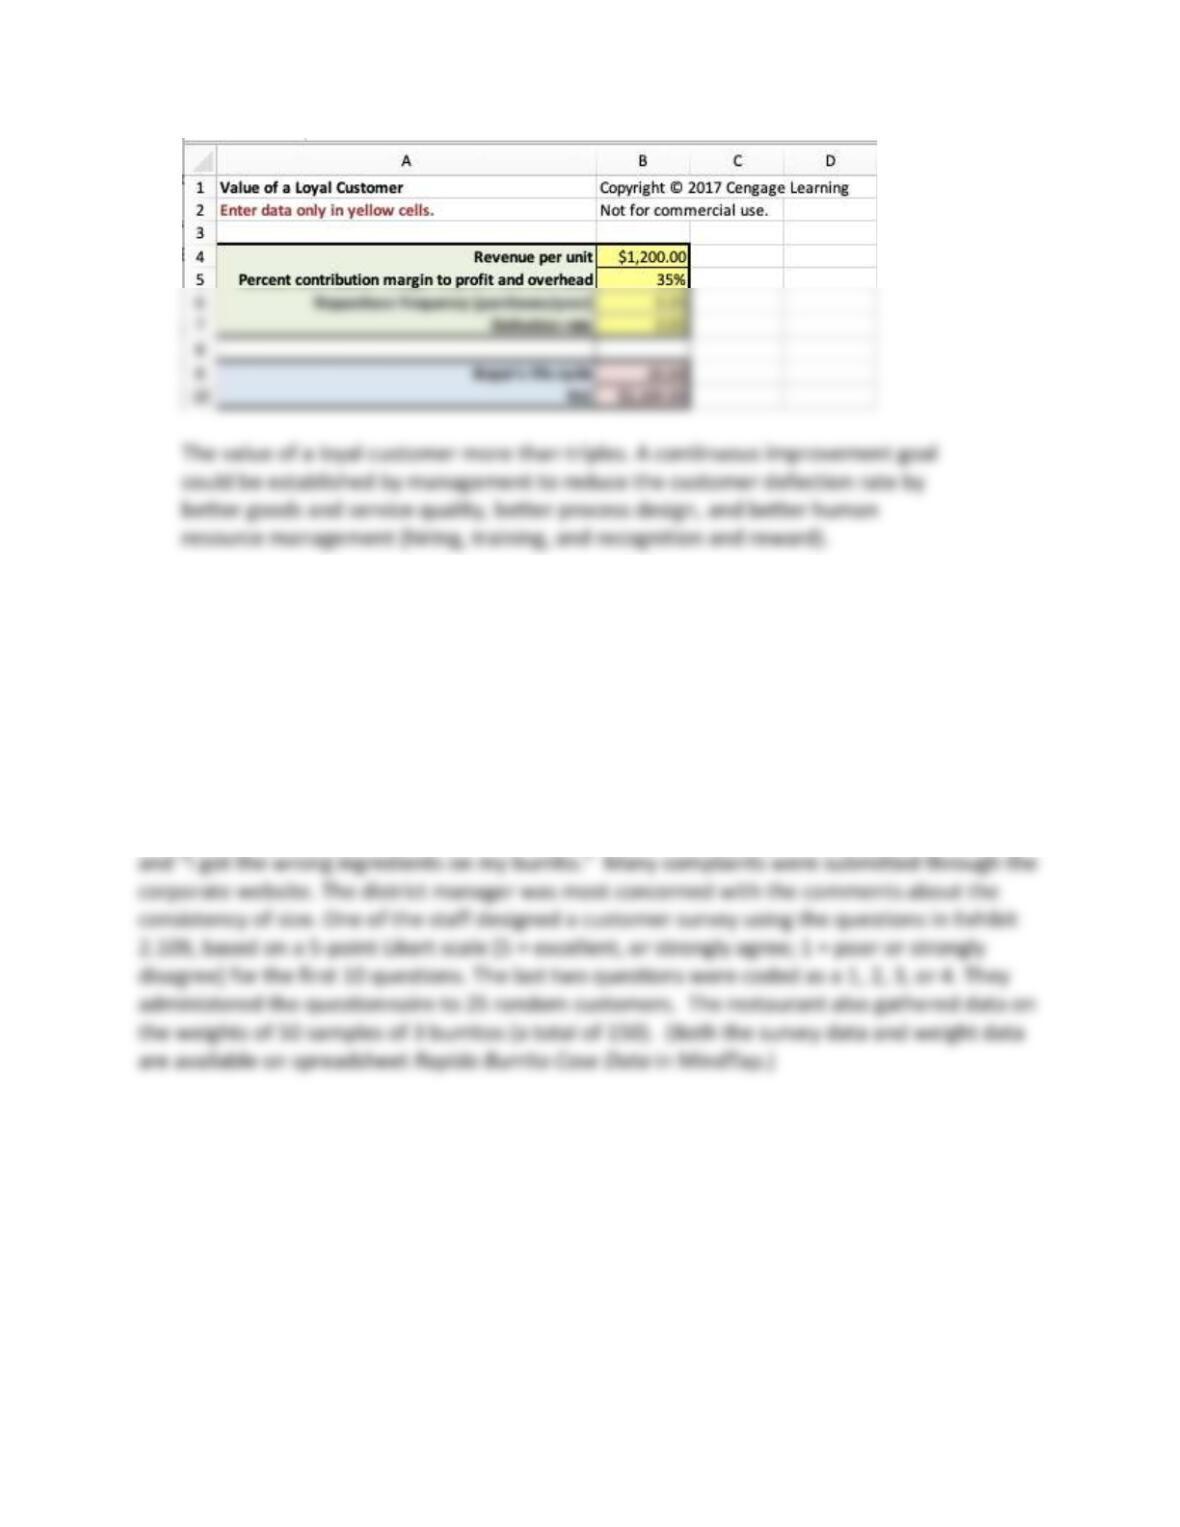
53. A computer manufacturer currently has a 20 percent customer defection rate. Their accounting
department estimates the incremental contribution to profit and overhead as 35 percent.
Customers purchase computers every four years at an average cost of $1,200.00. In an effort to
reduce the defection rate, the company is improving both the quality of its computers and its
post-sale service. Use the Excel template VLC to determine the increase in the average value of
a loyal customer if the defection rate drops to 5 percent.
28
Teaching Note: Rapido Burrito
Overview
Rapido Burrito is a small regional chain of quick service restaurants. Rather than wait in a
cafeteria style line, customers check boxes for their choice of ingredients, sauce, and so on
paper menus at their table. The food is prepared quickly and then delivered to the tables.
Lately, one of the store managers has been hearing customer complaints, such as: “The tortillas
are too thin”; “The food is not hot”; “Every time I get a burrito it seems to be a different size”;
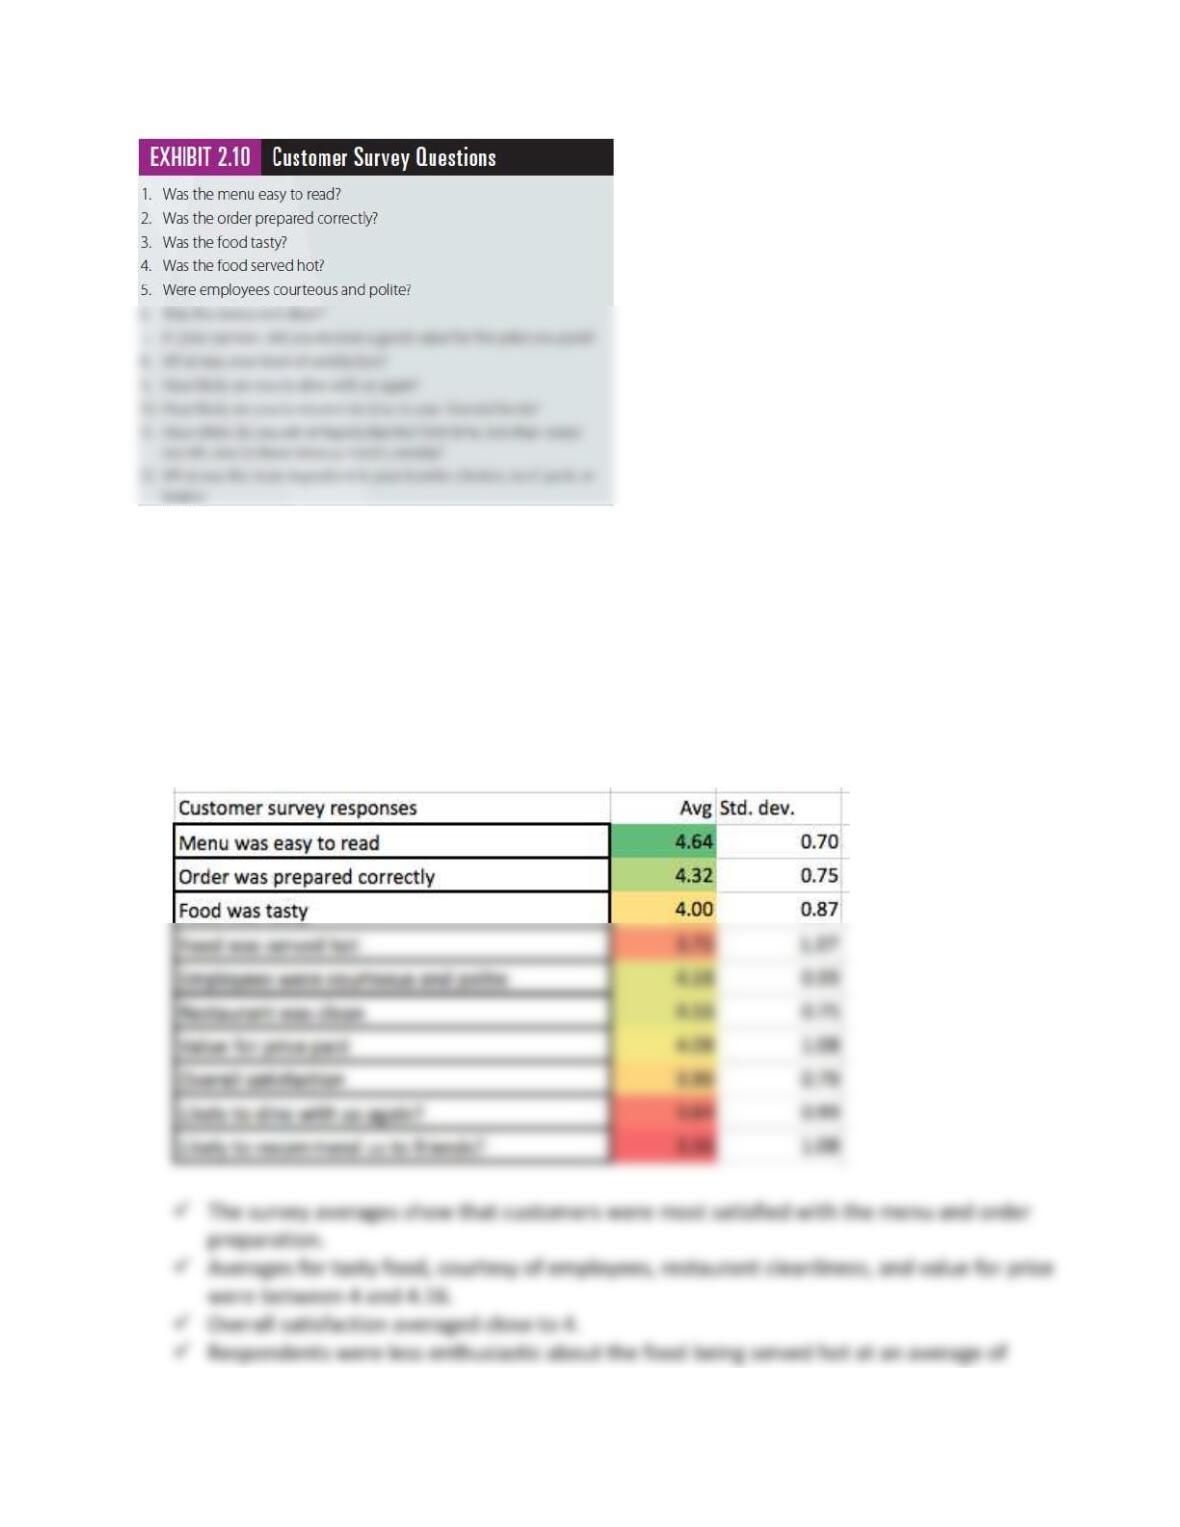
29
Case Questions for Discussion:
1. What conclusions do you reach when you calculate descriptive statistics for the answers
to each of the survey questions in the database?
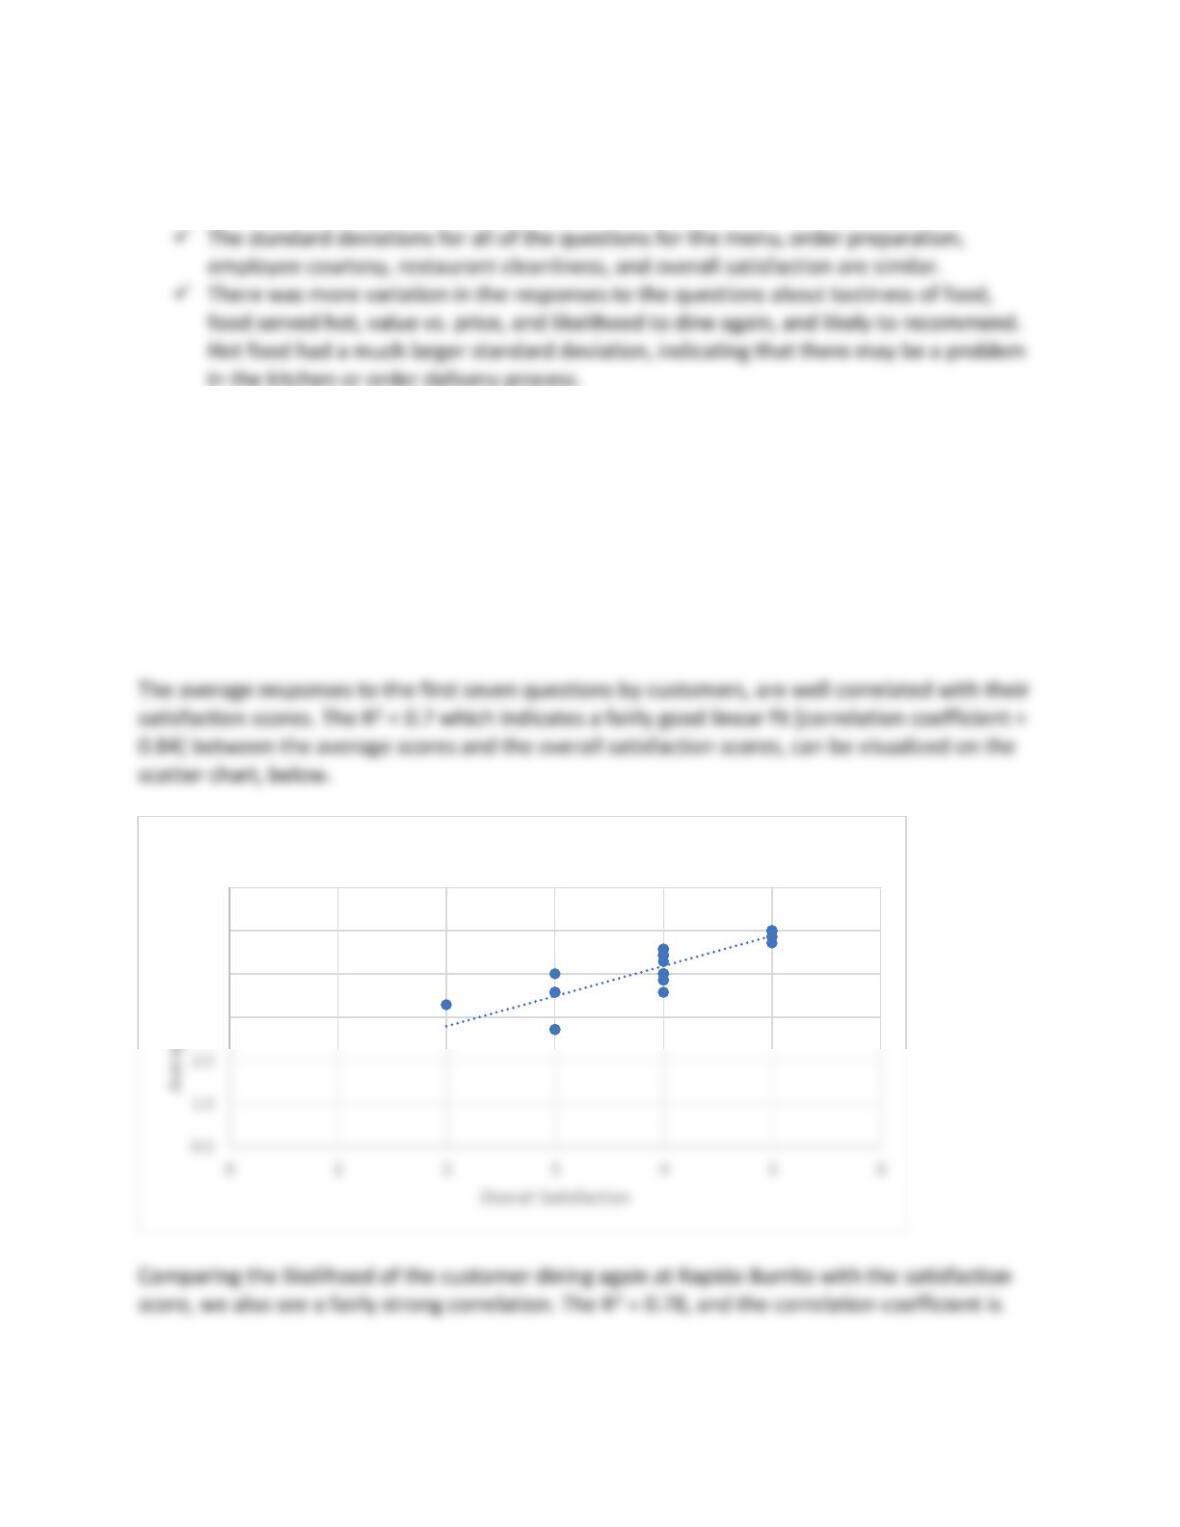
Portions of the spreadsheet Rapido Burrito Case Soln.xlsx are shown below. A frequency count
of the 25 customers who were surveyed is evenly divided, from first timers to those who eat
there weekly.
30
3.72.
✓ The average likelihood of the customer dining again is only 3.64; likely to recommend is
a bit lower at 3.65.
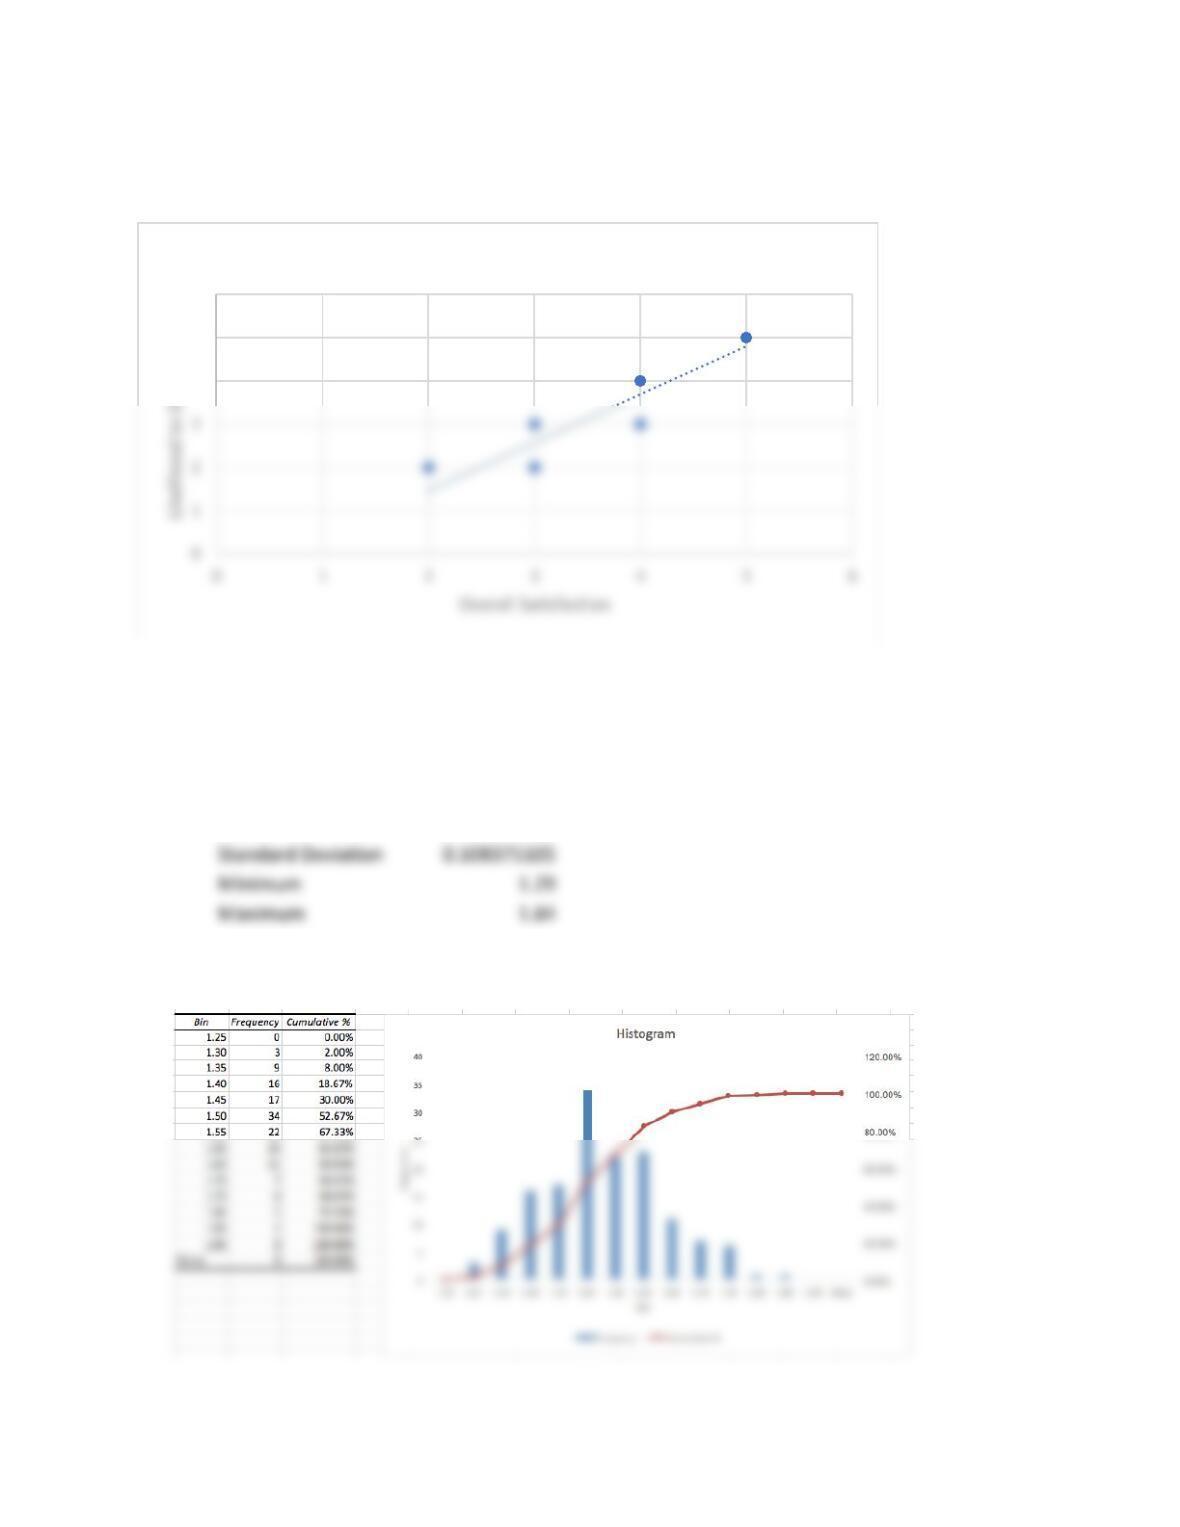
2. If you average the responses to the first seven questions by customer, how closely are
those averages correlated to the satisfaction score? Include a scatter chart in your
analysis.
The first chart is overall satisfaction versus the average score on the first seven survey
questions. The second graph is the survey question scores (a) likely to dine with us again versus
(b) the overall satisfaction score. The second graph is for your information only and was not
asked in the case assignment questions.
R² = 0.7002
3.0
4.0
5.0
6.0
Overall Satisfaction vs Average Scores on Items 1-7
31
0.88 as shown below. The lower the overall satisfaction, the customer will be less likely to dine
again.
3. Analyze the data on burrito weights using descriptive statistical measures such as the
mean and standard deviation, and tools such as a frequency distribution and histogram.
What do your results tell you about the consistency of the food servings?
For all samples, descriptive statistics are
Mean
1.51
Standard Deviation
Minimum
1.29
Maximum
1.84
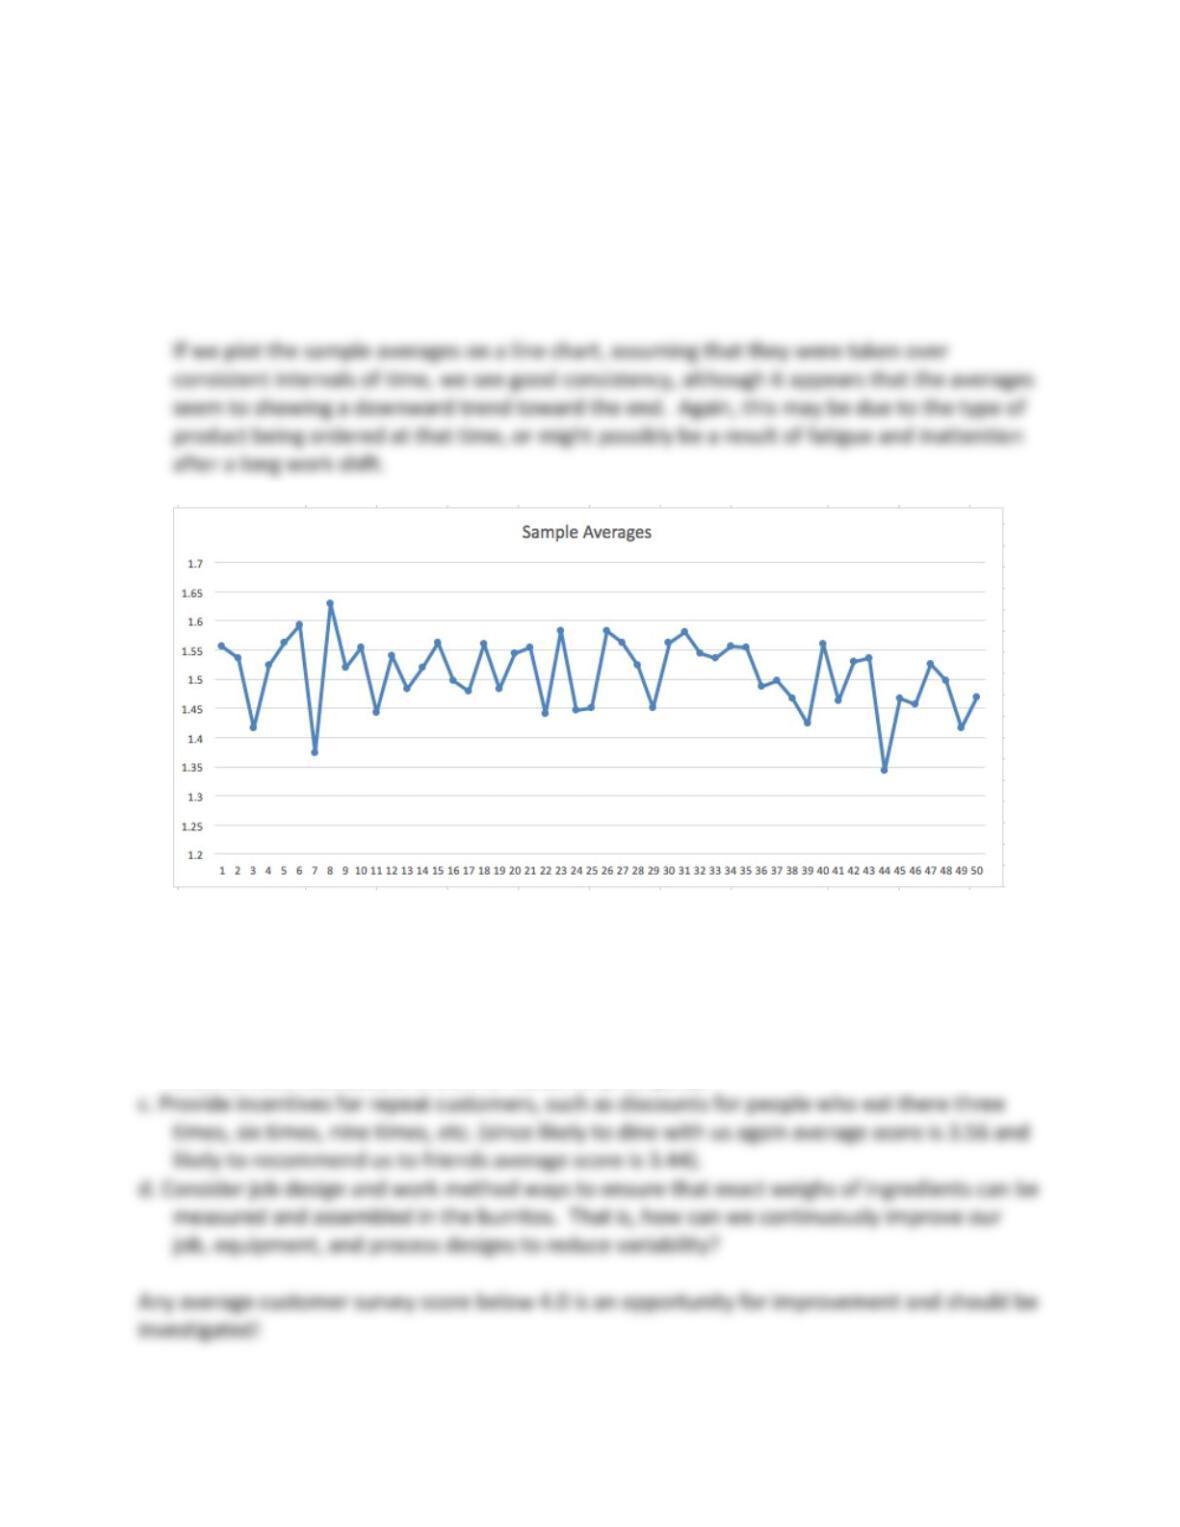
A frequency distribution and histogram are shown below:
R² = 0.779
4
5
6
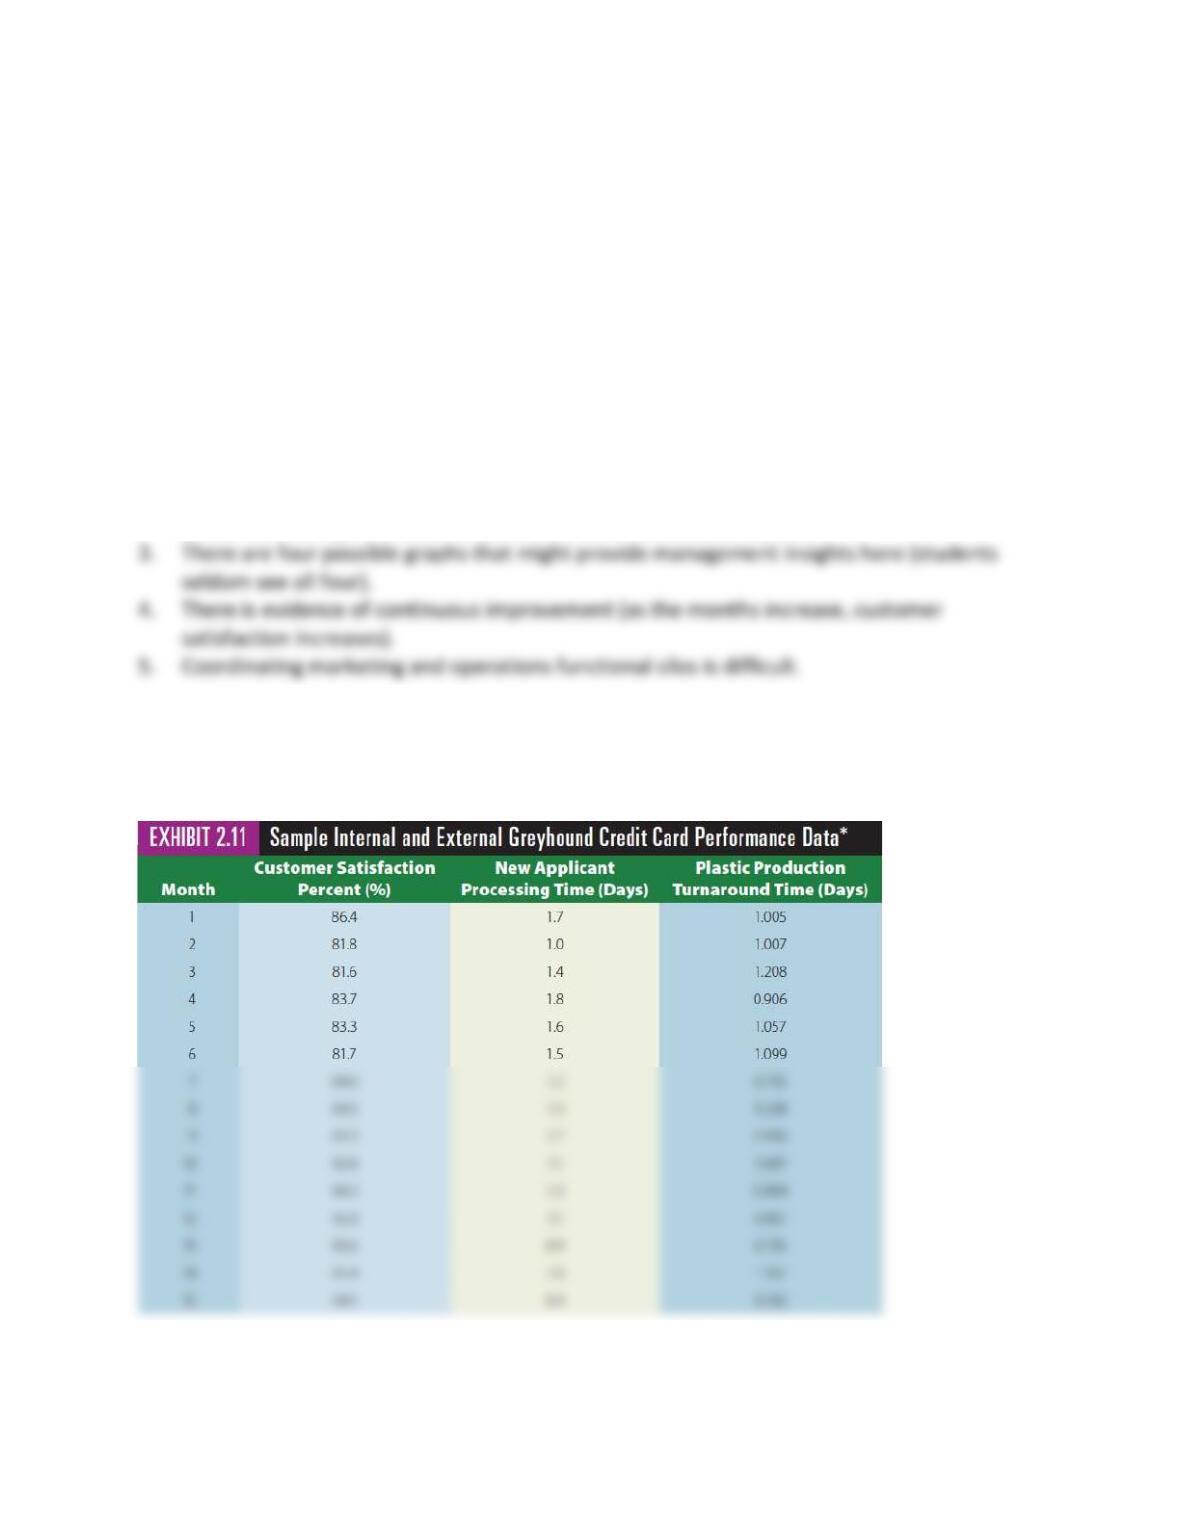
Likelihood to Dine Again vs Overall Satisfaction
32
The frequency distribution and histogram show that the sample is generally symmetric
around the mean and somewhat normal in shape. The burrito weights vary from 1.29 lbs.
to 1.84 lbs. This could be due to the nature of the burrito product, where the customer
specifies ingredients, which add more or less weight to the burrito. More data would be
needed to understand this.
4. What recommendations for decision making and improvement can you make to the store
manager?
a. Work to ensure that food is served hot (low average score of 3.60)
b. Develop a panel to do taste testing of various existing and new products (average scores are
3.84 for food was tasty and 3.92 for value for price paid).
33
Teaching Note: Greyhound Bank: Credit Card Division
Overview
The case confronts the student with four variables that may or may not be related. Using only
charts and basic statistics, the student is introduced to the ideal of internal and external
performance metrics and their importance for management decision making. Key lessons
learned from this case study are as follows, and the instructor should summarize these at the
end of the case discussion.
1. Business analytics searches for performance relationships that help managers make
internal and external decisions. In this case, does internal performance drive external
performance?
2. Ideally, internal and external performance should be related but in the real world there are
many intervening variables not accounted for in our data analysis.
The case assignment asks only for basic statistics such as the mean, standard deviation, and
three or four charts. If your students can do correlations and regressions then add this
requirement to the assignment if you want.
34
Case Questions for Discussion:
1. What are the major problems facing the credit card division?
• A possible mismatch between internal operations-focused performance measures and
external customer-focused satisfaction scores.
• Quality of information is dependent on other players in financial value chain (other
domestic and international banks, U.S. federal reserve, airborne couriers, UPS, etc.) and
BankUSA does not have control over them.
2. What steps are required to develop a good internal and external performance and
information system?
Good operational planning, design, and management are keys to developing good internal
performance systems, and require all of the topics in this textbook. Where some organizations
• Ensure top-level management support and champions.
• Clearly define job and process designs and workflows.
Some clever students use the MBNQA or Service-Profit-Chain frameworks to define these steps.
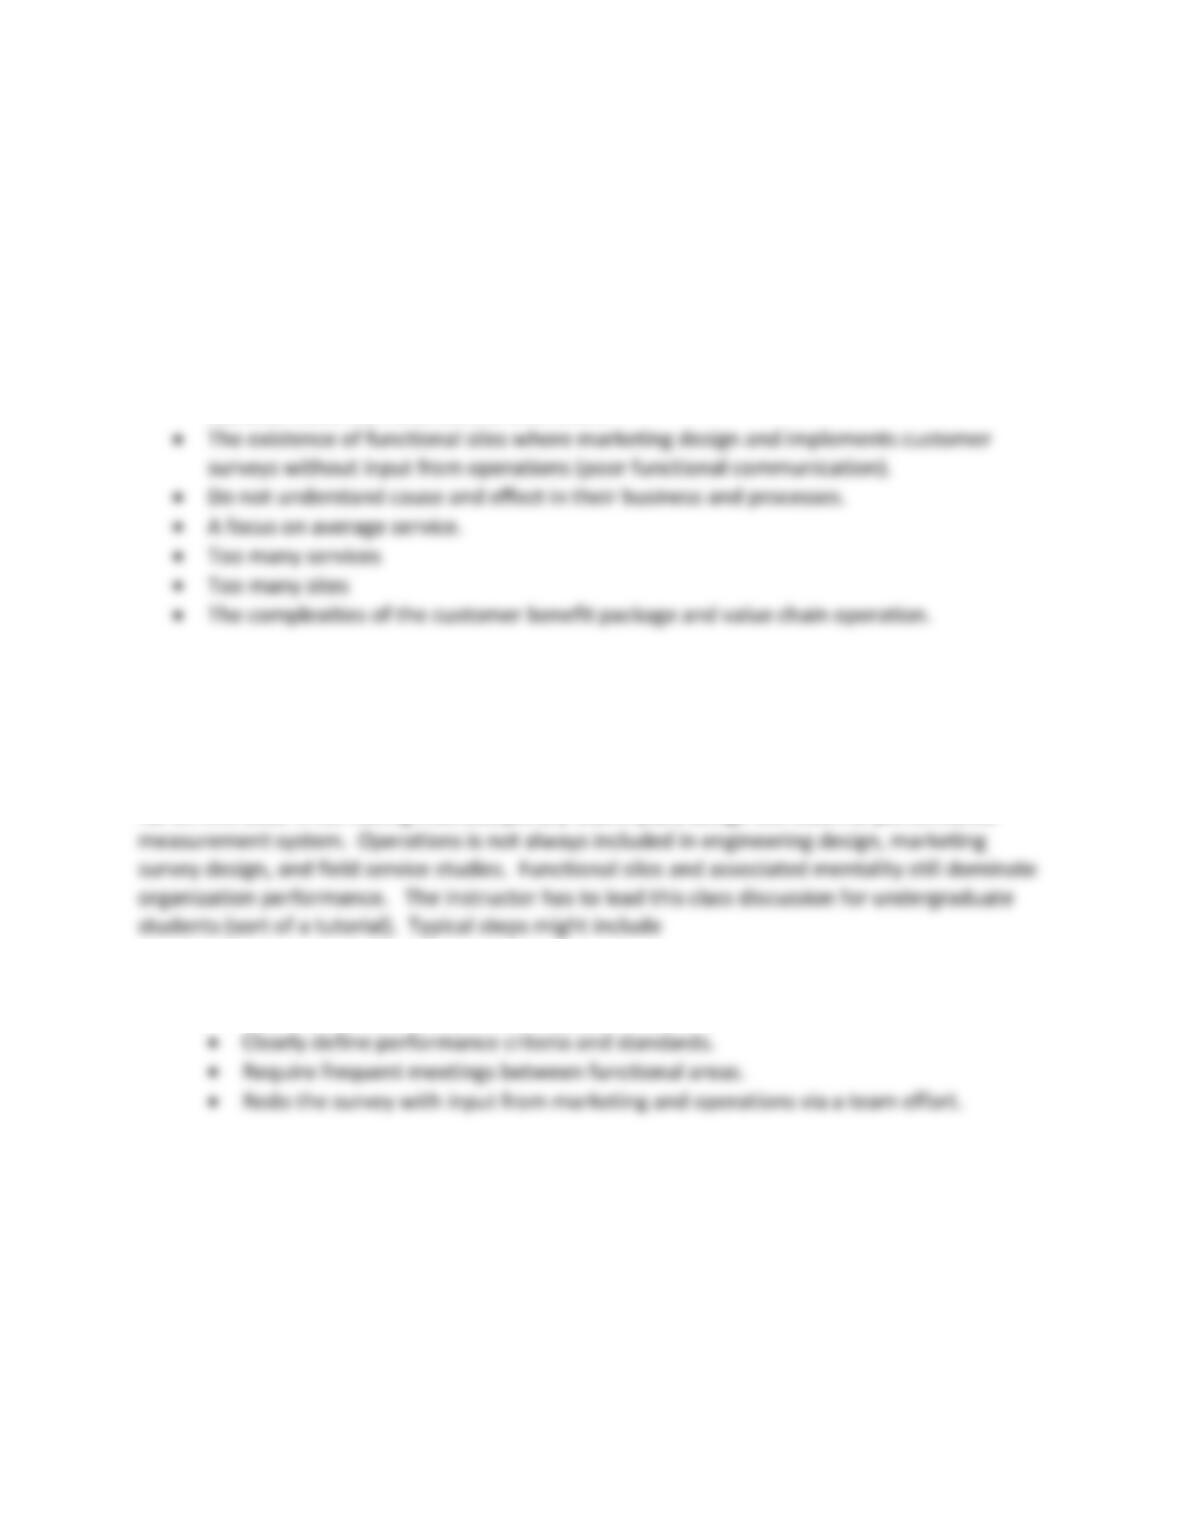
3. How should internal and external performance be related? Are these data related? What
do charts and/or statistical data analysis tell you, if anything? (Use the data in Exhibit 2.11
to help answer these questions).
Depending on the capabilities of your students, they can draw simple charts of the data to
discover performance relationships between (a) time (months) and customer satisfaction, (b)
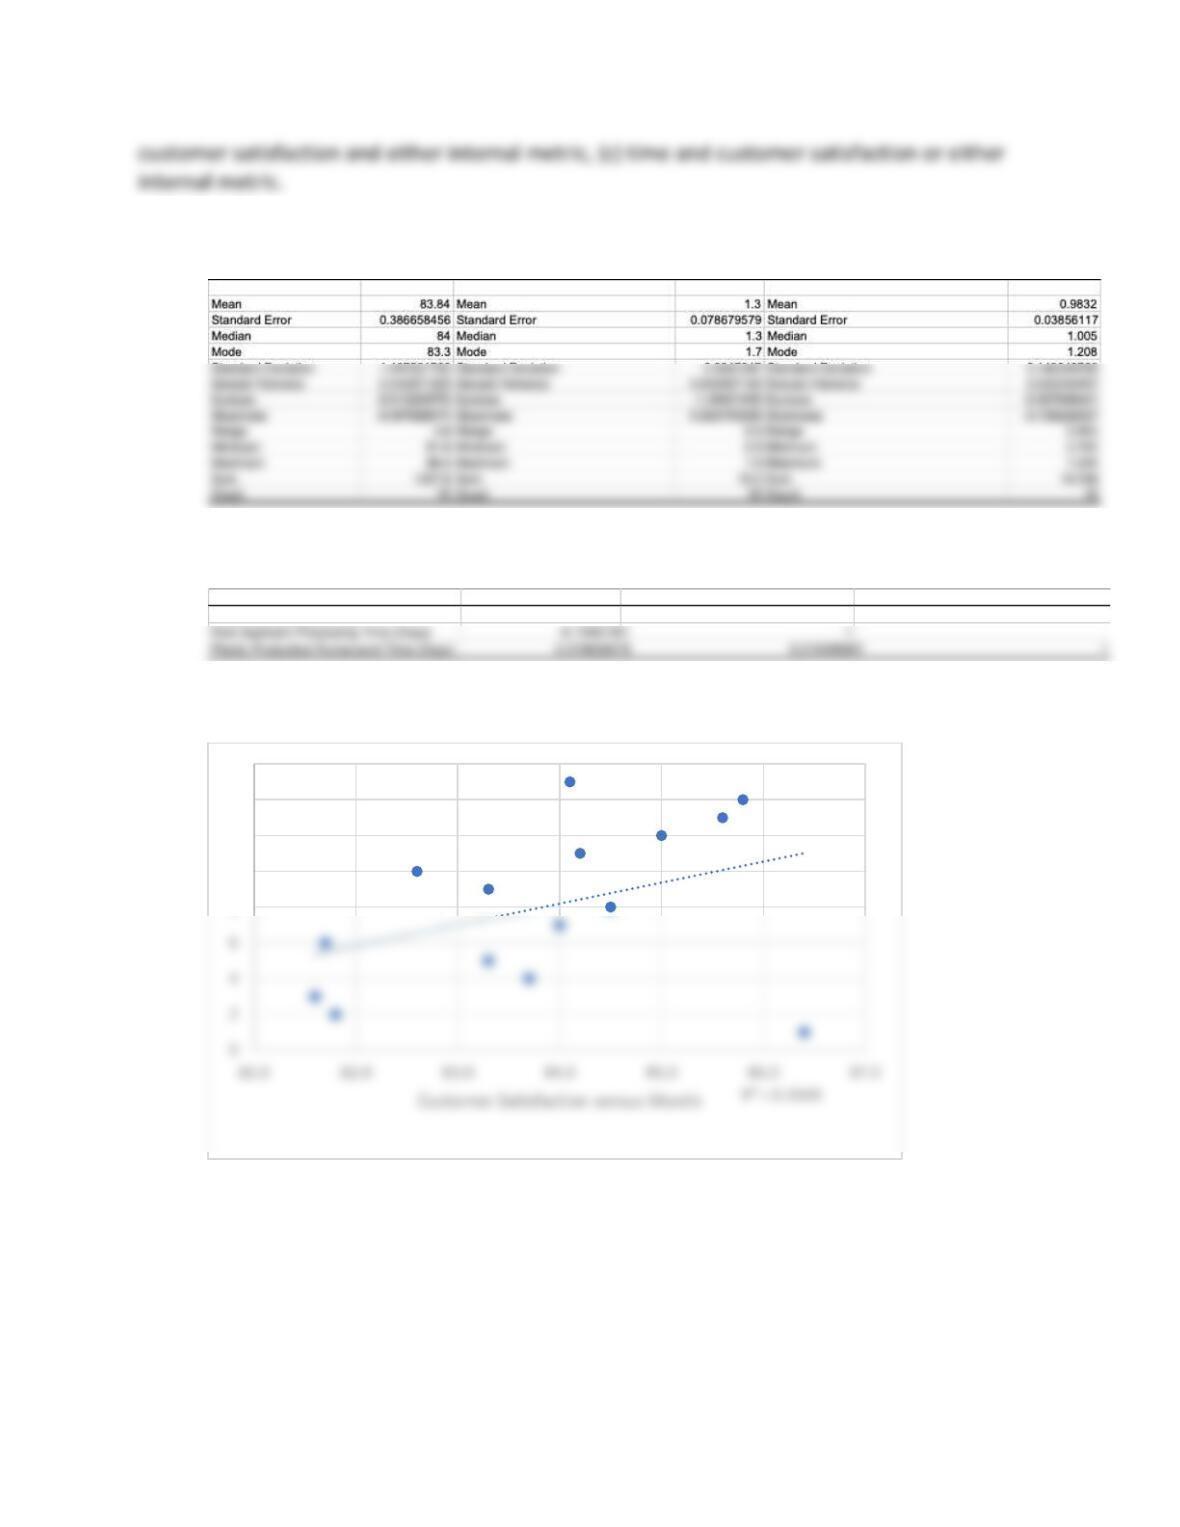
35
Descriptive statistics
Correlations
Scatter charts
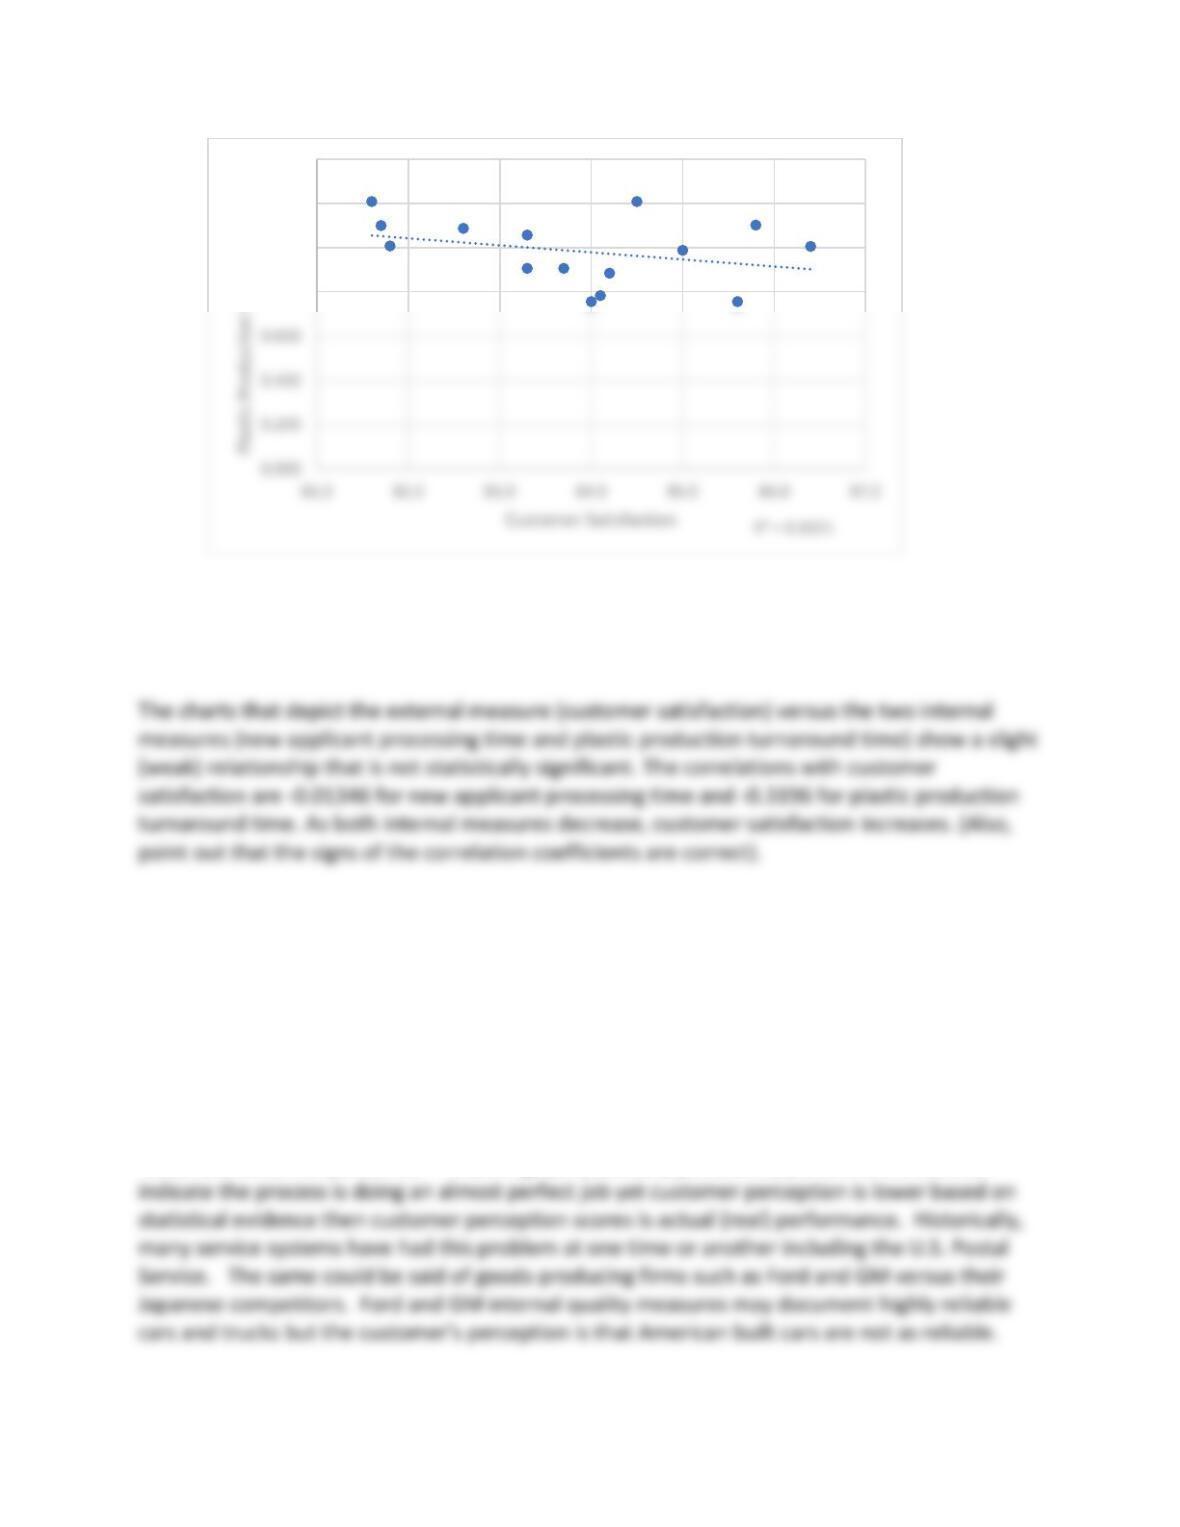
The CS% versus Month graph provides evidence of continuous improvement and a positive
trend. As months increase so does customer satisfaction.
Customer Satisfaction (%) New Applicant Processing Time (Days) Plastic Production Turnaround Time (Day
Customer Satisfaction (%) 1
10
12
14
16
36
1.0
1.2
1.4
1.6
1.8
2.0
0.800
1.000
1.200
1.400
37
Students are not required to compute correlations or develop trendlines, so if they conclude
there is a weak relationship between these internal and external variables, they are correct
based on the graphs.
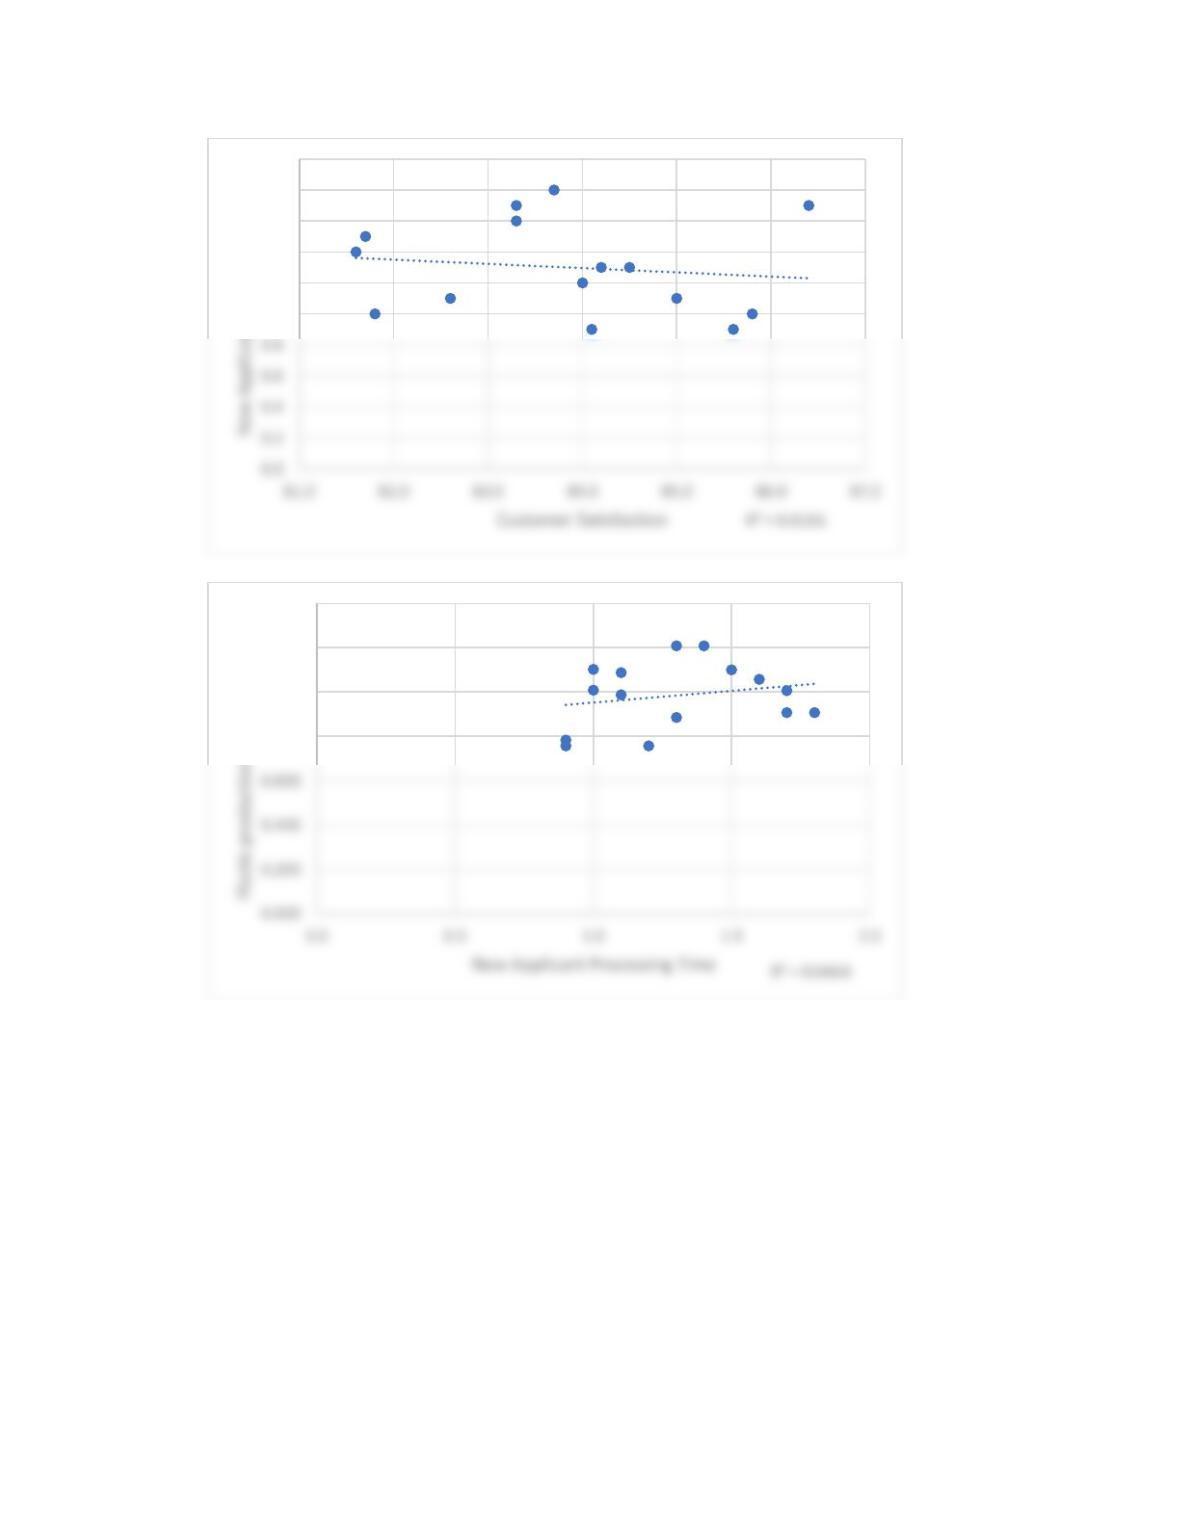
If you assign your students to do correlations and regression analysis, none of the results are
statistically significant (an advantage of statistical analyses). The scatter charts and R2 values
show little relationship between the variables, making it difficult to draw conclusions. The
conclusion is the data collection and analysis should be redone with a larger sample size
(current sample size is 15 observations).
4. Is the real service level what is measured internally or externally? Explain your reasoning.
This can trigger an interesting discussion. The answer to this question is: the real service level is
“what the customer perceives.” That’s right, if process (operational) performance metrics
0.800
1.000
1.200
1.400
38
5. What are your final recommendations?
A good student answer focuses on short– and long-term recommendations. A short-term
recommendation might be to immediately begin weekly meetings between marketing and
Teaching Plan
Address the questions posed by Sutherland:
1. What are the major problems facing the credit card division?
2. What steps are required to develop a good internal and external performance and
information system?
Teaching Note: Hudson Jewelers
A complete teaching note for all chapters is available in the Instructor Resources online.
Instructors should read the entire case and most of the case assignments at the end of each
chapter. Then decide if you want to assign all or part of the case questions.
Chapter 2 Case Questions for Discussion:
1. What is the value of a loyal customer to Hudson Jewelers for a wealthy
individual who visits Naples, Florida every February and buys jewelry for her
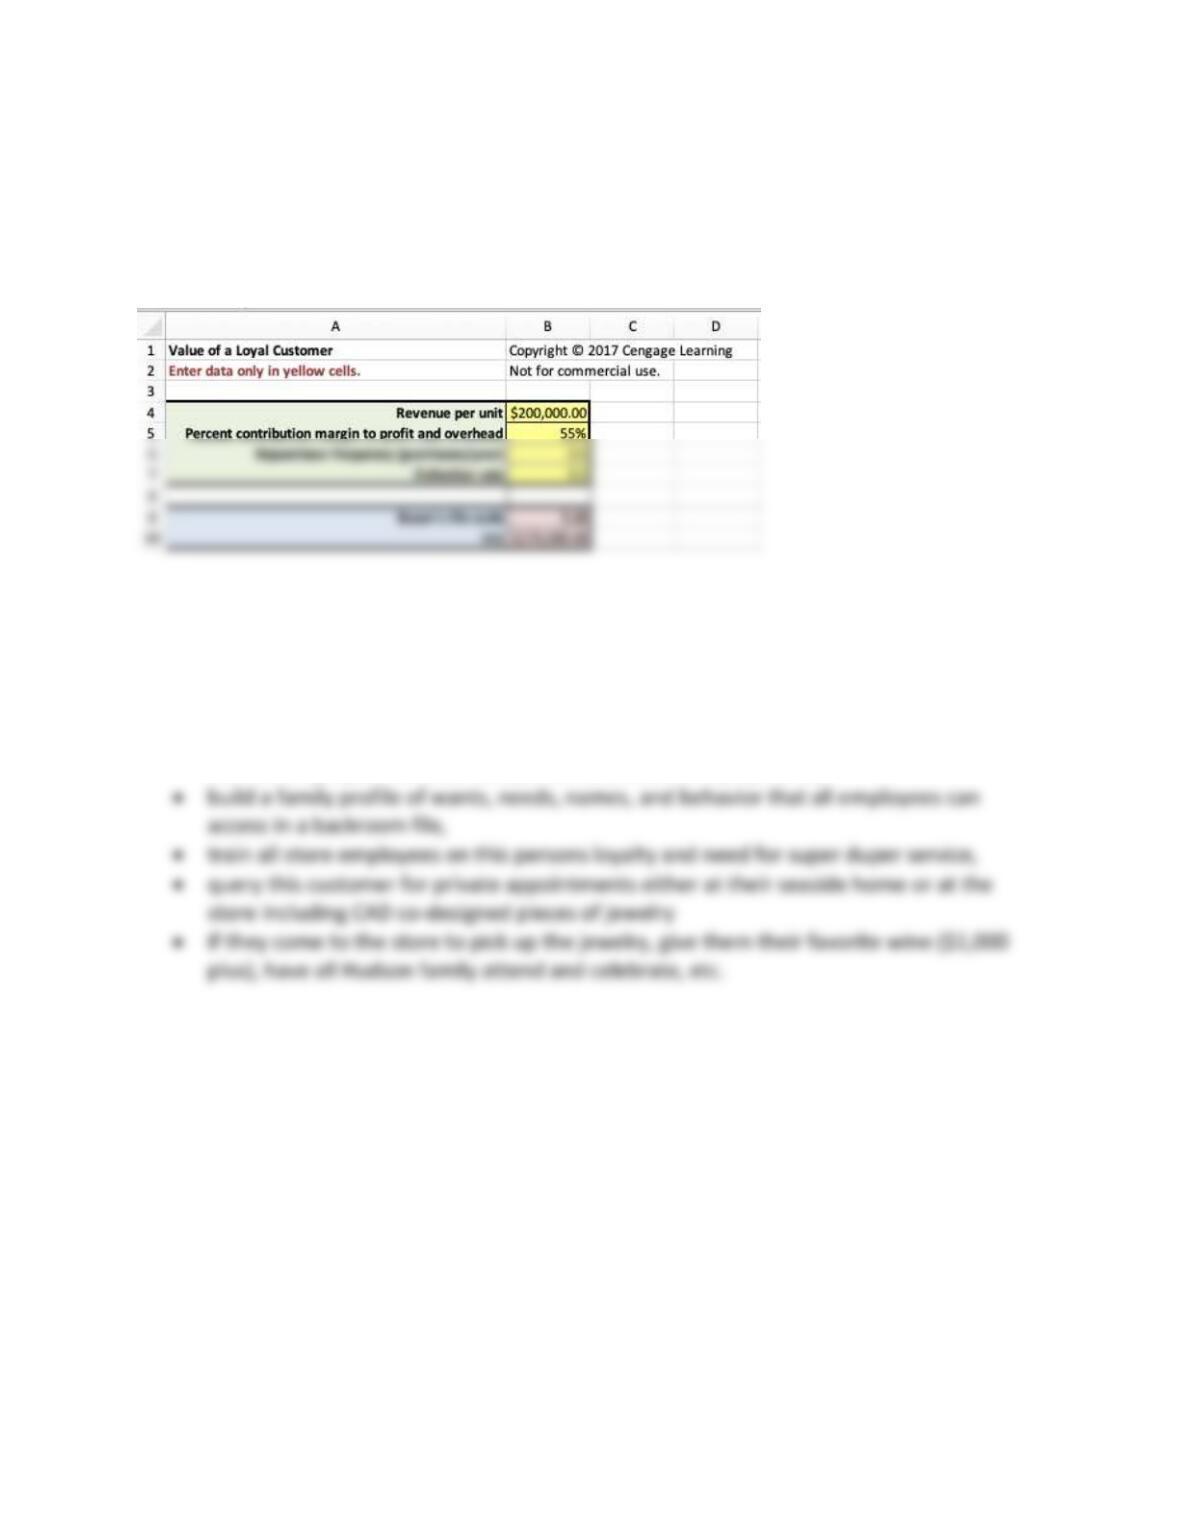
extended family every other year? Assume the following:
39
Repurchase frequency = 0.5
Customer defection rate = 1 – retention rate = 1 – 0.8 = 0.2
Buyer’s life cycle = 1/defection rate = 1/0.2 = 5 years
Value of this Loyal Customer = $200,000*0.55*.5*5 = $275,000
2. Design an individual “service plan” for this “AAAA” customer.
A service plan for a “super A” customer might include:
• mailing or e-mailing to this customer upcoming jewelry pieces displayed at the store in
November to March every year,
• train all employees to know this person and their family by name,
The Ritz-Carlton and other high-end service systems maintain “customer profiles” for their “A”
customers. Formal customer profiles for A customers is a good idea for HJ.