
Management Information Systems, 13TH ED.
MANAGING THE DIGITAL FIRM
Kenneth C. Laudon ● Jane P. Laudon
continued
Learning Track 5: Occupational and Career Outlook for
Information Systems Majors 2010-2020
Total employment in the United States is expected to increase by about seven percent from 2010
to 2020. However, the 20.5 million jobs expected to be added by 2020 will not be evenly distribut–
ed across major industry and occupational groups. Changes in consumer demand, improvements
in technology, the rise and fall of industries and entire sectors of the economy, and many other
Career Satisfaction Among Information Systems Majors
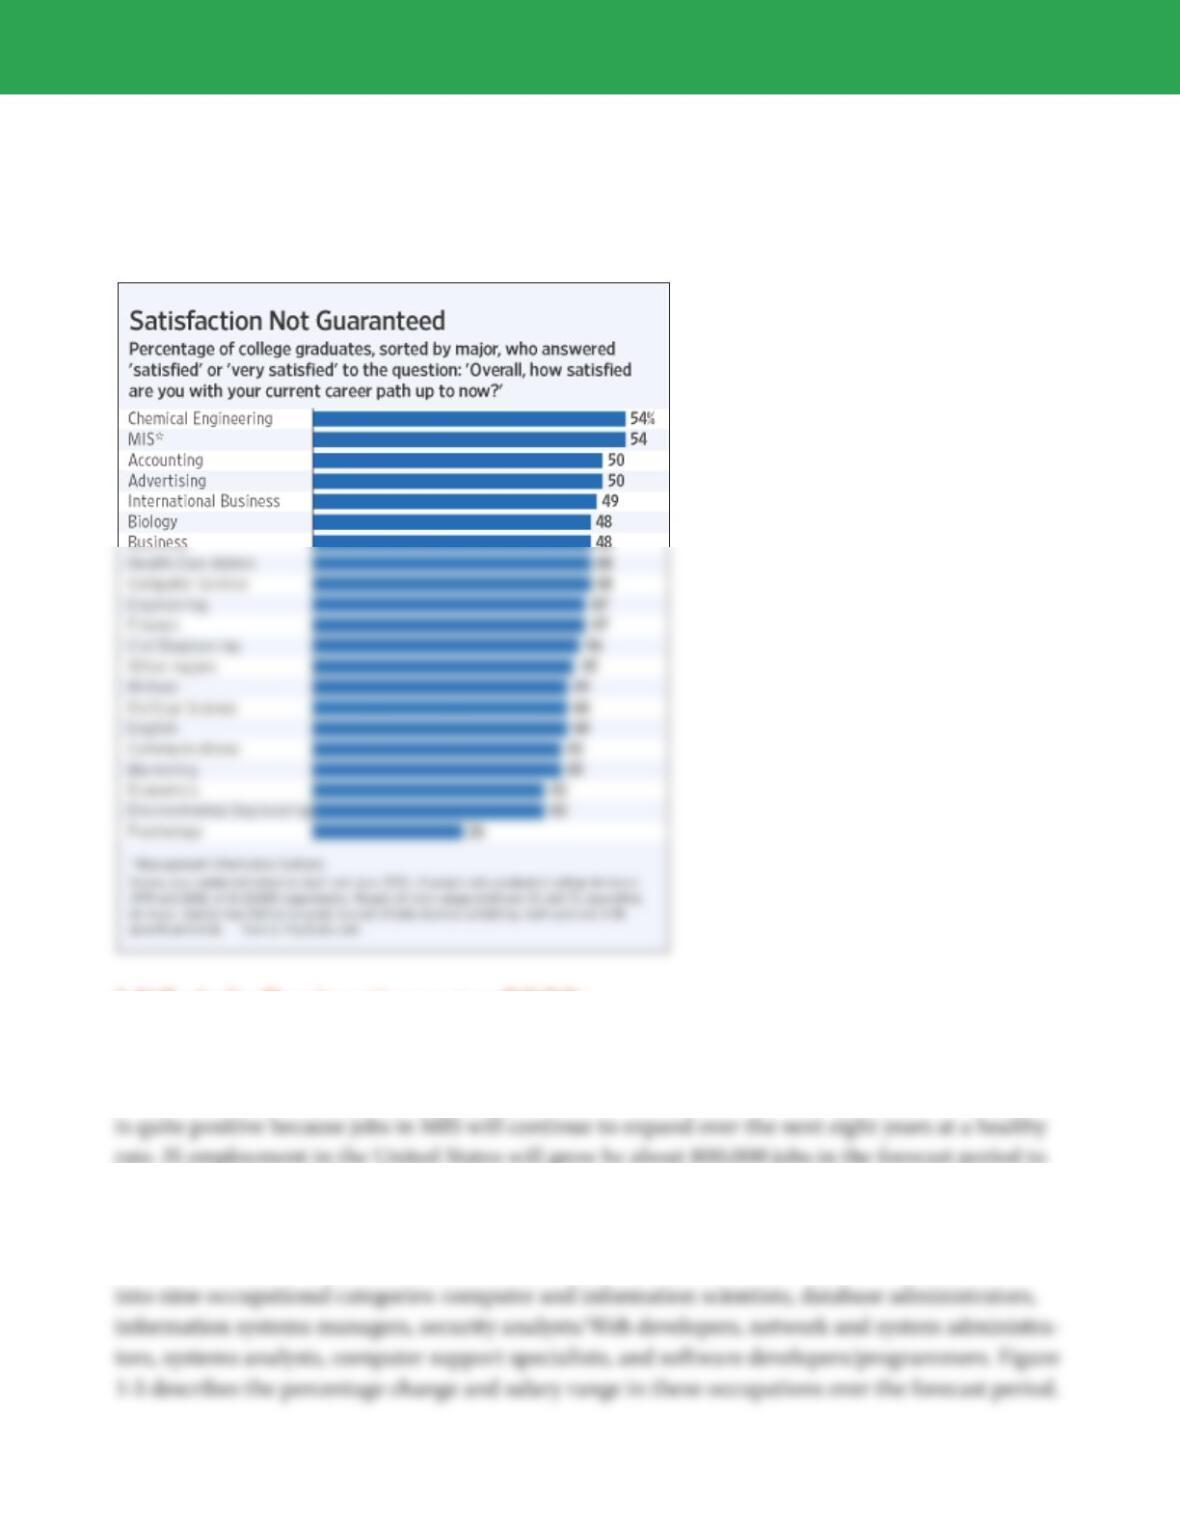
A survey completed in 2010 found that IS majors were among the most satisfied with their career
path since graduation when compared to other majors (Figure 1–1). In fact, MIS majors had the
highest level of career path satisfaction. 54% of MIS graduates were “satisfied” or “very satis-
fied” with their career path since graduation. e survey, which was conducted by PayScale.com
between April and June of 2010, only included respondents with jobs, but could also include people
who went on to earn a graduate degree. It included 10,800 employees who got their bachelor’s
Chapter 2: Global E-business and Collaboration
Chapter 2 Learning Track 5 2
continued
Another factor is pay. MIS is ranked 15th out of 114 occupations in terms of median starting pay
($50,900) and mid-career median pay ($90,300) (Payscale.com, 2010).
FIGURE 1-1 MIS Scores Highest in Career Path Satisfaction
MIS Job Projections to 2020
If MIS college graduates today are among the most satisfied, and if this is in part related to employ–
ment prospects and job satisfaction after graduation, then the future for the various IS/MIS careers
2020.
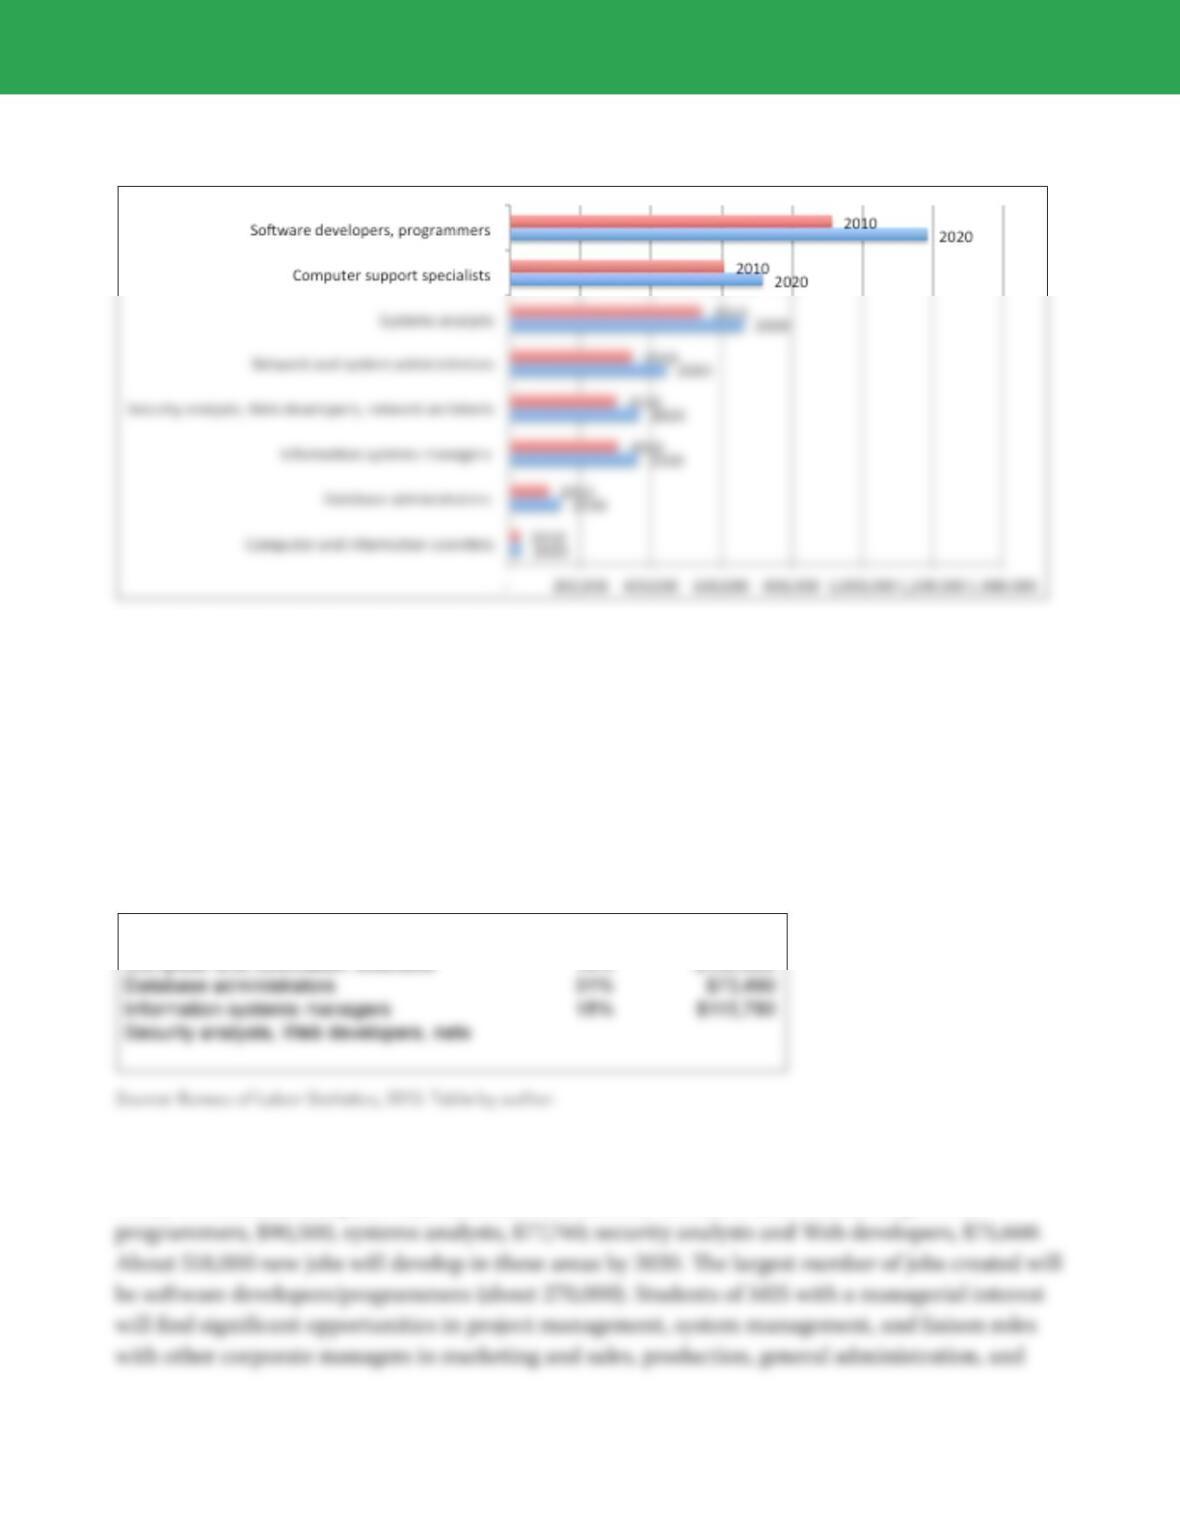
Figure 1–2 below presents data from the Occupational Outlook Handbook (Bureau of Labor
Statistics, 2013) for the period 2010–2020. is table collapses a variety of MIS occupational titles
Chapter 2 Learning Track 5 3
continued
FIGURE 1-2 Job Outlook for Selected IS Occupations 2010-2020
Source: Bureau of Labor Statistics, 2013. Table by author.
Compensation of IS Personnel
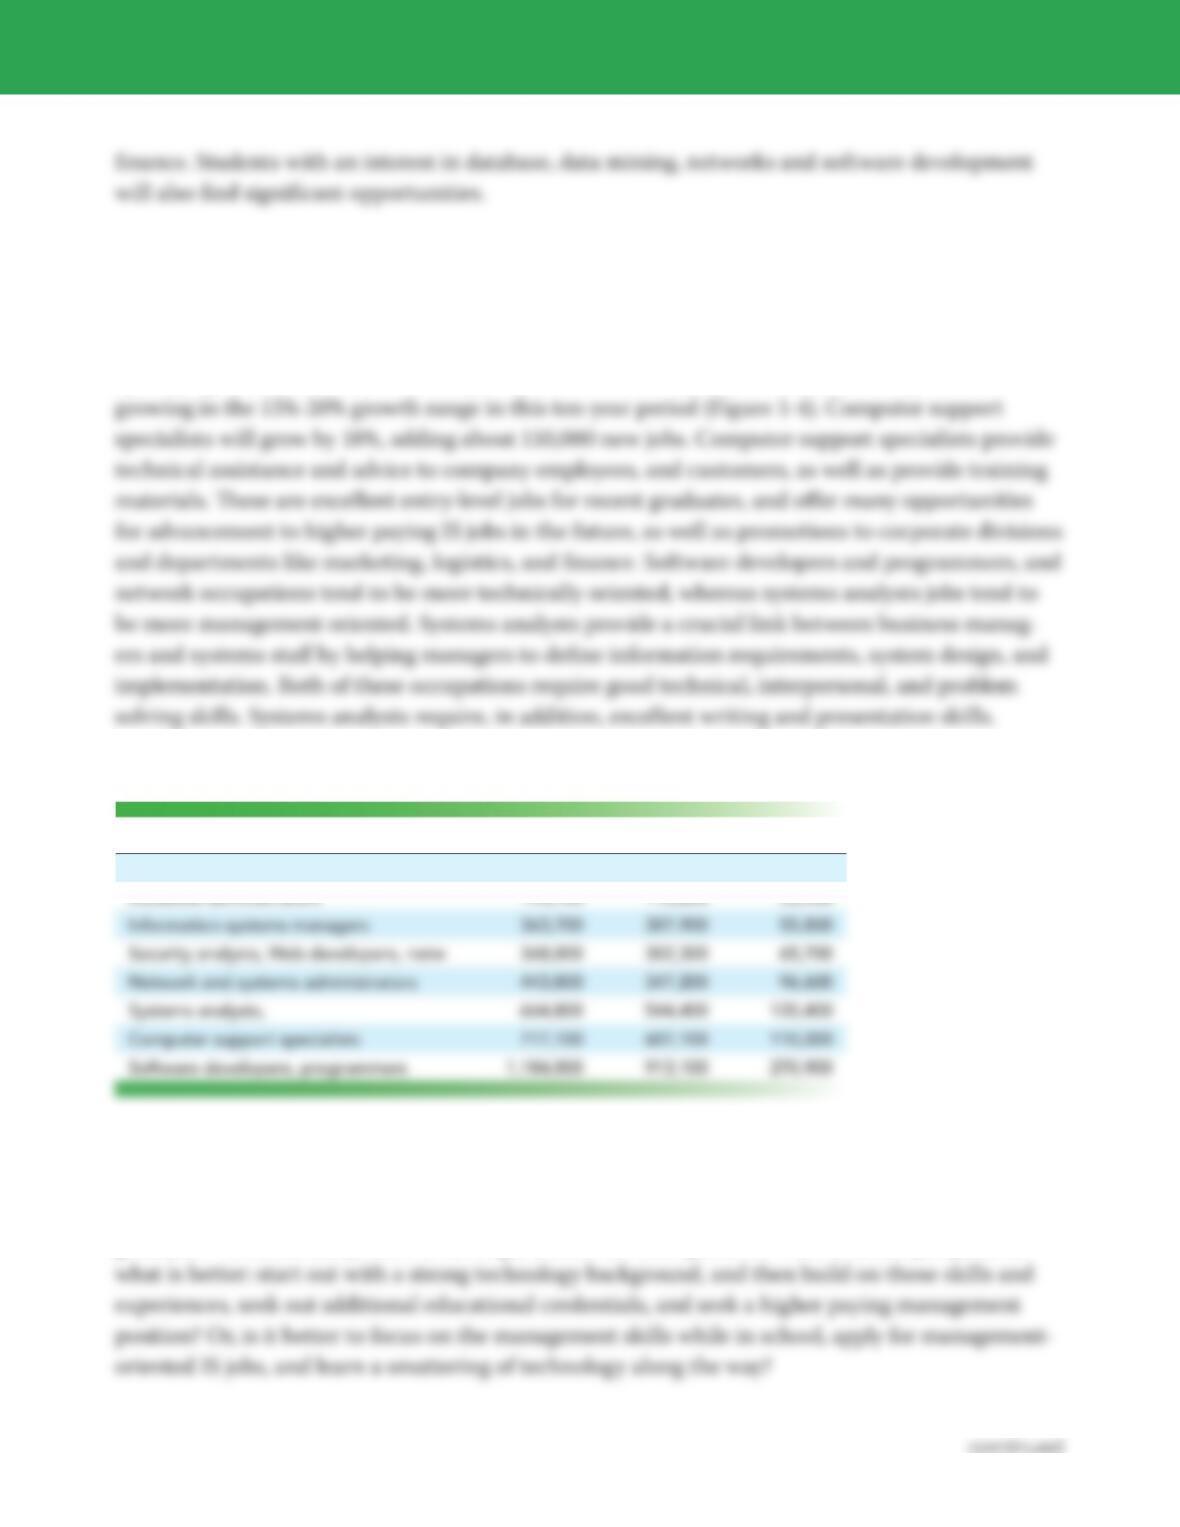
IS occupation salaries are generally far above the average compensation for employees in the
United States (about $45,000 annually) (Figure 1–3).
FIGURE 1-3 Percentage Change and Salary Range in Selected IS Occupations, 2010-2020
%Change Median Salary
Computer and information scientists 19% $100,660
Software developers, programmers 30% $90,500
e top five occupational titles in terms of salary are: information system managers with a median
salary of $116,000; computer and information scientists, $100,660; software developers and
Chapter 2 Learning Track 5 4
Fastest Growing IS Occupations
All IS occupations show a far higher rate of growth than the average for all occupations (about 7%).
e fastest growing occupations are database administrators (31%) followed by software devel-
opers/programmers (30%), network/system administrators (28%). e other IS occupations are
FIGURE 1-4
2020 2010 New Jobs
Computer and information scientists 33,500 28,200 5,300
Database administrators 144,700 110,800 33,900
Technical vs. Managerial IT Jobs
One question business students often ask is “How much technology do I need to know to get a
good job?” Unfortunately, there is no single answer for this question. From a career perspective,
Chapter 2 Learning Track 5 5
continued
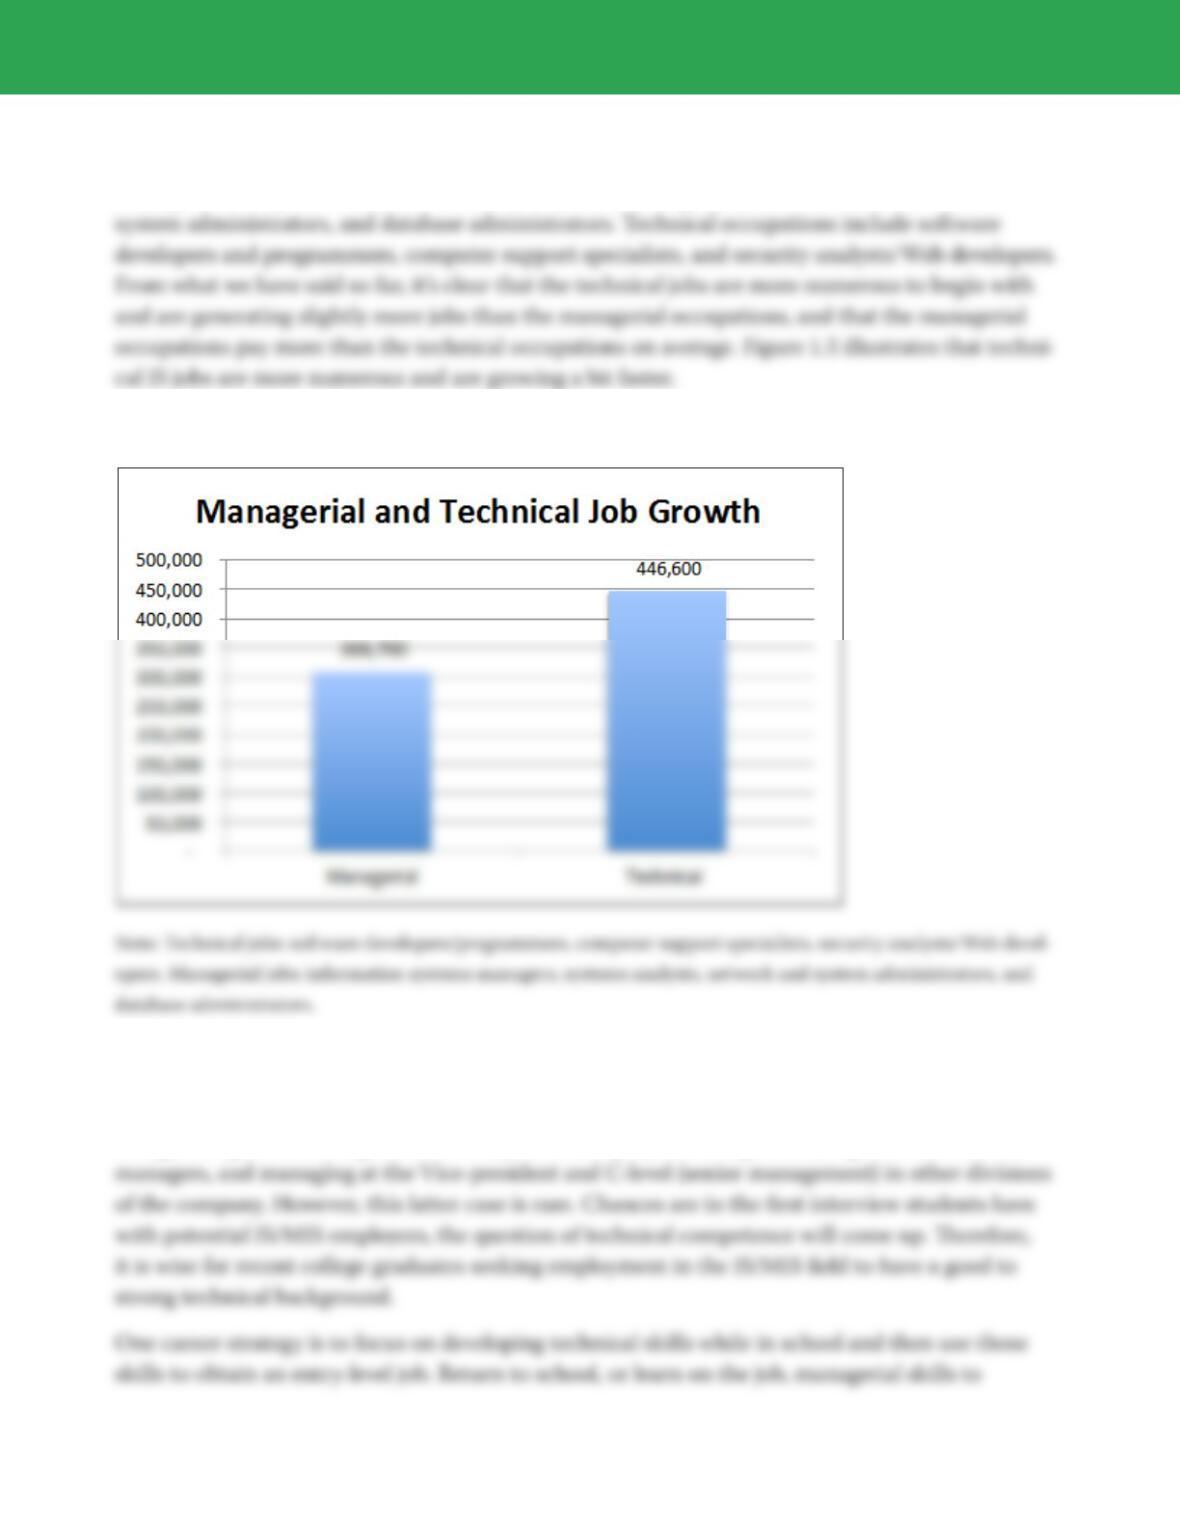
Figure 1.5 groups the various IS occupations into two groups: managerial and technical.
Managerial occupations include information systems managers, systems analysts, network and
FIGURE 1.5 Technical vs. Managerial IT Job Growth 2010-2020
In the history of the MIS profession there are a variety of successful career paths. Some senior IS
managers started out in narrow technical jobs and worked their way up to becoming managers and
even CIOs (Chief Information Ocers). In contrast, there are some CIOs who have very little tech–
nology background but a great deal of experience as project managers, dealing with other senior

Chapter 2 Learning Track 5 6
continued
participate in the higher earnings of this group. Another strategy is to focus on technical skills
for an entry level job, then build on those skills staying within the technical track to attain higher
paying technical positions.
The Impact of an Aging Labor Force on IS Careers
e demand for IS and MIS employees will actually be much higher in the next decade and beyond
than discussed above because of the aging population and labor force in the United States.
e U.S. civilian population, including individuals aged 16 and older, is expected to increase by
25.2 million to a total of 325 million from 2010 to 2020 (about 8%). e labor force is expected to
increase at about the same rate from 157 million in 2010 to 167 million in 2020, an increase of .8%
by 7.6 percent, reffecting the slower birth rate following the baby–boom generation. e 35 to 44
age group is anticipated to experience little change, with a growth rate of 0.2 percent, while the
population aged 16 to 24 will grow at only .3 percent over the projection period. According to the
U.S. Census Bureau, the number of people aged 55 and older will increase to 30% by 2020, while
the number of younger workers will grow only 5%. By 2030, with the last of the baby boom genera-
In a nutshell, the U.S. population and the labor force are getting older over the foreseeable future,
and slowing in growth. ree decades ago the median age of the labor force was 35 years. Today,
the median age is estimated to be 41 and by 2030, the median age is expected to be 48. Retirement
Chapter 2 Learning Track 5 7
continued
Industry Efiects: Choosing e Right Sector
While employment prospects for IS/MIS majors look very good, it certainly will help if students focus on those
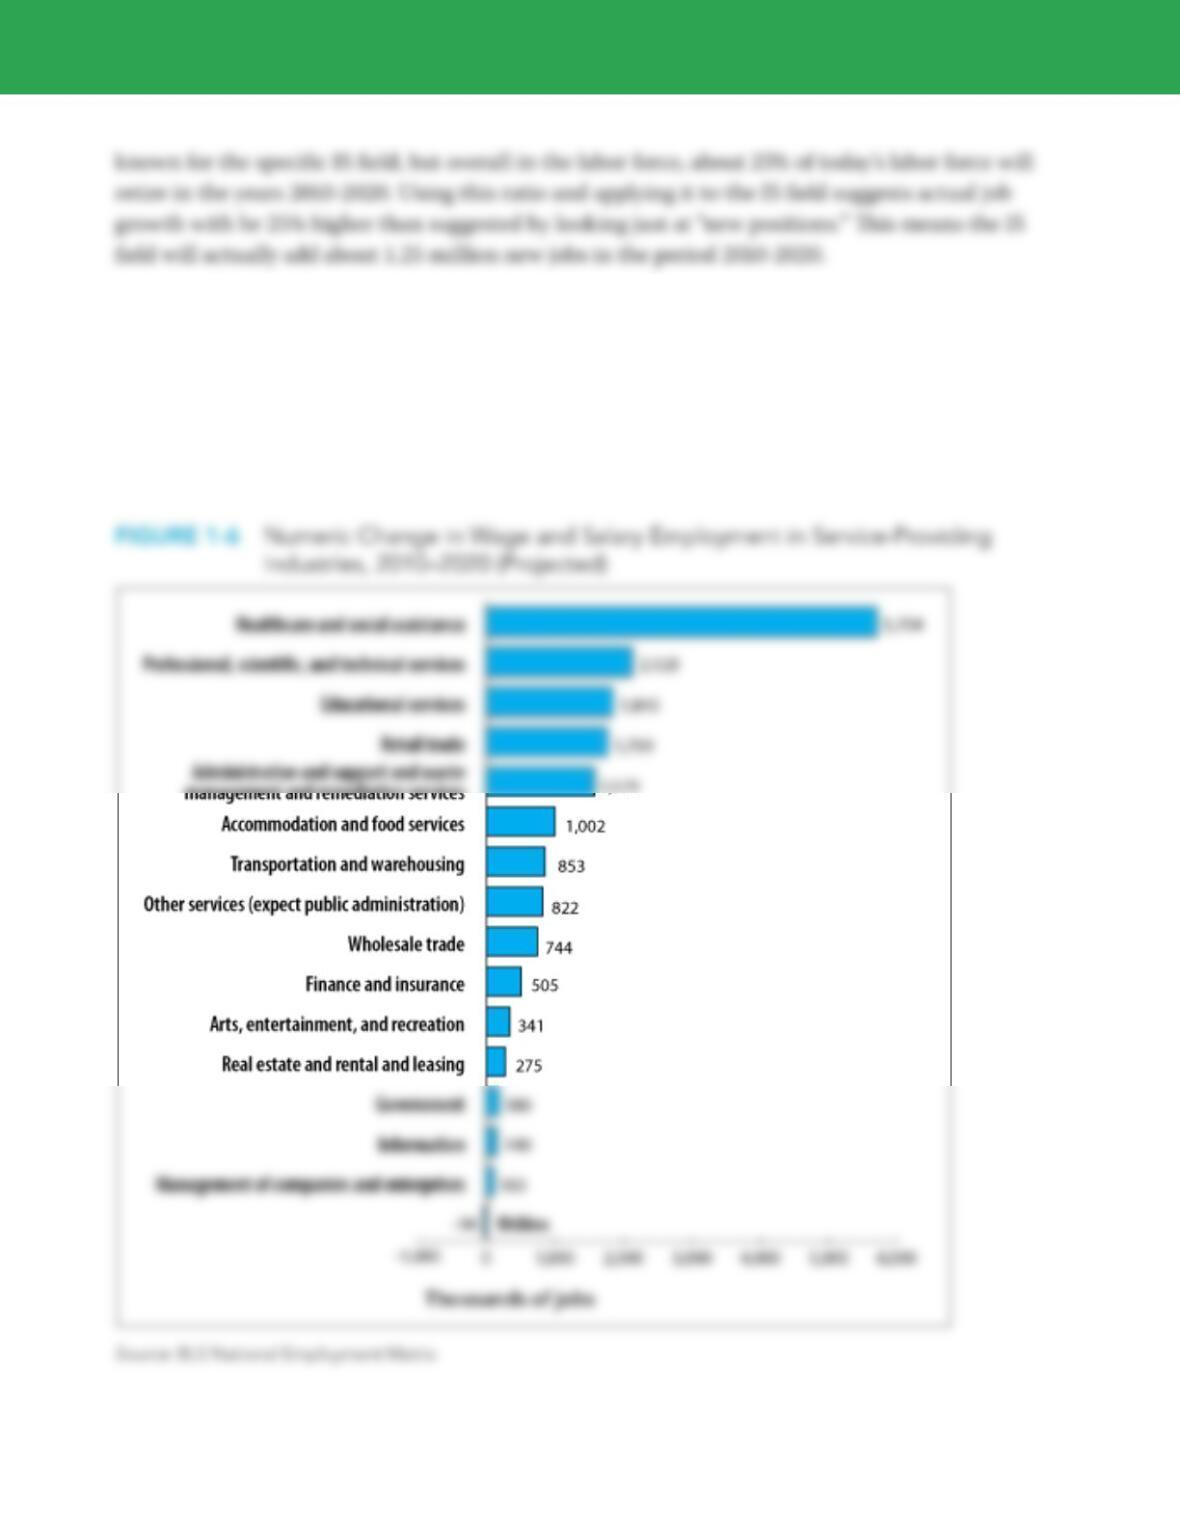
sectors and industries that are likely to expand. e shift in the U.S. economy away from goods-producing
in favor of service-providing is expected to continue. Service-providing industries are anticipated
to generate approximately 14.5 million new wage and salary jobs. As with goods-producing indus-
tries, growth among service-providing industries will vary (Figure 1–6).
Chapter 2 Learning Track 5 8
continued
Choosing the right industry for employment is like choosing the right asset class in an invest–
ment portfolio. e best opportunities for IS employment both in terms of percentage growth
and overall numbers of new jobs can be found healthcare, professional and scientific services,
The Impact of Outsourcing on IS/MIS Employment: A
Riddle
In the last decade, tens of thousands of IS/MIS jobs in the United States have been outsourced
to India, as well as other countries. e three leading Indian outsourcing firms (Wipro, InfoSys,
and Tata) are growing at about 10% annually, and currently employ about 300,000 IS/IT workers
in India, most of whom are working on outsourced projects from the United States, and Europe.
Large American global technology firms like Cisco, Microsoft, and IBM have made significant
investments in India. IBM has created seven centers in India, and employs over 150,000 Indian
workers in 2012. Microsoft has over 5000 employees in India working on products at all stages of
ere are many reasons that outsourcing to India and other areas has grown so rapidly. Labor
costs in India are 10%-20% of labor costs in the U.S. A $60,000 a year programmer in the United
States can be employed in India in 2013 for about $8,000-$10,000, and that programmer will live
comfortably. Second, the Internet has made it possible and inexpensive to coordinate and manage
far ffung teams of employees. ird, Indian infrastructure has improved to the point where it can
support global business operations (although there are exceptions). Fourth, India and China with

Chapter 2 Learning Track 5 9
continued
Oddly, despite all the outsourcing of IT work, investment by U.S. businesses in information tech-
nology and systems has expanded in the last decade at an extraordinary rate of about 5% annually
(more than twice the rate of growth of the economy as a whole). Investment in information tech-
nology, systems, hardware, software and telecommunications equipment was $540 billion in 2012,
52% of all capital investment in the U.S., and up from $366 billion in 1998 (Bureau of Economic
Analysis, 2013). Employment levels in the IS/MIS careers and occupations have also expanded in
the U.S. over the last decade at about 5% annually.
How is it possible that IS/MIS outsourcing can be proceeding at a very rapid rate, and growth in
IS/MIS careers and investments is expanding? e answers are speculative. One possible answer is
that outsourcing has largely involved lower level, technical programming and engineering jobs and
not higher level, high value-added jobs. As more lower level jobs are outsourced, more higher value
jobs replace them. Moreover the demand in the U.S. for technical programming jobs has exceed–
Summary: Employment Career Prospects for IS/MIS
Majors to 2020
◆ Recent college graduates report high levels of satisfaction in their IS/MIS careers.
◆ US IT/IS jobs will grow at 5-6% over the period, about 1.5 times the GDP growth and consider-
ably faster than the overall growth in the labor force.
Chapter 2 Learning Track 5 10
◆ Compensation for IS/MIS graduates is above average compensation for college graduates and is
likely to remain so for the forecast period.
◆ Unemployment among IS/IT/MIS workers is extremely low
◆ e fastest growing IS/MIS jobs are database administrators, software developers/program-
mers, and network system administrators.
◆ e highest paid IS/MIS jobs are information systems managers, computer and information
scientists, software developers.
◆ Technical jobs which can become routinized and commoditized suer the greatest risk of
outsourcing to low wage countries.
◆ Managerial jobs, and those technical jobs which require hands-on, judgmental, creative, and
design skills are much less likely to be outsourced.