CP – 3
Chapter 2
Introduction to Probability
Case Problem: Hamilton County Judges
The data in the table provides the basis for the analysis. We provide notes as a guide to answering
questions 1 through 5.
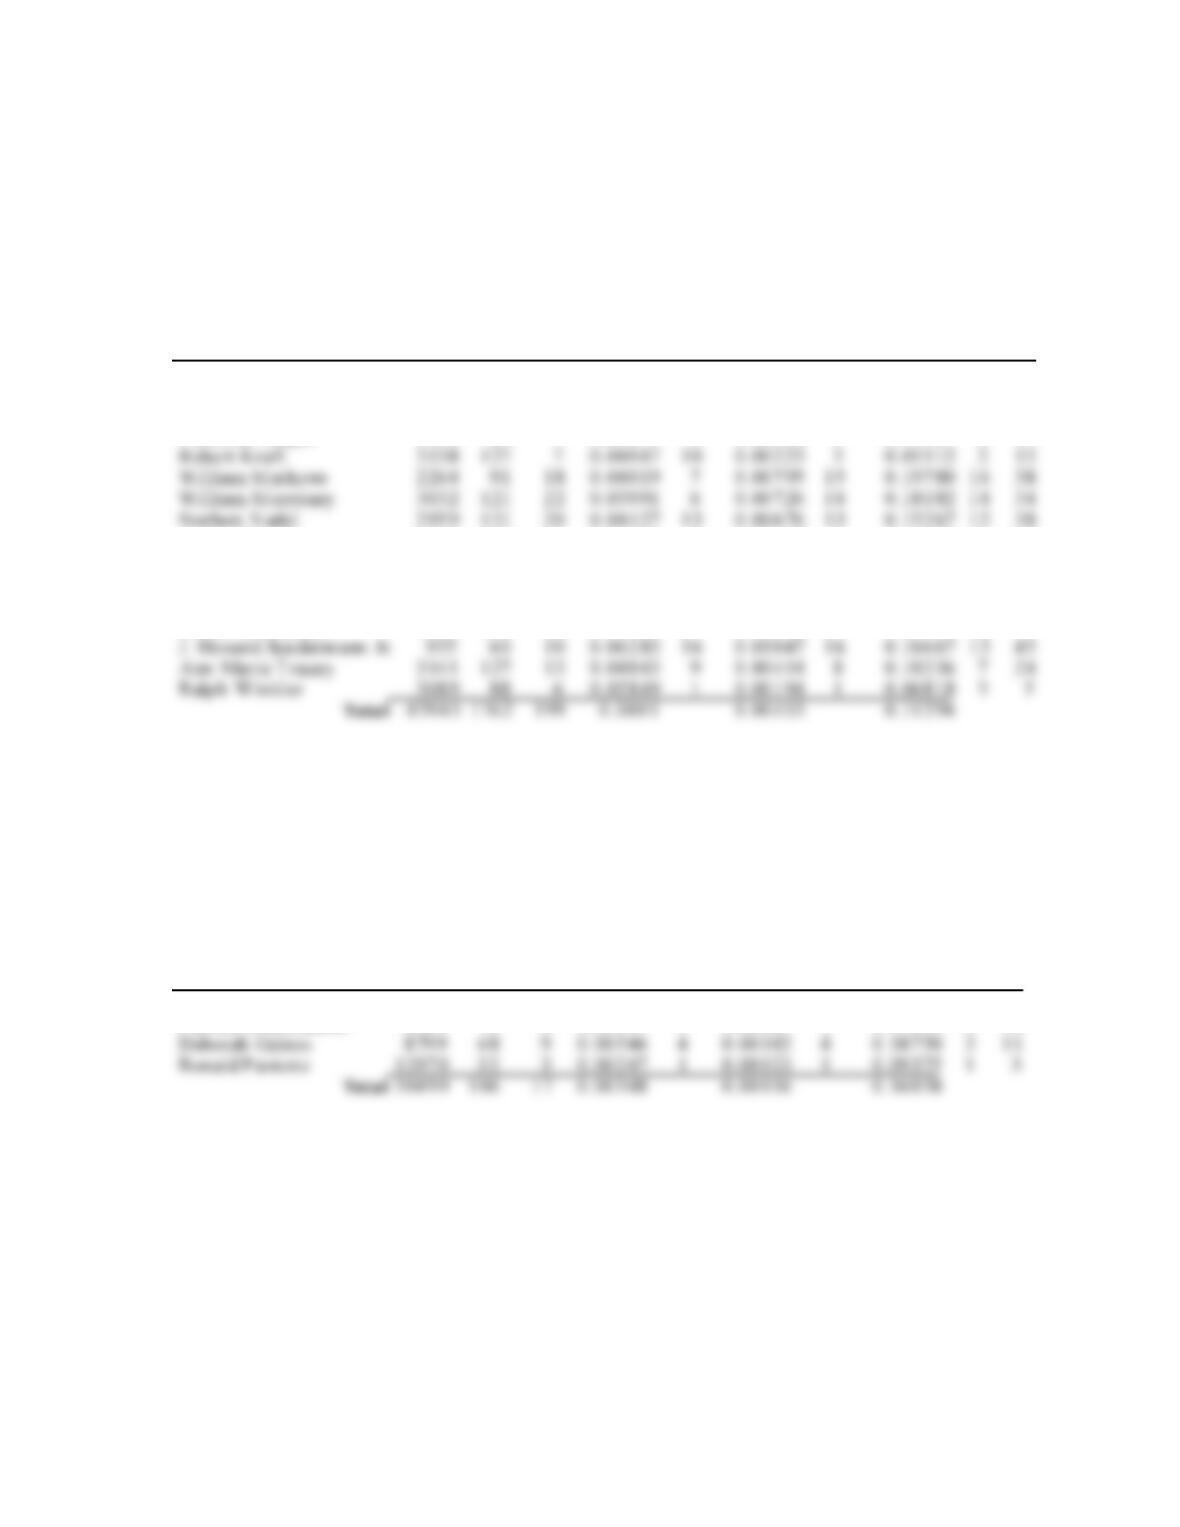
1. The conditional probabilities of cases being appealed in the three courts are given in the 3 Total rows
in the table. For Common Pleas Court, the probability of an appeal is .0401; for Domestic Relations
Court, the probability of an appeal is .00348; and for Municipal Court, the probability of an appeal is
.00461. Appeals are much more likely in Common Pleas Court. But, even there, only 1 in 25 cases
are appealed. The unconditional probability of an appeal across all 3 courts is
(1762 + 106 + 500)/(43,945 + 30,499 + 108,464) = .0129.
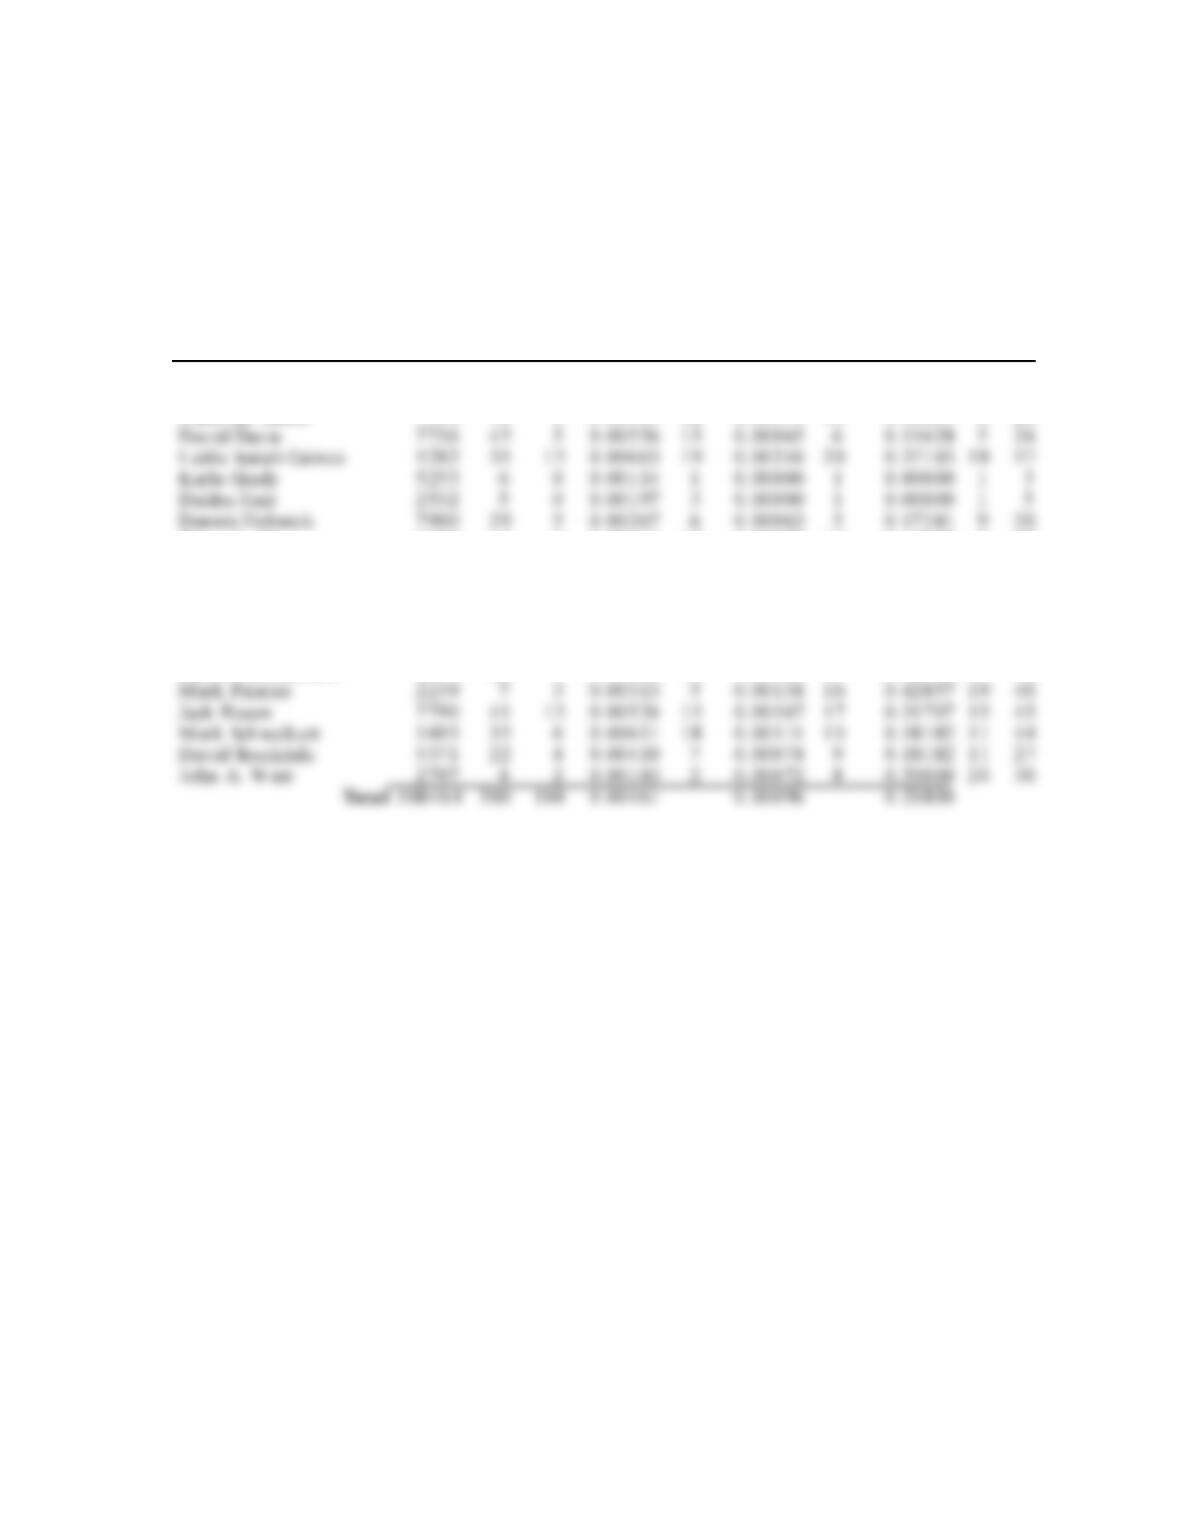
4. The probability of a reversal given an appeal for each judge is given in column 9 of the table. Judges
Nurre, Panioto and Grady/Hair have the lowest probability of reversal for Common Pleas, Domestic
Relations and Municipal Courts respectively.
5. We describe here how The Cincinnati Enquirer used this data to rank the judges. Other approaches
may also be valid, but a rationale should be provided. The newspaper provided ranking for each
judge within each of the courts on percentage of cases appealed, percentage of cases reversed and
Chapter 2
CP – 4
Common Pleas Court
Domestic Relations Court
Judge
Total Cases Disposed
Appealed Cases
Reversed Cases
Probability of
Appeal
Rank
Probability of
Reversal
Rank
Conditional
Probability of
Reversal Given
Appeal
Rank
Sum of Ranks
Fred Cart olano 3037 137 12 0.04511 14 0.00 3 95 6 0.08759 5 25
T hom as Crush 3372 119 10 0.03529 4 0.00297 4 0.08403 4 12
P atrick Dink elacker 1258 44 8 0.03498 3 0.00636 12 0.18182 14 29
T im o t hy Hogan 1954 60 7 0.03071 2 0.00358 5 0.11 6 67 9 16
Arthur Ney, Jr. 3219 125 14 0.03883 5 0.00435 9 0.11200 8 22
Richard Niehaus 3353 137 16 0.04 0 86 11 0 .00477 10 0.11679 10 31
T hom as Nurre 3000 121 6 0.04033 8 0.00200 2 0.04959 1 11
John O’Connor 2 96 9 1 29 12 0 .04345 12 0.00404 7 0.09302 6 25
Robert Ruehlman 3205 145 18 0.04524 15 0.00 5 62 11 0 .12414 11 37
Judge
Total Cases Disposed
Appealed Cases
Reversed Cases
Probability of
Appeal
Rank
Probability of
Reversal
Rank
Conditional
Probability of
Reversal Given
Appeal
Rank
Sum of Ranks
P en elope Cunningham 2729 7 1 0.00257 2 0.00037 2 0.14286 2 6
Introduction to Probability
CP – 5
Municipal Court
Judge
Total Cases Disposed
Appealed Cases
Reversed Cases
Probability of
Appeal
Rank
Probability of
Reversal
Rank
Conditional
Probability of
Reversal Given
Appeal
Rank
Sum of Ranks
Mike Allen 6149 43 4 0 .00699 20 0.00065 7 0.09302 4 31
Nadine Allen 7812 34 6 0 .00435 9 0.00077 11 0.17647 10 30
T imot hy Hogan 2308 13 2 0 .00563 17 0.00087 13 0.15385 7 37
James Pat rick Kenney 2798 6 1 0.00214 4 0.00036 4 0.16667 8 16
Joseph Luebbers 4698 25 8 0 .00532 14 0.00170 18 0.32000 16 48
William Mallory 8277 38 9 0 .00459 11 0.00109 14 0.23684 14 39
Melba Marsh 8219 34 7 0.00414 8 0.00085 12 0.20588 13 33
Bet h Mat tingly 2971 13 1 0.00438 10 0.00034 3 0.07692 3 16
Albert Mestem aker 4975 28 9 0 .00563 16 0.00181 19 0.32143 17 52
Chapter 2
CP – 6
Case Problem: College Softball Recruiting
The data in the table provides the basis for the analysis. We provide notes as a guide to answering
questions 1 through 4.
Junior Year
Senior Year
At Bats
Hits
At Bats
Hits
Fran Hayes
200
70
40
15
Millie Marshall
1. Calculate the batting average of each player for her junior year, then also calculate the batting
average of each player for her senior year. Which player would this analysis lead you to choose?
Junior Year
Senior Year
At
Bats
Hits
Batting
Average
At
Bats
Hits
Batting
Average
Fran Hayes
200
70
0.350
40
15
0.375
Millie Marshall
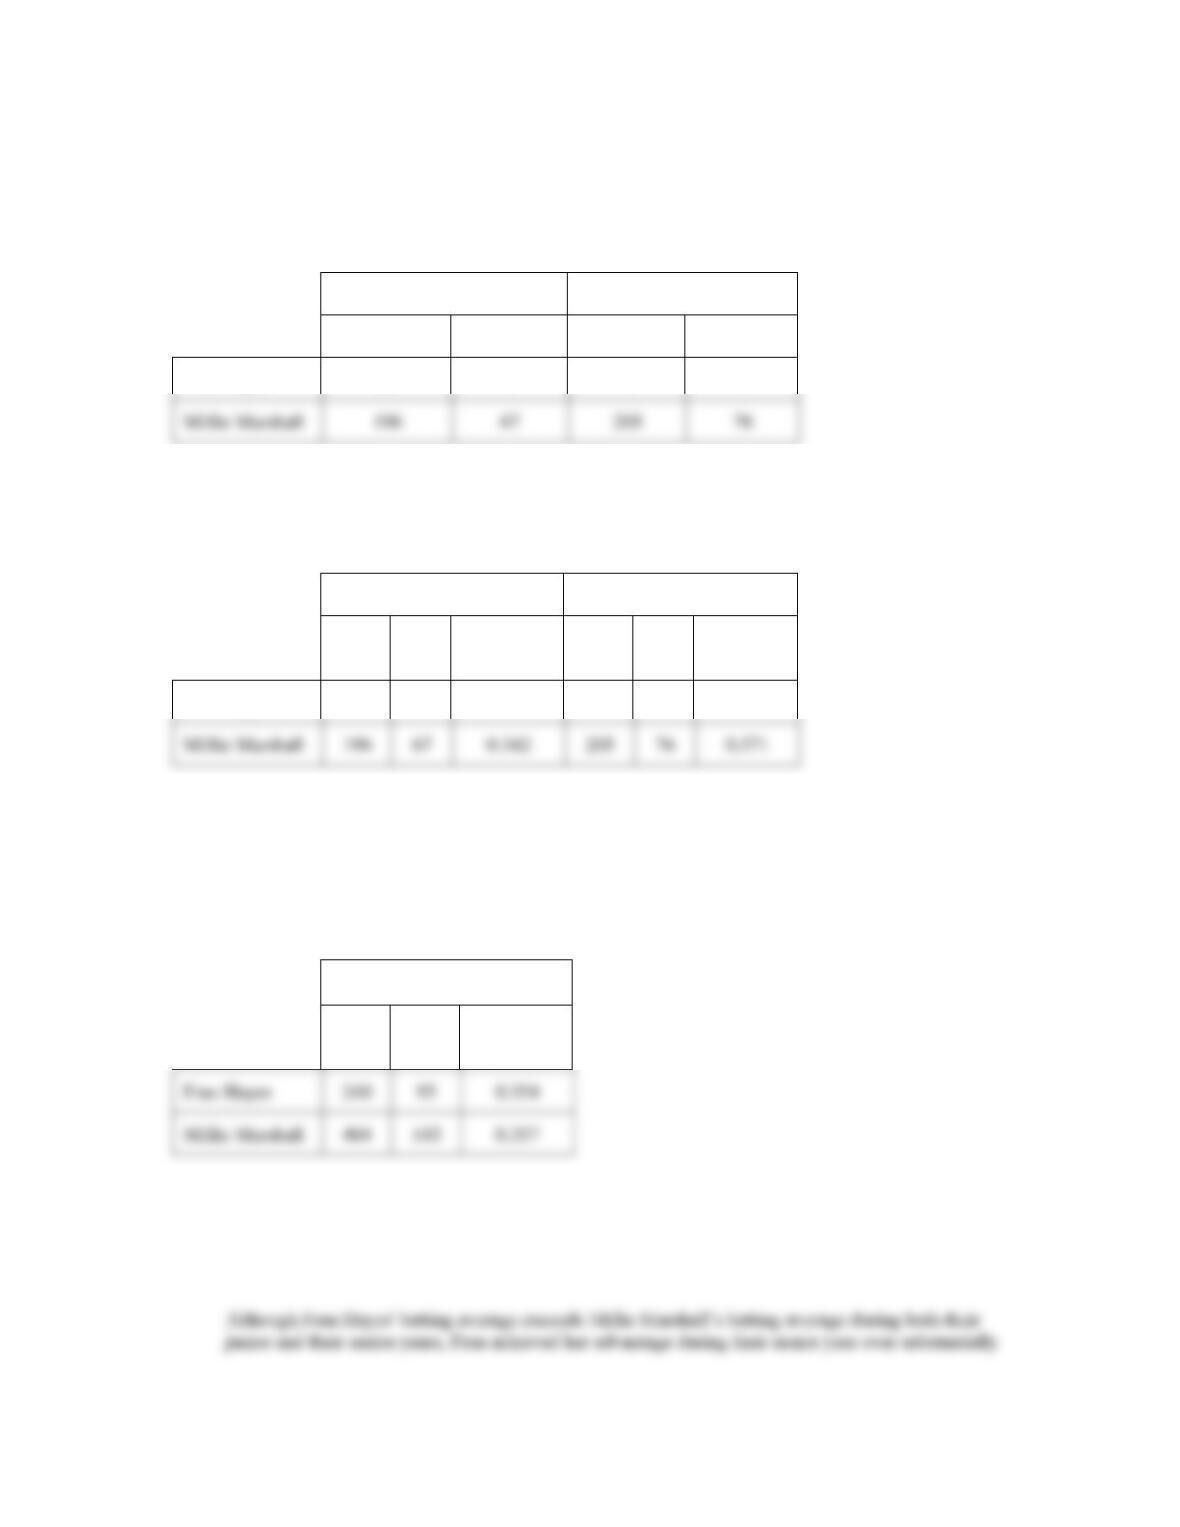
Fran Hayes had a higher batting average than Millie Marshall during their junior year and during
their senior year. This analysis suggests the university should offer Fran the scholarship.
2. Calculate the batting average of each player for her combined junior and senior years. Which player
would this analysis lead you to choose?
Combined Junior
& Senior Years
At
Bats
Hits
Batting
Average
Fran Hayes
240
85
0.354
Millie Marshall
404
143
0.357
When each player’s junior and senior years are combined, Millie Marshall has a higher batting
average than Fran Hayes. This analysis suggests the university should offer Millie the scholarship.
3. After considering both of your analyses, which player would you choose? Why?
Introduction to Probability
CP – 7
fewer at bats (40 for Fran and 205 for Millie). Millie has actually proven herself over two full
seasons and should be selected over Fran.
4. Prepare a report on your findings for the athletic director and coach of the college program. Focus on
clearly explaining the discrepancy in your two analyses.
In addition to explaining your responses to the previous questions, your report should explain how
this seemingly paradoxical result has occurred. You could start by explaining that during their junior