1
Instructor’s Manual – OMSC2 – Collier/Evans – C2 Measuring Performance in Operations and
Value Chains
This chapter introduces students to the basic concepts performance measurement in both goods-
producing and service-providing value chains. We describe different types of measures used for
decision making; explain the use of analytics in OM, which includes an example of basic statistical
analysis and a summary of the business analytics supplements at the end of this book,
Questions and problems are provided in four categories:
1. Review questions
2. Discussion questions and experiential activities
Two Excel spreadsheet templates – Statistical Analysis and VLC (Value of a Loyal Customer),
available in MindTap, are illustrated in solved problems.
The chapter has three cases:
1. Greyhound Bank: Credit Card Division focuses on business analytics and interlinking key
internal (operations) and external (marketing) performance measures.
2
KEY TERMS
Actionable measures provide the basis for decisions at the level at which they are applied—the
value chain, organization, process, department, workstation, job, and service encounter.
A customer-satisfaction measurement system provides a company with customer ratings of
specific goods and service features and indicates the relationship between those ratings and
the customer’s likely future buying behavior.
Goods quality relates to the physical performance and characteristics of a good.
Innovation refers to the ability to create new and unique goods and services that delight
customers and create competitive advantage.
The quantitative modeling of cause-and-effect relationships between external and internal
performance criteria is called interlinking.
3
Service quality is consistently meeting or exceeding customer expectations (external focus) and
service-delivery system performance (internal focus) for all service encounters.
Errors in service creation and delivery are sometimes called service upsets or service failures.
Statistics involves collecting, organizing, analyzing, interpreting, and presenting data. A statistic
is a summary measure of data.
REVIEW QUESTIONS
1. Define measurement.
Measurement is the act of quantifying the
performance
criteria
(metrics)
of
2. What are the eight performance measure categories for organizations?
As described in the chapter, these are:
• Financial
• Customer and market
3. What is a customer-satisfaction system?
A customer-satisfaction measurement system
provides
a company with customer ratings
4. Define goods quality and service quality.
Goods quality relates to the physical
performance
and characteristics of a good.
5. What are five dimensions of service quality?
• Tangibles — physical facilities, uniforms, equipment, vehicles, and appearance of
employees (i.e., the physical evidence).
6. Define service upsets and give an example from personal experience.
Errors in service
cre
ation and delivery are
sometimes
called service upsets or service
7. The performance measure “time” relates to what two performance dimensions?
Time relates to two
types
of
performance measures—the
speed of doing something
8. Define goods and service design flexibility and volume flexibility.
Goods and service design
flexibility
is
the
ability to
develop
a wide range of
5
9. Define innovation and learning.
Innovation refers to the ability to create new and unique goods and services
that
10. Define productivity and operational efficiency.
Productivity is the ratio of output of a process to the
input:
Productivity = Quantity of Output/Quantity of Input
As output increases for a constant level of input, or as the amount of input decreases for
11. Define interlinking. Why is it important?
The quantitative modeling of cause-and-effect relationships between external and internal
performance criteria is called interlinking.
12. Define the value of a loyal customer. Why is it important?
The value of a loyal customer (VLC), quantifies the total revenue or profit each target
market customer
gen
erates over the buyer’s life cycle.
13. How are the customer defection and customer retention rate related?
Customer defection rate
= (
1
–
customer retention rate).
14. What are some of the questions IBM uses to evaluate performance measures?
• Does the measurement support our mission?
• Will the measurement be used to manage change?
15. Define actionable measures.
Actionable
measures provide the
basis
for decisions at the level at which they are
applied-the
value chain,
organization,
process,
department, workstation,
job, and
16. Explain the Baldrige Model of Organizational Performance.
7
See Exhibit 2.5. The underlying concept is that “leadership drives the system that creates
results.”
17. What are the four performance categories of the balanced scorecard approach to
performance measurement?
• Financial Perspective: Measures the ultimate value that the business provides to its
shareholders. This includes profitability, revenue growth, stock price, cash flows,
return on investment, economic value added (EVA), and shareholder value.
18. What are example performance metrics for suppliers, value-creation processes, and
customers in the value chain model of organizational performance?
Students will cite performance measures from Exhibit 2.7 such as:
• Suppliers – on-time delivery, accuracy, quantity, conformance to specifications
19. What is the primary theory of the service-profit chain model of organizational
performance?
The primary theory is that “internal performance creates value and drives external
performance.”
20. What are the implications of Marriott’s quote “Happy employees create happy
customers”? What does this mean for human resource management?
8
This relates to the Service-Profit Chain. Employees create customer value, which in turn,
DISCUSSION QUESTIONS AND EXPERIENTAL ACTIVITIES
21. What types of performance measurements might be used to evaluate a fraternity or
student organization?
Metrics might include attendance at key events, total membership each academic term,
gains and losses in membership, fundraising amounts, operations costs, number of
22. Select an organization you are familiar with or have an interest in and write a short two-
page paper describing key performance metrics in that industry and firm using the format
of Exhibit 2.1.
Students will develop some interesting tables for different industries and firms of interest
to them. A few questions you might pose during discussion of this question are as follows:
• What criteria are missing? Explain
• Does the measurement support our mission?
• Will the measurement be used to manage change?
23. Interview managers at a local company to identify the key business measures (financial,
market, supplier, employee, process, information, innovation, etc.) for that company.
What quality indicators does that company measure? What cause-and-effect (interlinking)
performance relationships would be of interest to the organization?
It is always interesting to see what organizations really measure. In many cases, don’t be
surprised to see simply a heavy emphasis on financial results without a “balanced
scorecard” as such. Quality indicators are often the traditional ones (defects, yield).
24. Research and write a short paper on how some organization applies the five dimensions of
service quality.
SERVQUAL was originally measured on 10 aspects of service quality: reliability,
responsiveness, competence, access, courtesy, communication, credibility, security,
understanding the customer and tangibles (background — using factor analysis). It
10
25. Discuss some analytical or graphical approaches that organizations can use for analyzing
performance data based on your experience and previous coursework.
These methods might include simple charts that you would find in Microsoft Excel, such as
26. Revenue or costs per passenger mile are two key performance measures in the airline
industry. Research their use in this industry and prepare a one-page paper summarizing
how they are used and why they are so important.
The two-metrics drive profitability in the airline industry. Few industries have so few and
simple summary metrics yet they are very powerful. Southwest Airlines, for example,
27. Under which perspective of the balanced scorecard would you classify each of the
following measurements?
a. On-time delivery to customers (customer perspective)
b. Time to develop the next generation of products (innovation and learning
perspective)
c. Manufacturing yield (internal perspective)
Arguments can be made for other perspectives. Some measures may not clearly fall into a
particular category; however, what is more important is that the organization takes a broad
view of the most important measures across the enterprise, rather than just focusing on
financial results.
11
28. When the value of a loyal customer (VLC) market segment is high, should these customers
be given premium goods and services for premium prices? If the VLC is low, should they be
given less service? Explain.
This question can trigger significant differences in student opinions. For example, should
banking customers with average bank deposits of over $100,000 have to stand in the
same teller line as a bank customer with average bank deposits of $1,000? That is, should
the bank set up a premium service channel for premium customers? In the early 1990s
COMPUTATIONAL PROBLEMS AND EXERCISES
These exercises require students to apply the formulas and methods described in the chapter.
These problems should be solved manually.
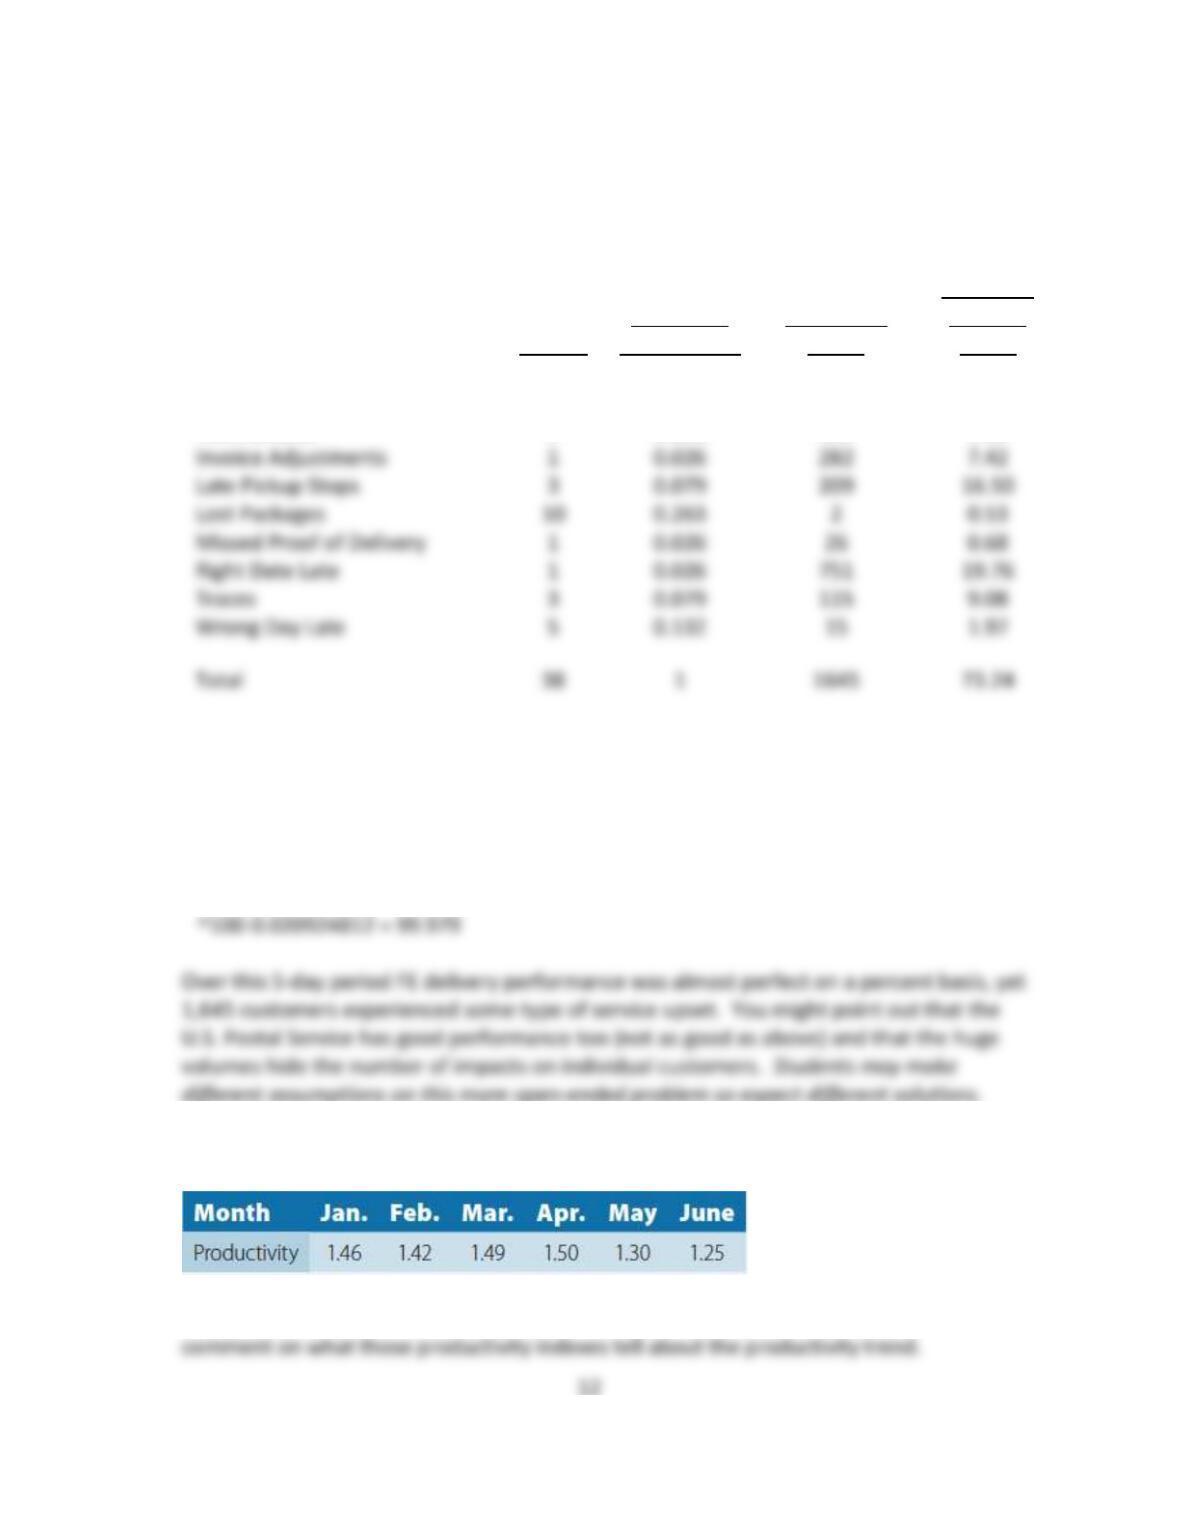
29. Each day, a FedEx competitor processes approximately 70,000 shipments. Suppose that
they use the same Service Quality Index as FedEx and identified the following numbers of
errors during a 5-day week (see the “FedEx: Measuring Service Performance” box). These
values are hypothetical and do not reflect any real company’s actual performance.
Complaints reopened: 125
Damaged packages: 18
International: 102
Compute the Service Quality Indicator by finding the weighted sum of errors as a
percentage of total shipments. How might such an index be used in other organizations
such as a hotel or automobile service facility?
Number of Shipments/Day
70,000
Total Number of Shipments
350,000
Over 5 Days
Weighted
Weight
Percent of
Total Weight
Number of
Errors
Average
Errors
Complaints Reopen
3
0.079
125
9.87
Damaged Packages
10
0.263
18
4.74
International
1
0.026
102
2.68
Invoice Adjustments
1
0.026
282
7.42
Late Pickup Stops
3
0.079
209
Missed Proof of Delivery
1
0.026
26
0.68
Right Date Late
1
0.026
751
Traces
3
0.079
115
9.08
Wrong Day Late
5
0.132
15
1.97
Total
38
Weighted Average % of Total Shipments
0.000209248*
0.020924812+
Service Quality Indicator (SQI)
99.979^
*73.24/350,000 = 0.000209248
+0.000209248*100 = 0.020924812
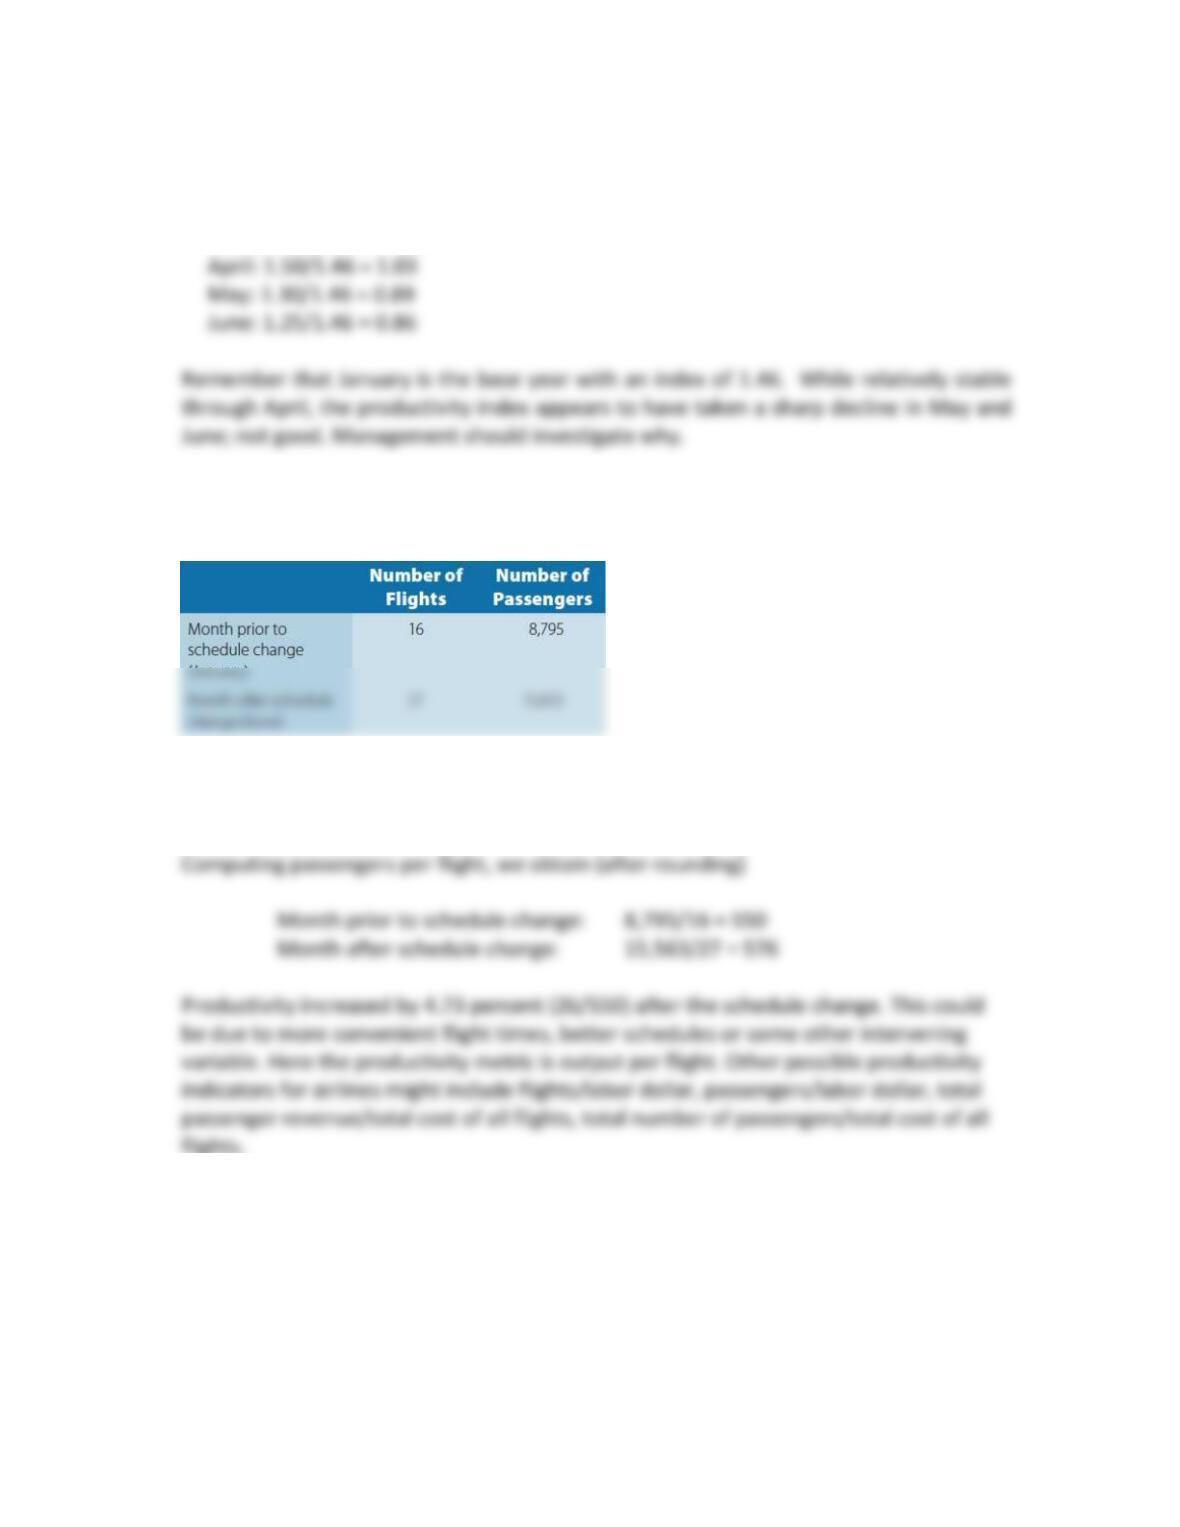
30. Productivity measures for a manufacturing plant over a six-month period follow:
Using January as the base period, compute a productivity index for February to June, and
13
Productivity Indexes:
February: 1.42/1.46 = 0.97
March: 1.49/1.46 = 1.02
31. A major airline is attempting to evaluate the effect of recent changes it has made in
scheduling flights between New York City and Los Angeles. Data available are shown below.
Using passengers per flight as a productivity indicator, comment on the apparent effect of
the schedule change.
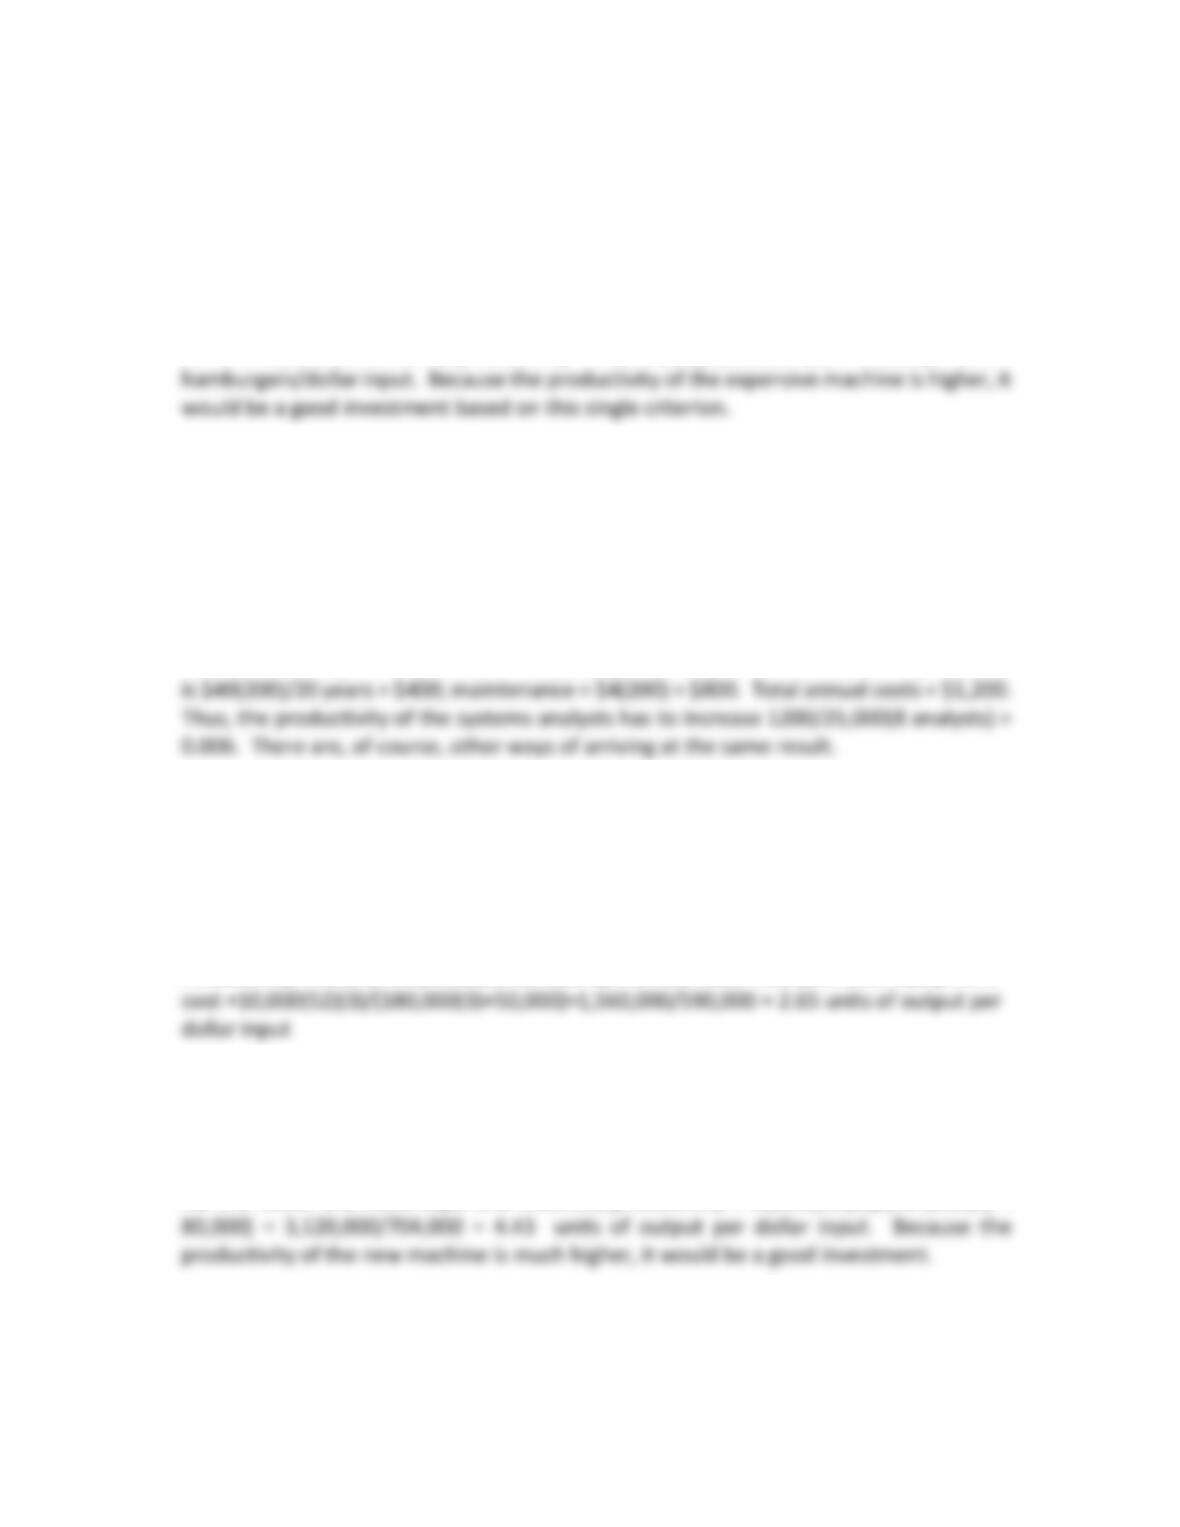
32. A hamburger factory produces 60,000 hamburgers each week. The equipment used costs
$10,000 and will remain productive for four years. The labor cost per year is $13,500.
a. What is the productivity measure of “units of output per dollar of input” averaged over
the four-year period?
14
Productivity = total units produced divided by the total labor cost plus total equipment
cost = 60,000(52)(4)/[13,500(4)+10,000] = 195 hamburgers/dollar
b. We have the option of $13,000 equipment, with an operating life of 5 years. It would
reduce labor costs to $11,000 per year. Should we consider purchasing this equipment
(using productivity arguments alone)?
For the expensive machine, productivity = 60,000(52)(5)/[11,000(5) + 13,000] = 229.4
33. A computer software firm provides a 20′ x 30′ office for its six systems analysts and plans
to hire two additional analysts. To maintain a 100-square-foot working space per analyst,
the firm’s owner-manager is considering expansion. The cost of expansion is $40 per
square foot with annual maintenance costs of $4 per square foot. The useful life of floor
space is 20 years. By how much should employee productivity increase to justify the
additional expenditure? The current salary of the systems analysts is $25,000.
Additional floor space requirement = 30(20)(2)/6 = 200 sq. ft. Annual cost of depreciation
34. A factory produces 10,000 desk staplers each week. The equipment used costs $50,000
and will remain productive for three years. The labor cost per year is $180,000.
a. What is the productivity measure of “units of output per dollar of input” averaged
over the three-year period?
Productivity = total units produced divided by the total labor cost plus total equipment
b. We have the option of buying $80,000 of new equipment, with an operating life of
six years. It would reduce labor costs to $104,000 per year. Should we consider
purchasing this equipment (using productivity arguments alone)?
35. A fast-food restaurant has a drive-through window and during peak lunch times can handle
a maximum of 50 cars per hour with one person taking orders, assembling them, and
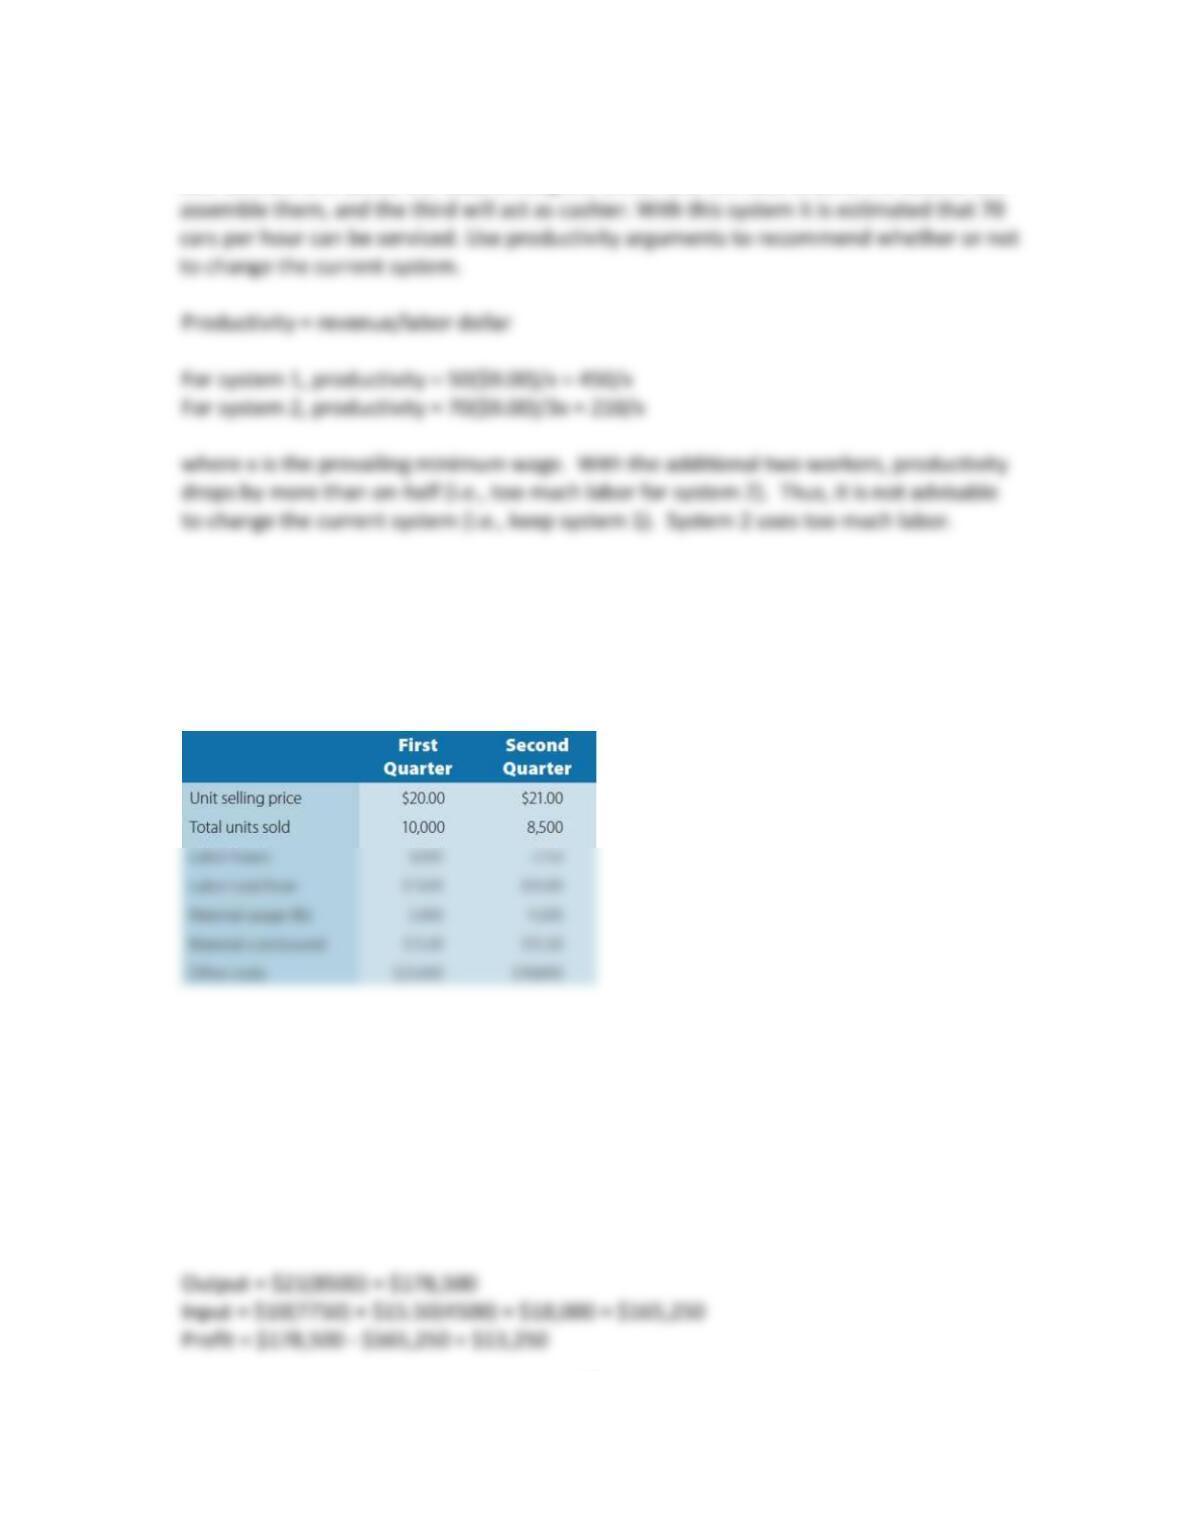
15
acting as cashier. The average sale per order is $9.00. A proposal has been made to add
two workers and divide the tasks among the three. One will take orders, the second will
36. The data shown below apply to the first two quarters of the current year. Using total–
dollar measures of input and output, compare the total profit and productivity achieved
for the two quarters. How does second–quarter productivity compare with the first-
quarter productivity? Use partial-factor productivity to identify what might be done to
improve productivity and profitability during the third quarter.
First Quarter:
Output = $20(10,000) = $200,000
Input = $10(9000) + $15(5000) + $20,000 = $185,000
Profit = $200,000 – $185,000 = $15,000
Productivity = 200,000/185,000 = 1.081
Second Quarter:
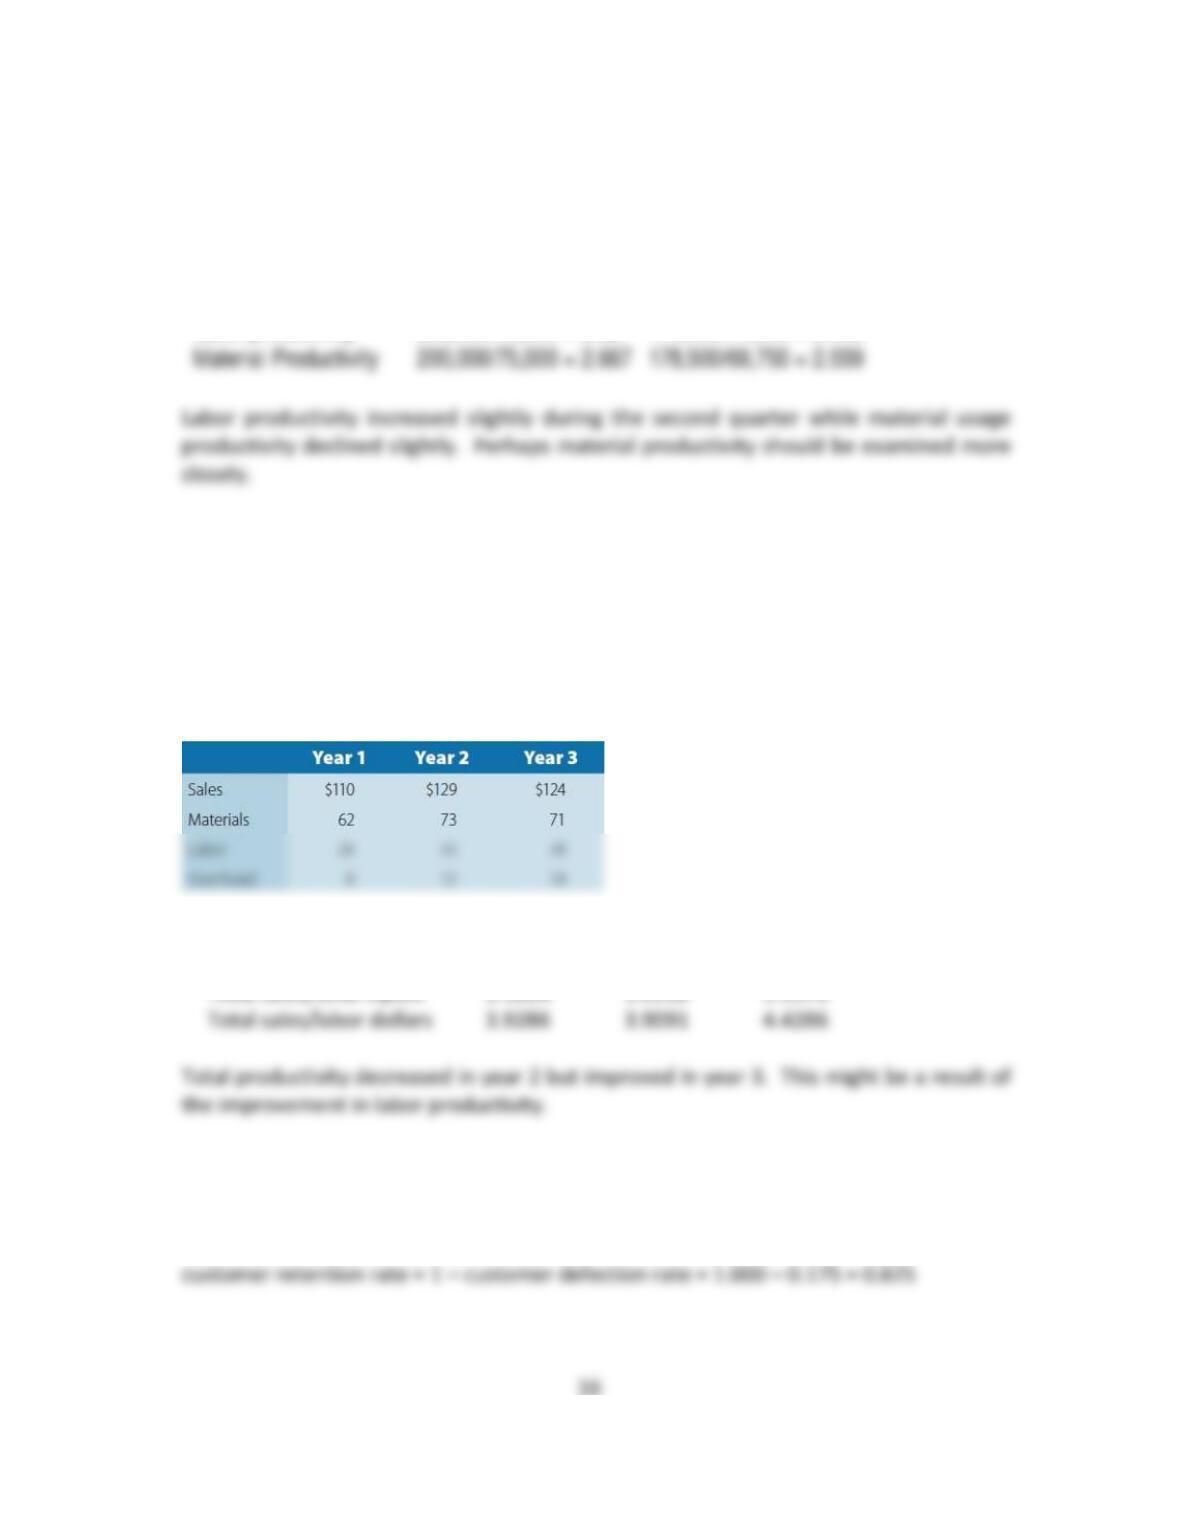
Productivity = 178,500/162,250 = 1.080
Profit has decreased $1,750 during the second quarter; however, overall productivity has
remained about the same.
37. A manufacturing firm uses two measures of productivity:
a. Total sales/Total inputs
b. Total sales/Total labor inputs
Given the data for the last three years below, calculate the productivity ratios. How would
you interpret the results? All figures are in dollars.
The results are:
Year 1 Year 2 Year 3
38. If the customer defection rate is 17.5 percent, what is the customer retention rate?
customer defection rate = 1 − customer retention rate
0.175 = 1 – customer retention rate
First quarter Second quarter
Labor productivity 200,000/90,000 = 2.22 178,500/77,500 = 2.303
17
39. Estimate the value of a loyal customer of a loyal Volvo automobile owner? Assume the
contribution margin is 0.32, the purchase price is $70,000, the repurchase frequency is
40. What is the average value of a loyal customer (VLC) in a target market segment if the
average purchase price is $70 per visit, the frequency of repurchase is every month, the
contribution margin is 20%, and the average customer defection rate is 25%? If a
continuous improvement goal is set of a 20% defection rate next year and 15% two years
from now, what are the revised VLCs over their average buying life?
We can use the logic of the equation: VLC = P*CM*RF*BLC, where P = the revenue per
unit, CM = contribution margin to profit and overhead expressed as a fraction (i.e., 0.45,
41. What is the average defection rate for grocery store shoppers in a local area of a large
city if they spend $50 per visit, shop 52 weeks per year, the grocery store has a 16% gross
contribution margin, and the value of a loyal customer is estimated at $2,000 per year?
VLC = P*CM*RF*BLC = ($50)(.16)(52)(1/DR) = $2,000
42. What is the value of a loyal customer (VLC ) in the small contractor target market segment
who buys an electric drill on average every four years (or every 0.25 year) for $100, when
18
the gross margin on the drill averages 50 percent, and the customer retention rate is 60
percent? What if the customer retention rate increases to 80 percent? What is a 1 percent
change in market share worth to the manufacturer if it represents 100,000 customers?
What do you conclude?
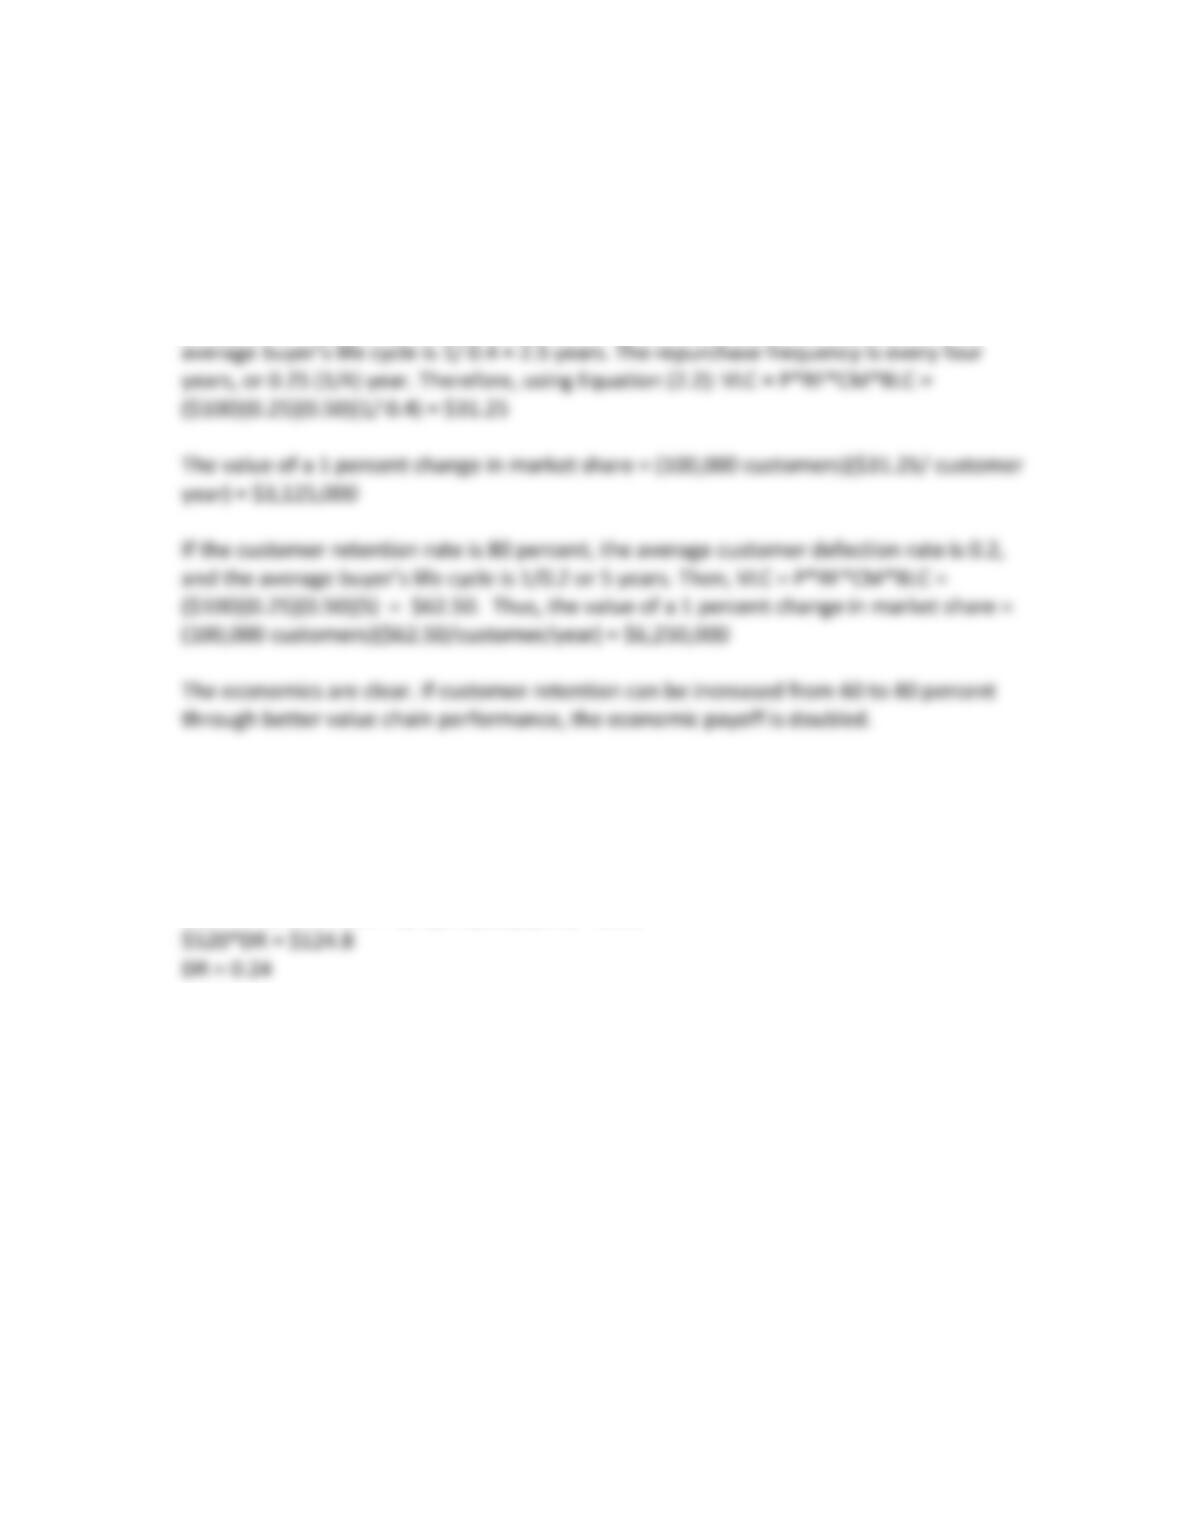
If customer retention rate is 60 percent, the average customer defection rate is (1=
customer retention rate). Thus, the customer defection rate is 40 percent, or 0.4. The
43. If a coffee shops average transaction price is $4.00, their gross margin is 60 percent, the
typical customer makes a purchase once a week or 52 weeks per year, and management
estimates the value of a loyal customer over their buying life cycle as $520, what is the
customer defection rate?
VLC = P*CM*RF*BLC = ($4)(0.6)(52)(1/DR) = $520
EXCEL-BASED PROBLEMS
For these problems, you may use Excel or the spreadsheet templates in MindTap to assist in
your analysis.
Note to instructors: You might want to review how to generate charts using Excel.
44. A key hospital outcome measure of clinical performance is length of stay (LOS); that is, the
number of days a patient is hospitalized. For patients at one hospital with acute
myocardial infarction (heart attack), the length of stay over the past four years has
consistently decreased. The hospital also has data for various treatment options such as
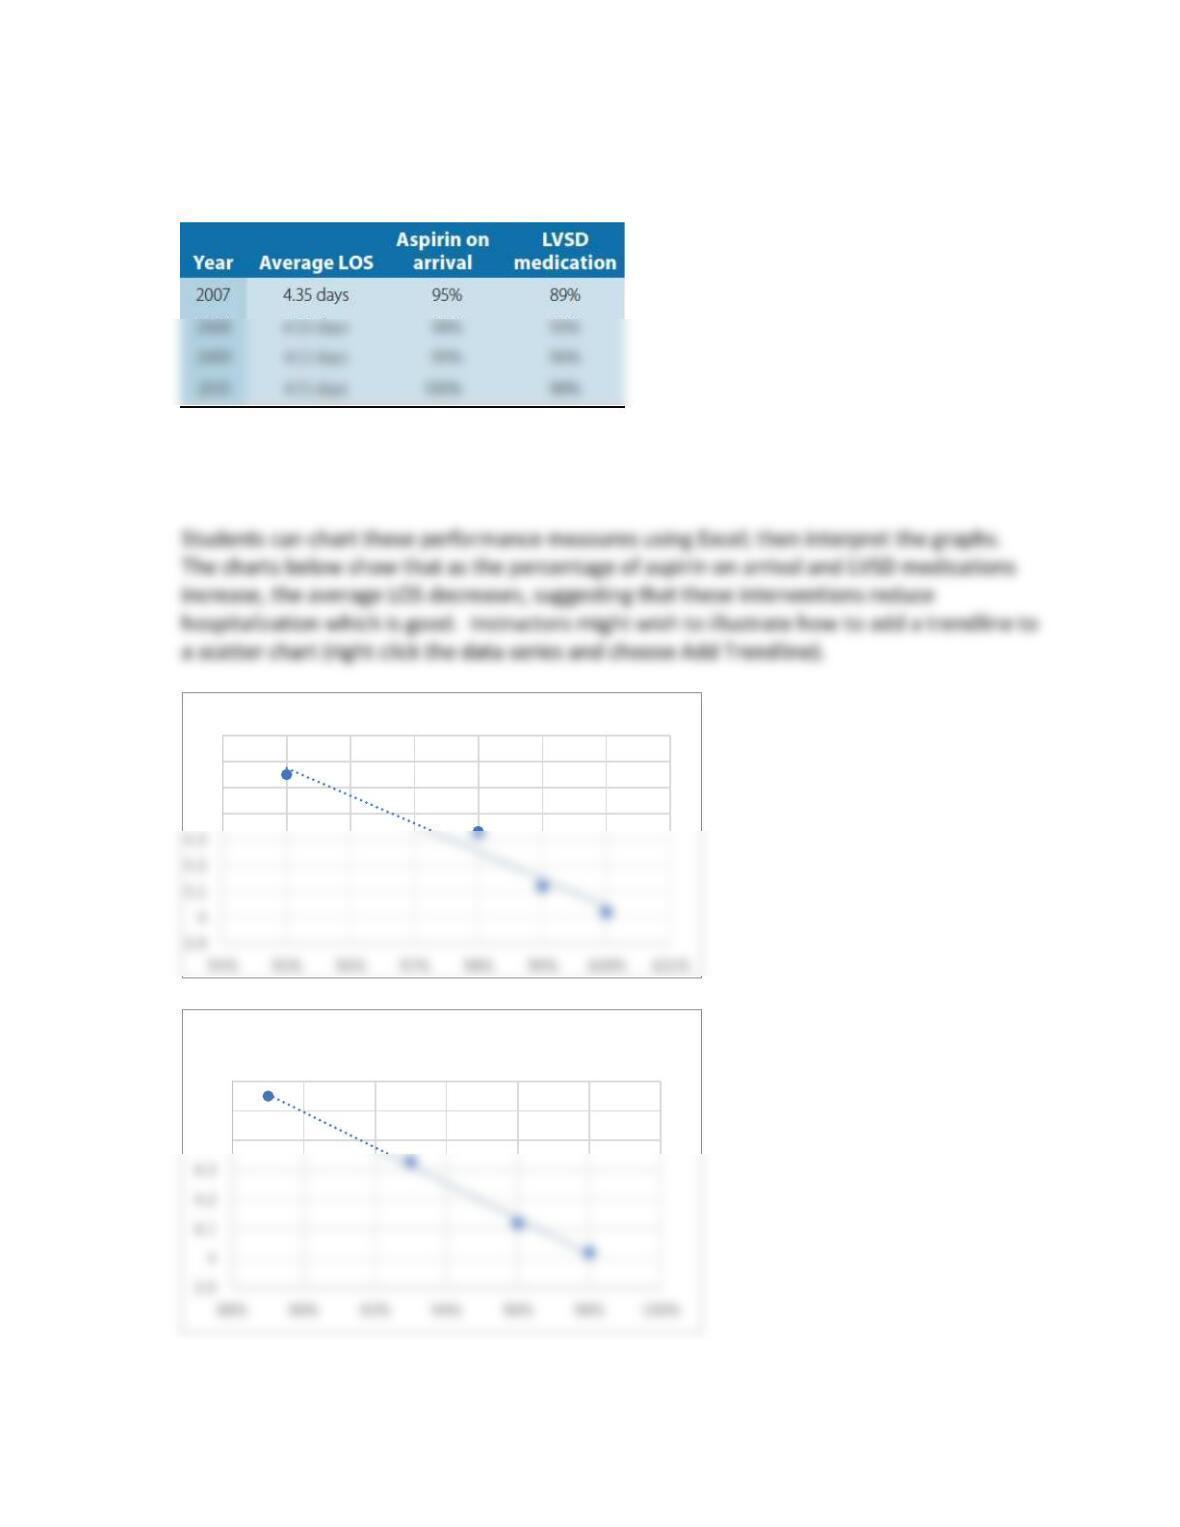
19
the percentage of patients who received aspirin upon arrival and cardiac medication for
Left Ventricular Systolic Dysfunction (LVSD). The data are shown below:
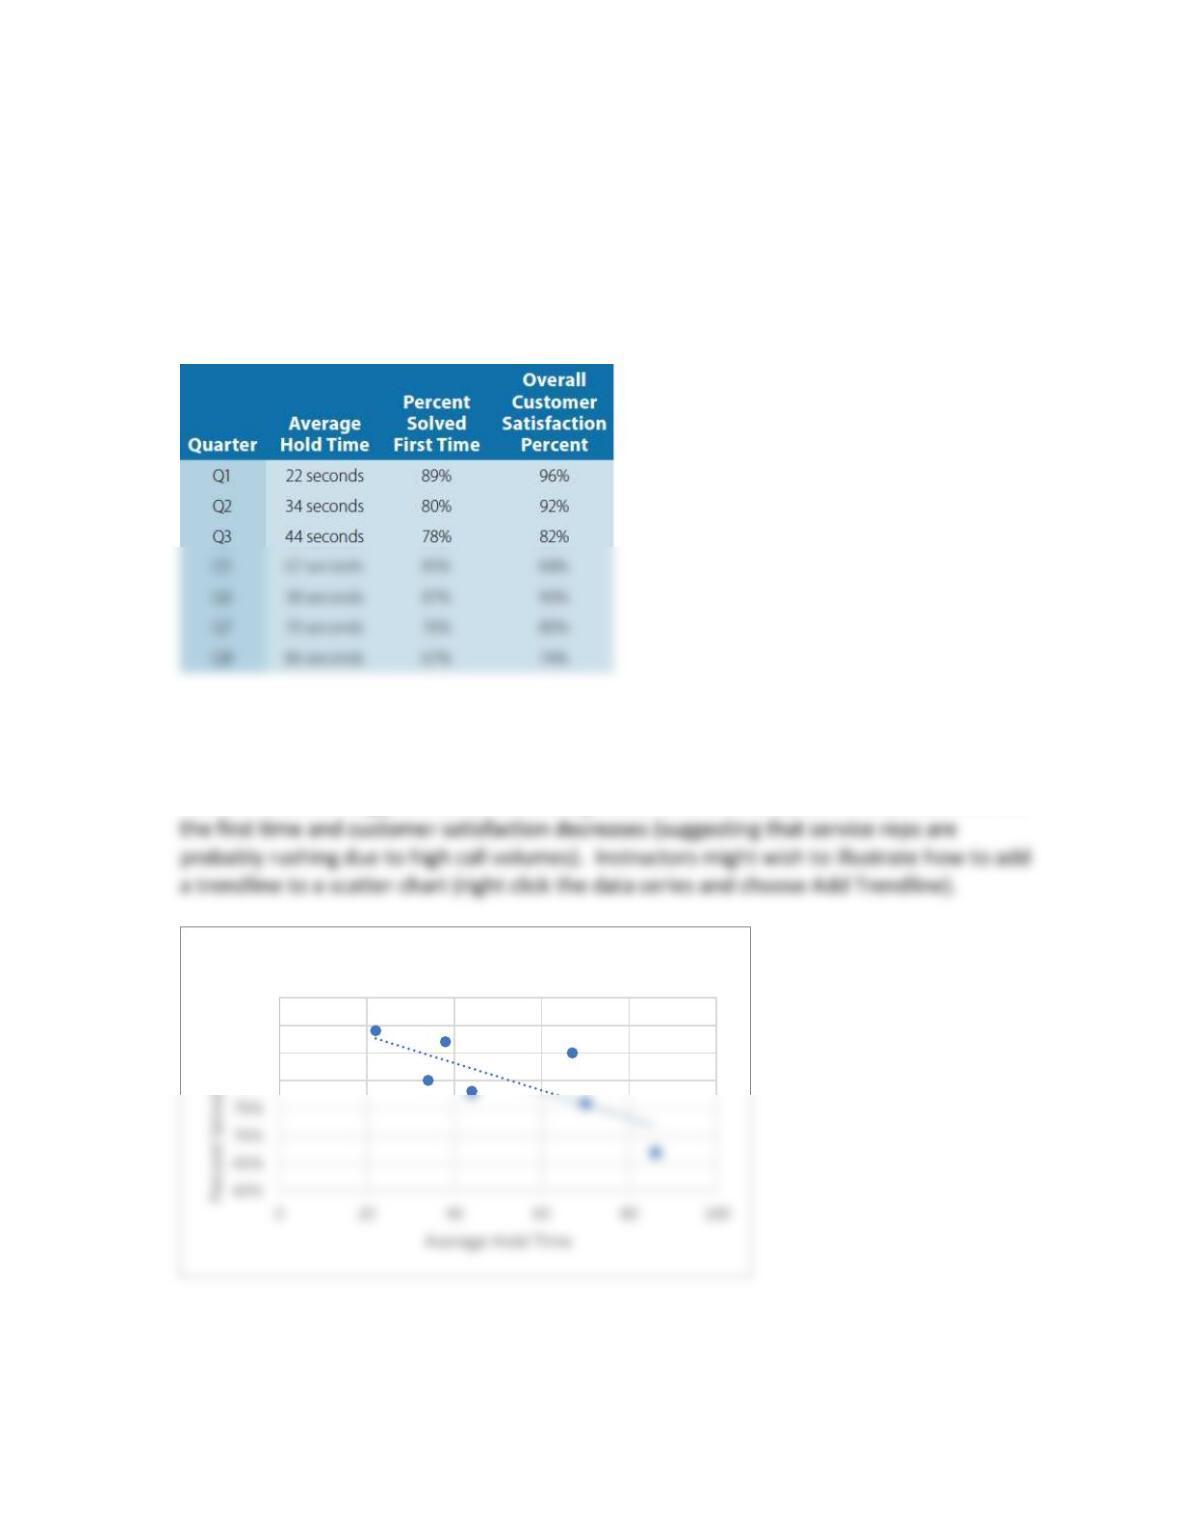
Illustrate the interlinking relationships by constructing scatter charts using Excel showing
the LOS as a function of the other variables. What do these models tell you?
4.4
4.5
4.6
4.7
LOS vs Aspirin on Arrival
4.4
4.5
4.6
LOS vs. LVSD Medication
20
45. Customers call a call center to make room reservations for a small chain of 42 motels
located throughout the southwestern part of the United States. Business analytics is used
to determine how and if the following performance metrics are related: time by quarter,
average time on hold (seconds) before a customer reaches a company customer service
representative, percent of time the customer inquiry is solved the first time (called first
pass quality) and customer satisfaction with the overall call center experience.
Develop a graphical interlinking model by constructing scatter charts using Excel showing
the relationships between each pair of variables. What do results tell you?
The charts below suggest that as the average hold time increases, both the percent solved
80%
85%
90%
95%
Percent Solved vs Hold Time