CHAPTER 2
Probability Concepts and Applications
TEACHING SUGGESTIONS
Teaching Suggestion 2.1: Concept of Probabilities Ranging From 0 to 1.
People often misuse probabilities by such statements as, “I’m 110% sure we’re going to win the
big game.” The two basic rules of probability should be stressed.
Teaching Suggestion 2.2: Where Do Probabilities Come From?
Students need to understand where probabilities come from. Sometimes they are subjective and
Teaching Suggestion 2.3: Confusion Over Mutually Exclusive and Collectively Exhaustive Events.
This concept is often foggy to even the best of students—even if they just completed a course in
Teaching Suggestion 2.4: Addition of Events That Are Not Mutually Exclusive.
The formula for adding events that are not mutually exclusive is P(A or B) = P(A) + P(B) – P(A
and B). Students must understand why we subtract P(A and B). Explain that the intersect has
been counted twice.
Teaching Suggestion 2.5: Statistical Dependence with Visual Examples.
Figure 2.3 indicates that an urn contains 10 balls. This example works well to explain conditional
Teaching Suggestion 2.6: Concept of Random Variables.
Students often have problems understanding the concept of random variables. Instructors need to
Teaching Suggestion 2.7: Expected Value of a Probability Distribution.
Teaching Suggestion 2.8: Bell-Shaped Curve.
Stress how important the normal distribution is to a large number of processes in our lives (for
example, filling boxes of cereal with 32 ounces of cornflakes). Each normal distribution depends
on the mean and standard deviation. Discuss Figures 2.8 and 2.9 to show how these relate to the
shape and position of a normal distribution.
Teaching Suggestion 2.9: Three Symmetrical Areas Under the Normal Curve.
Figure 2.14 is very important, and students should be encouraged to truly comprehend the
Teaching Suggestion 2.10: Using the Normal Table to Answer Probability Questions.
The IQ example in Figure 2.10 is a particularly good way to treat the subject since everyone can
relate to it. Students are typically curious about the chances of reaching certain scores. Go
ALTERNATIVE EXAMPLES
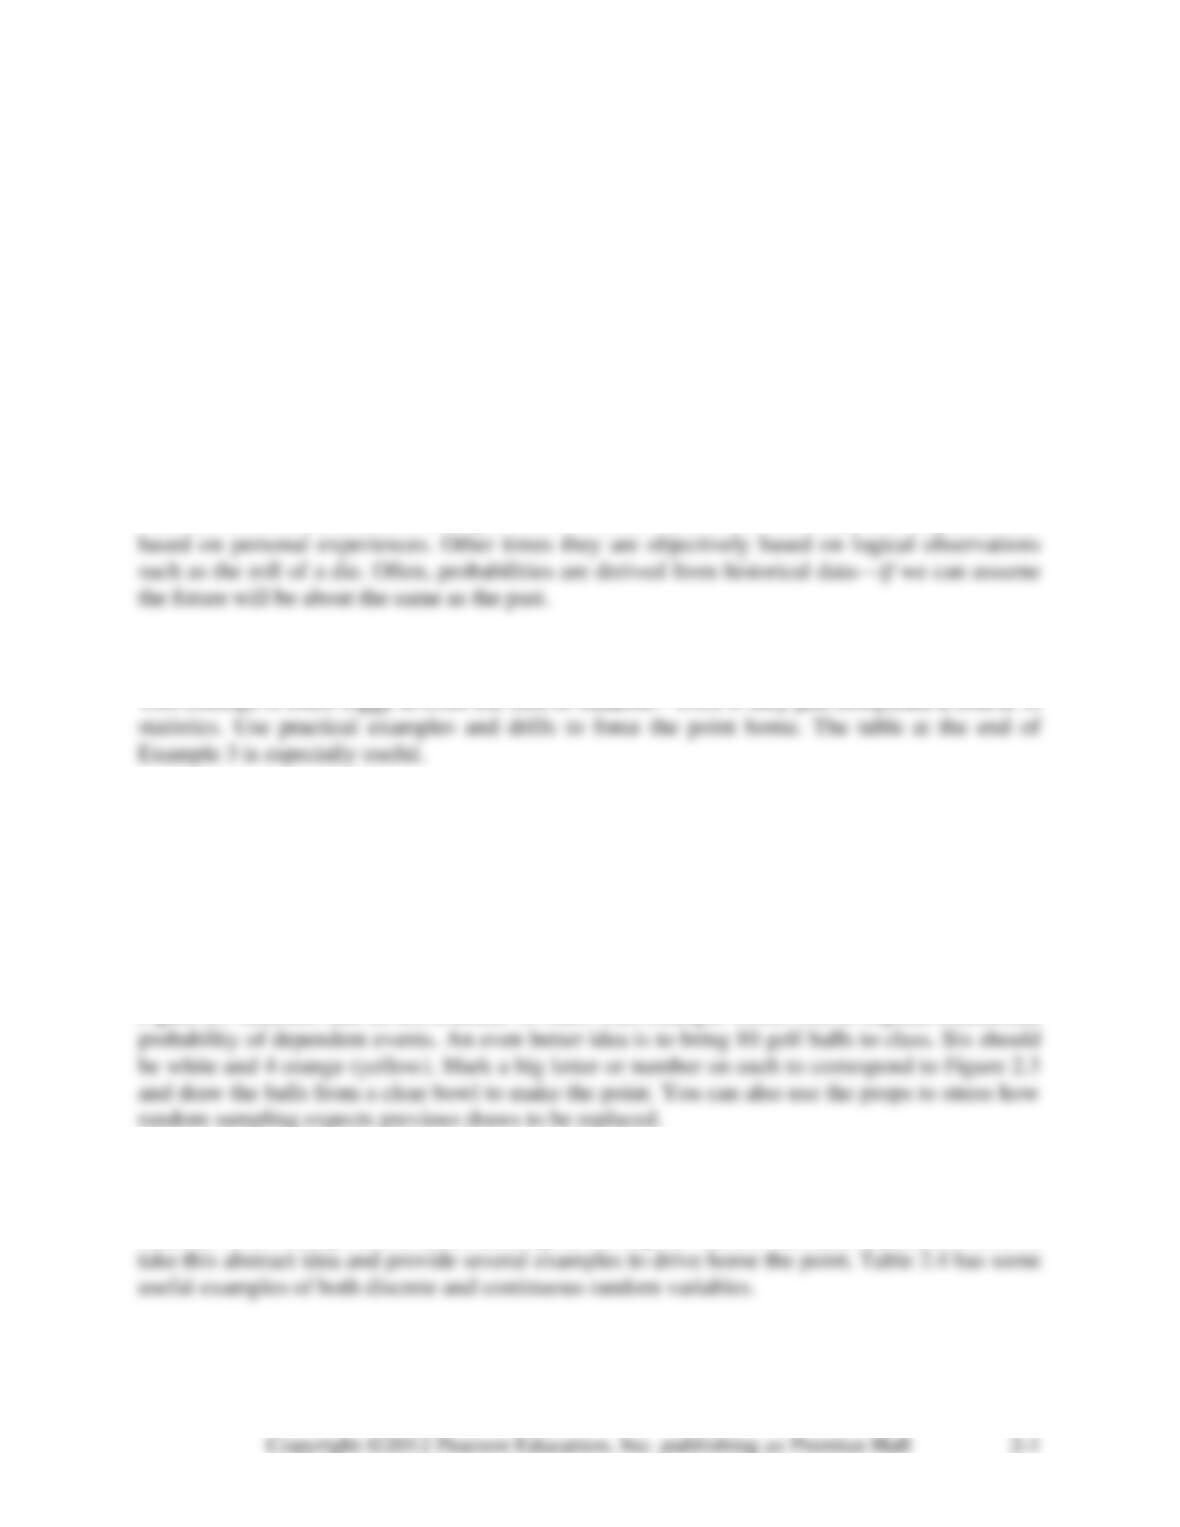
Alternative Example 2.1: In the past 30 days, Roger’s Rural Roundup has sold either 8, 9, 10,
or 11 lottery tickets. It never sold fewer than 8 nor more than 11. Assuming that the past is
similar to the future, here are the probabilities:
Sales
No. Days
Probability
8
10
0.333
9
12
0.400
10
0.200
11
0.067
Total
30
1.000
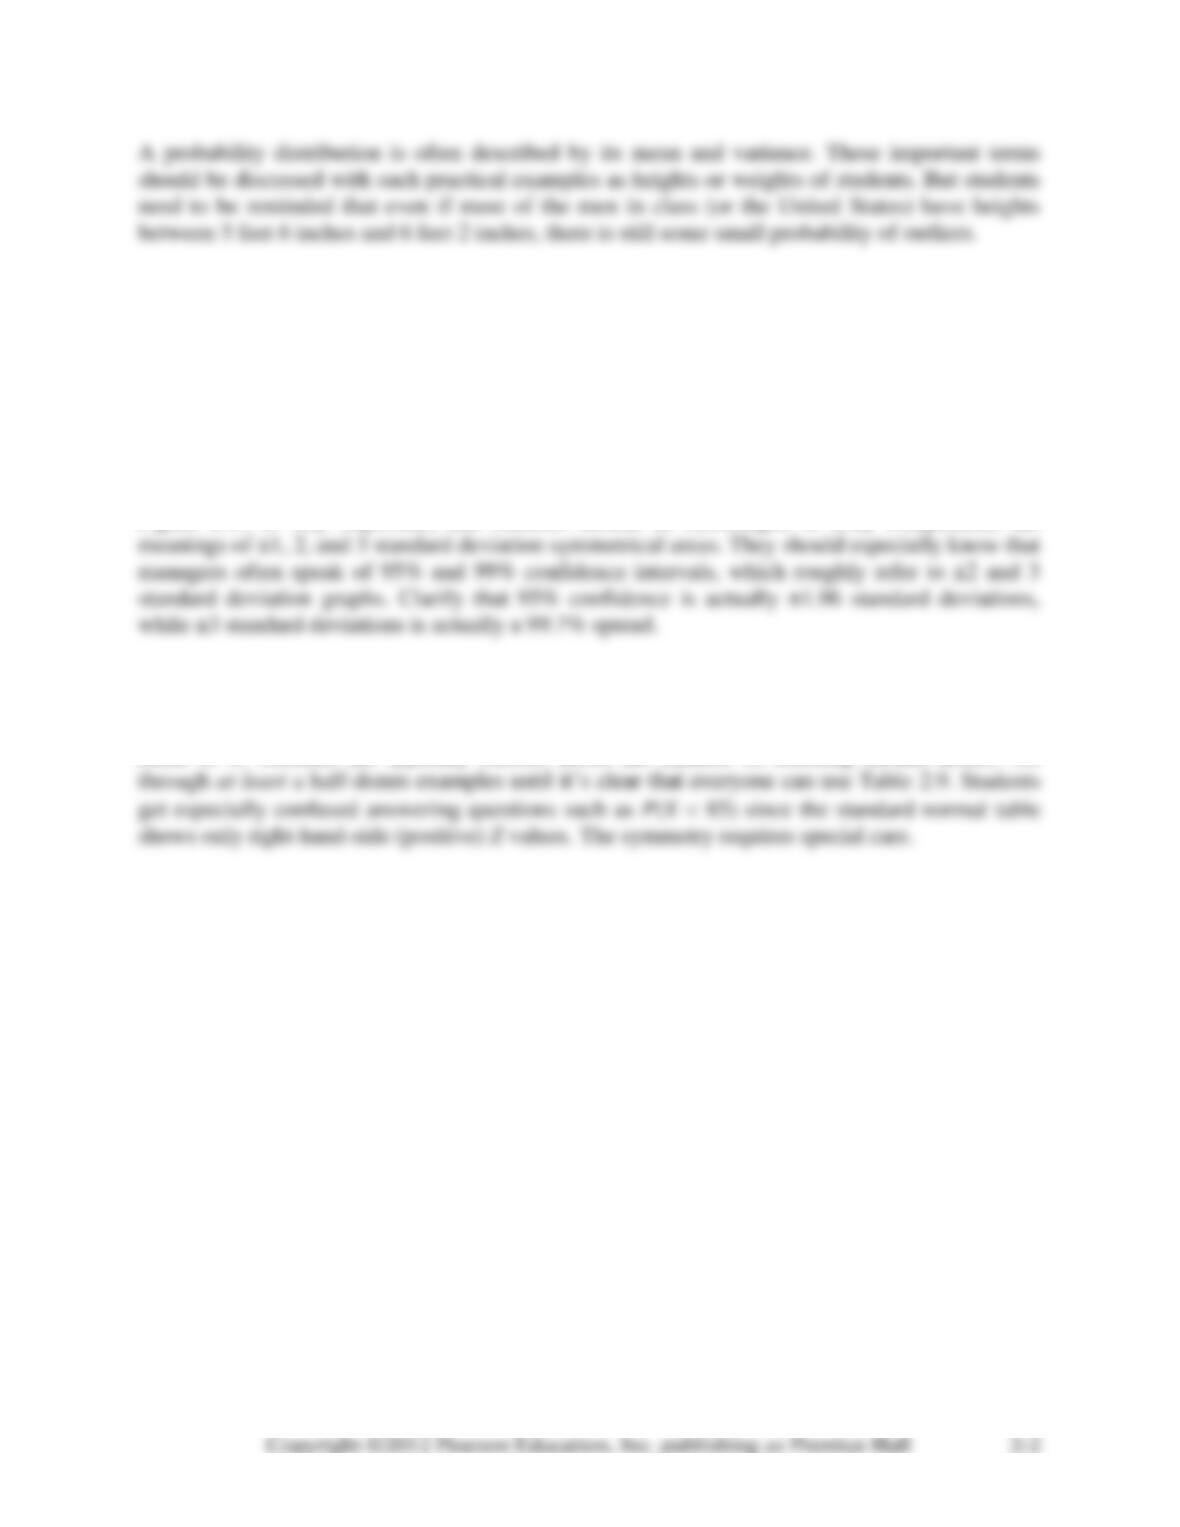
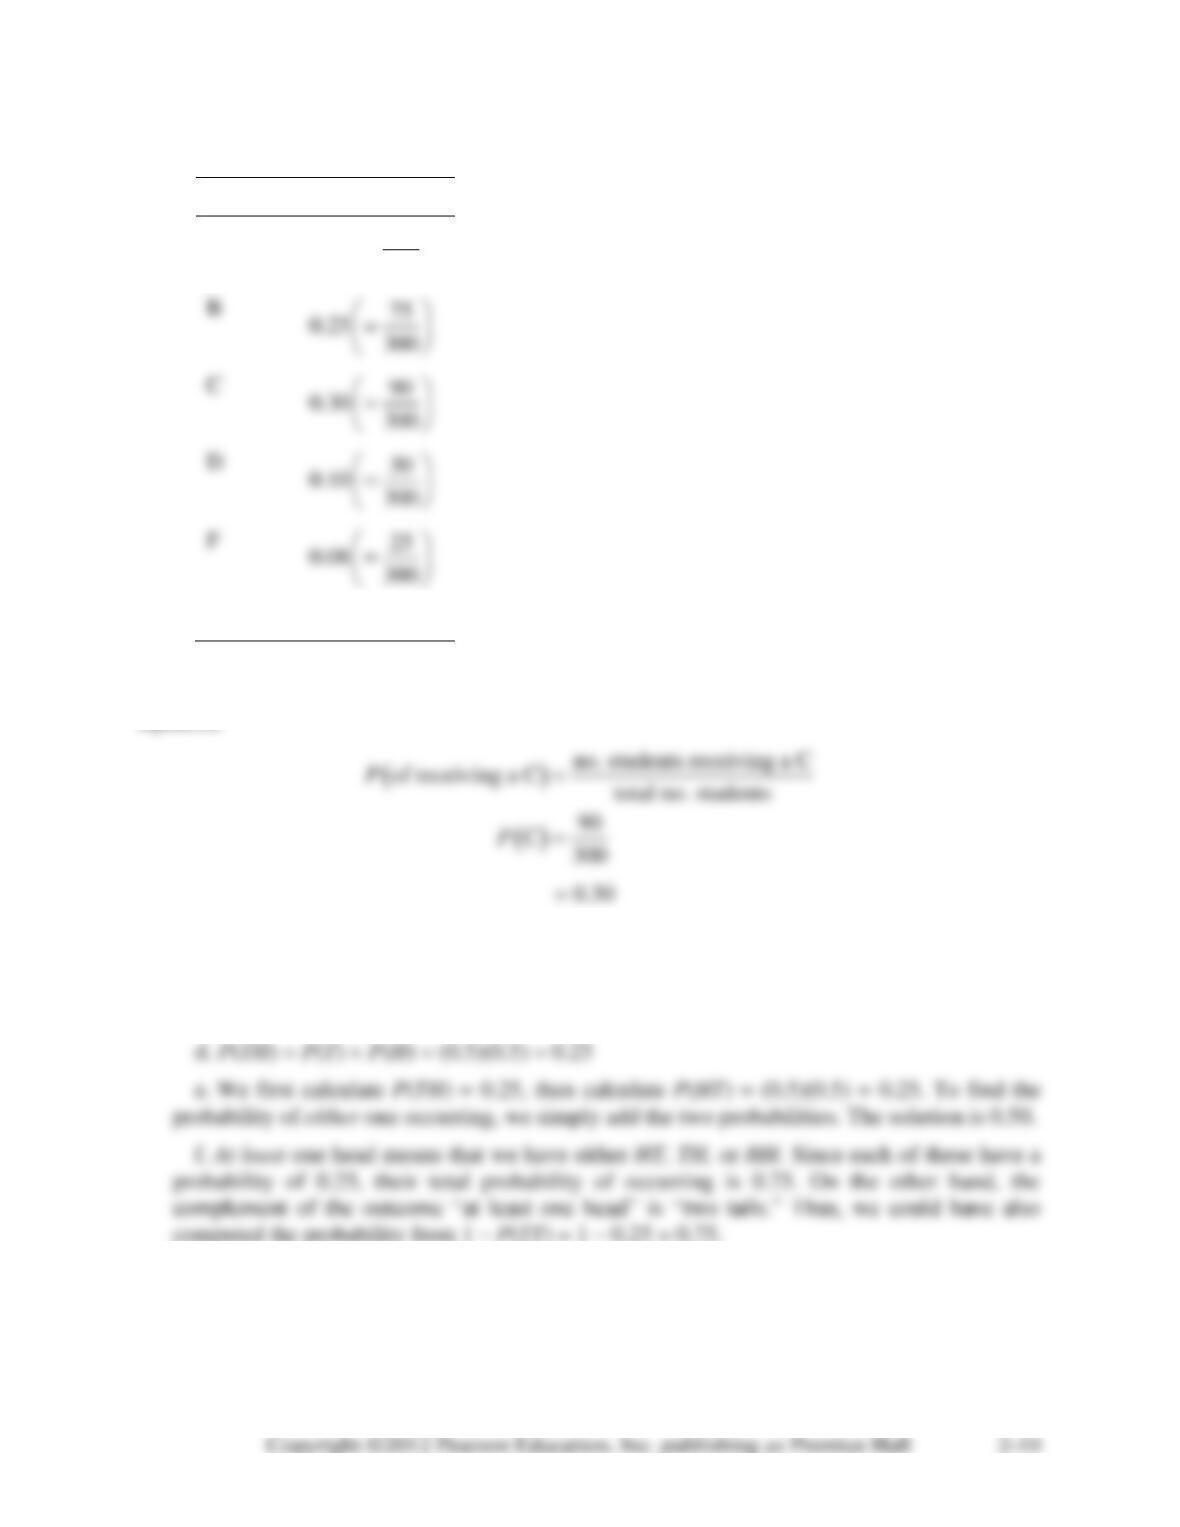
Alternative Example 2.2: Grades received for a course have a probability based on the
professor’s grading pattern. Here are Professor Ernie Forman’s BA205 grades for the past five
years.
Outcome
Probability
A
0.25
B
0.30
C
0.35
D
0.03
0.02
0.05
1.00
These grades are mutually exclusive and collectively exhaustive.
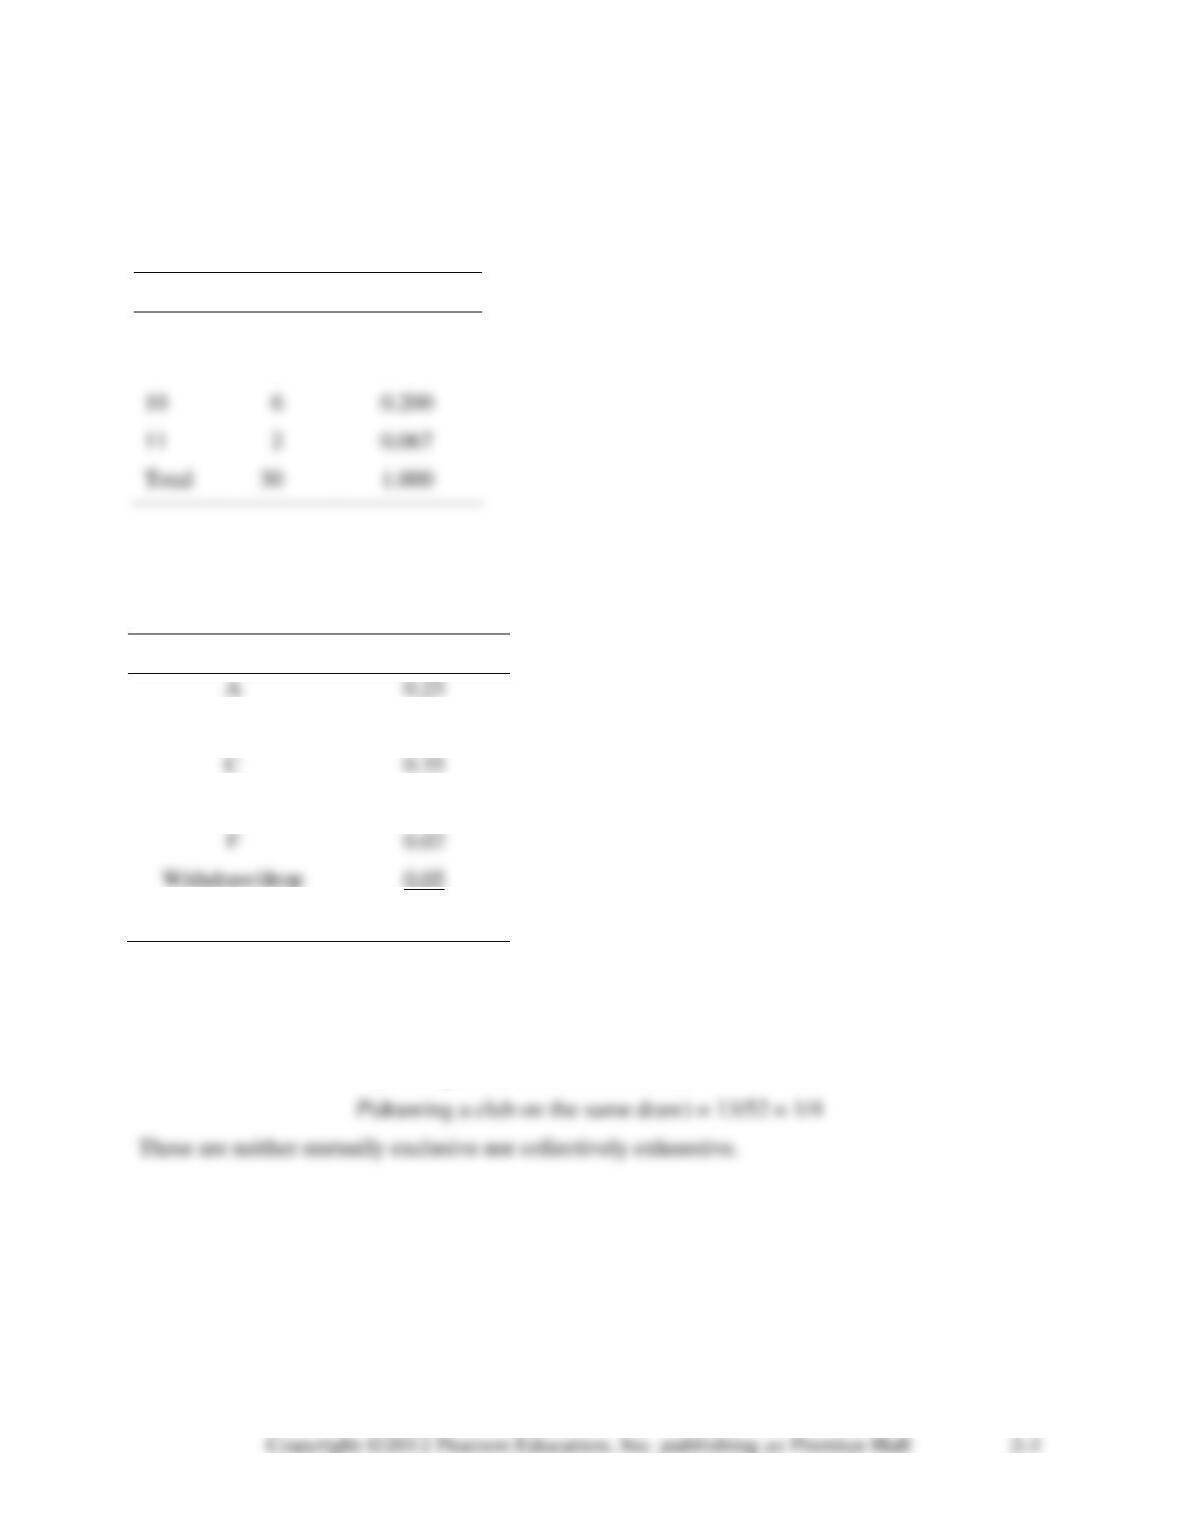
Alternative Example 2.3:
P(drawing a 3 from a deck of cards) = 4/52 = 1/13
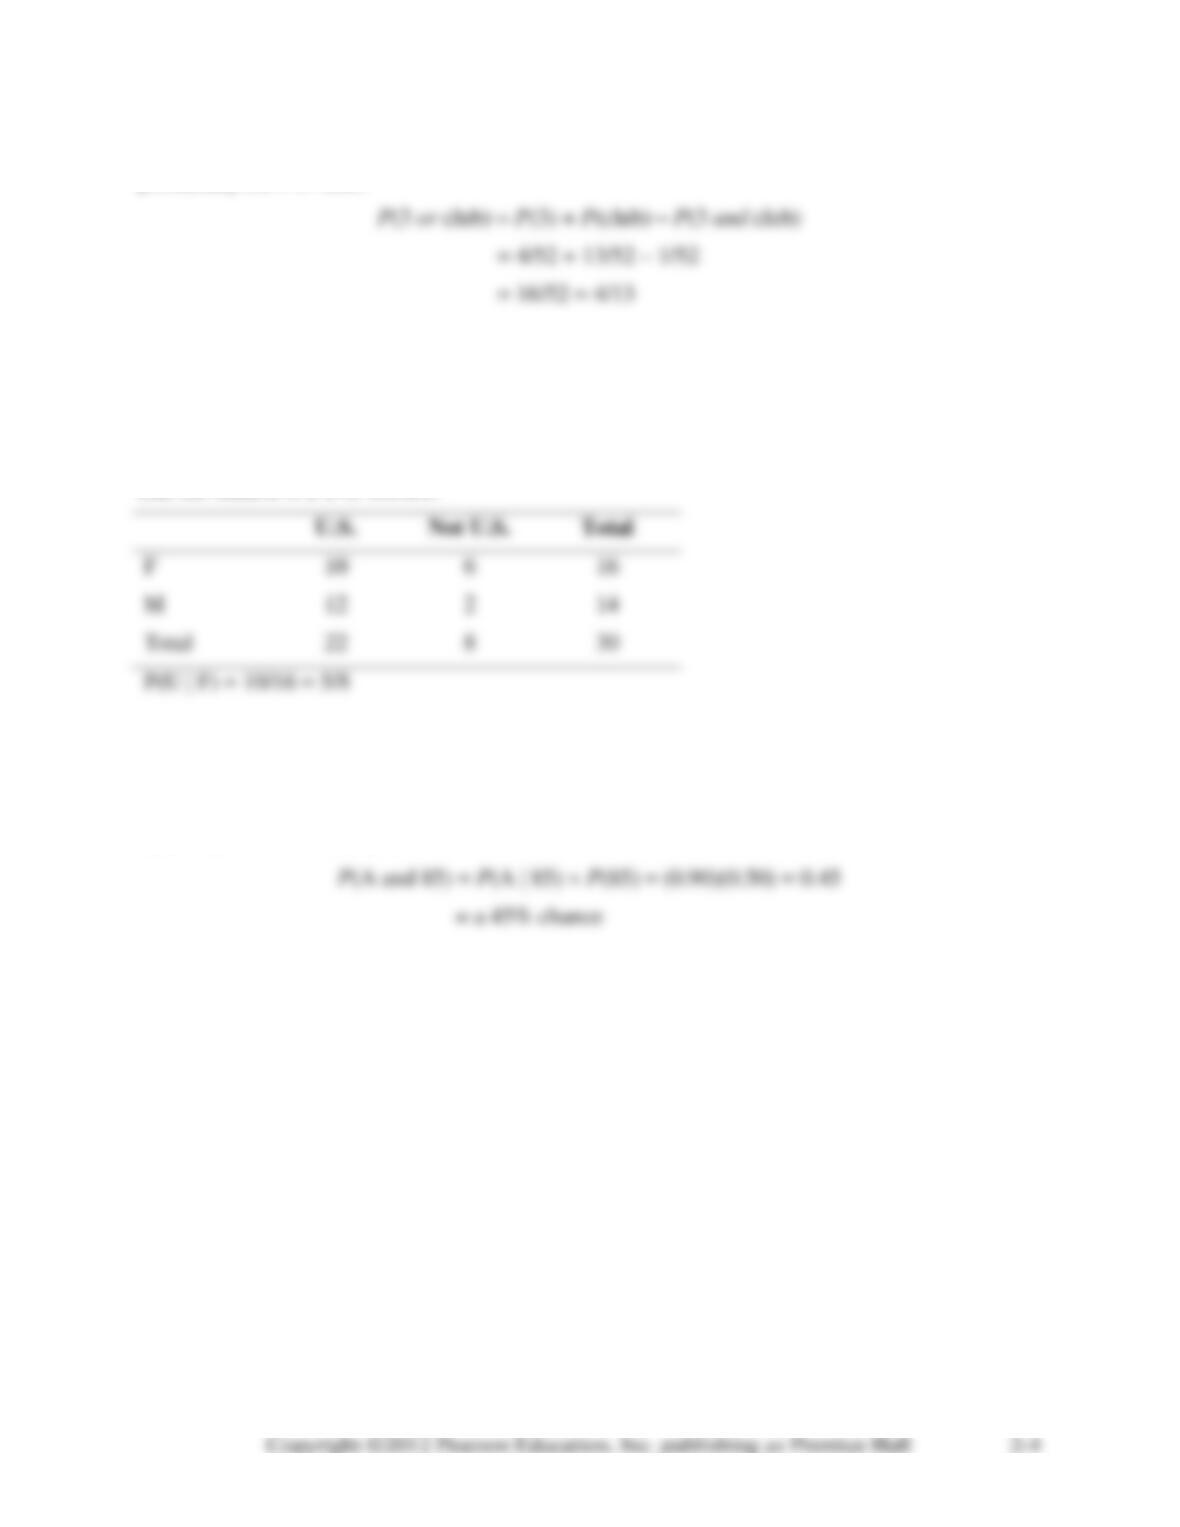
Alternative Example 2.4: In Alternative Example 2.3 we looked at 3s and clubs. Here is the
probability for 3 or club:
Alternative Example 2.5: A class contains 30 students. Ten are female (F) and U.S. citizens
(U); 12 are male (M) and U.S. citizens; 6 are female and non-U.S. citizens (N); 2 are male and
non-U.S. citizens.
A name is randomly selected from the class roster and it is female. What is the probability
that the student is a U.S. citizen?
Alternative Example 2.6: Your professor tells you that if you score an 85 or better on your
midterm exam, there is a 90% chance you’ll get an A for the course. You think you have only a
50% chance of scoring 85 or better. The probability that both your score is 85 or better and you
receive an A in the course is
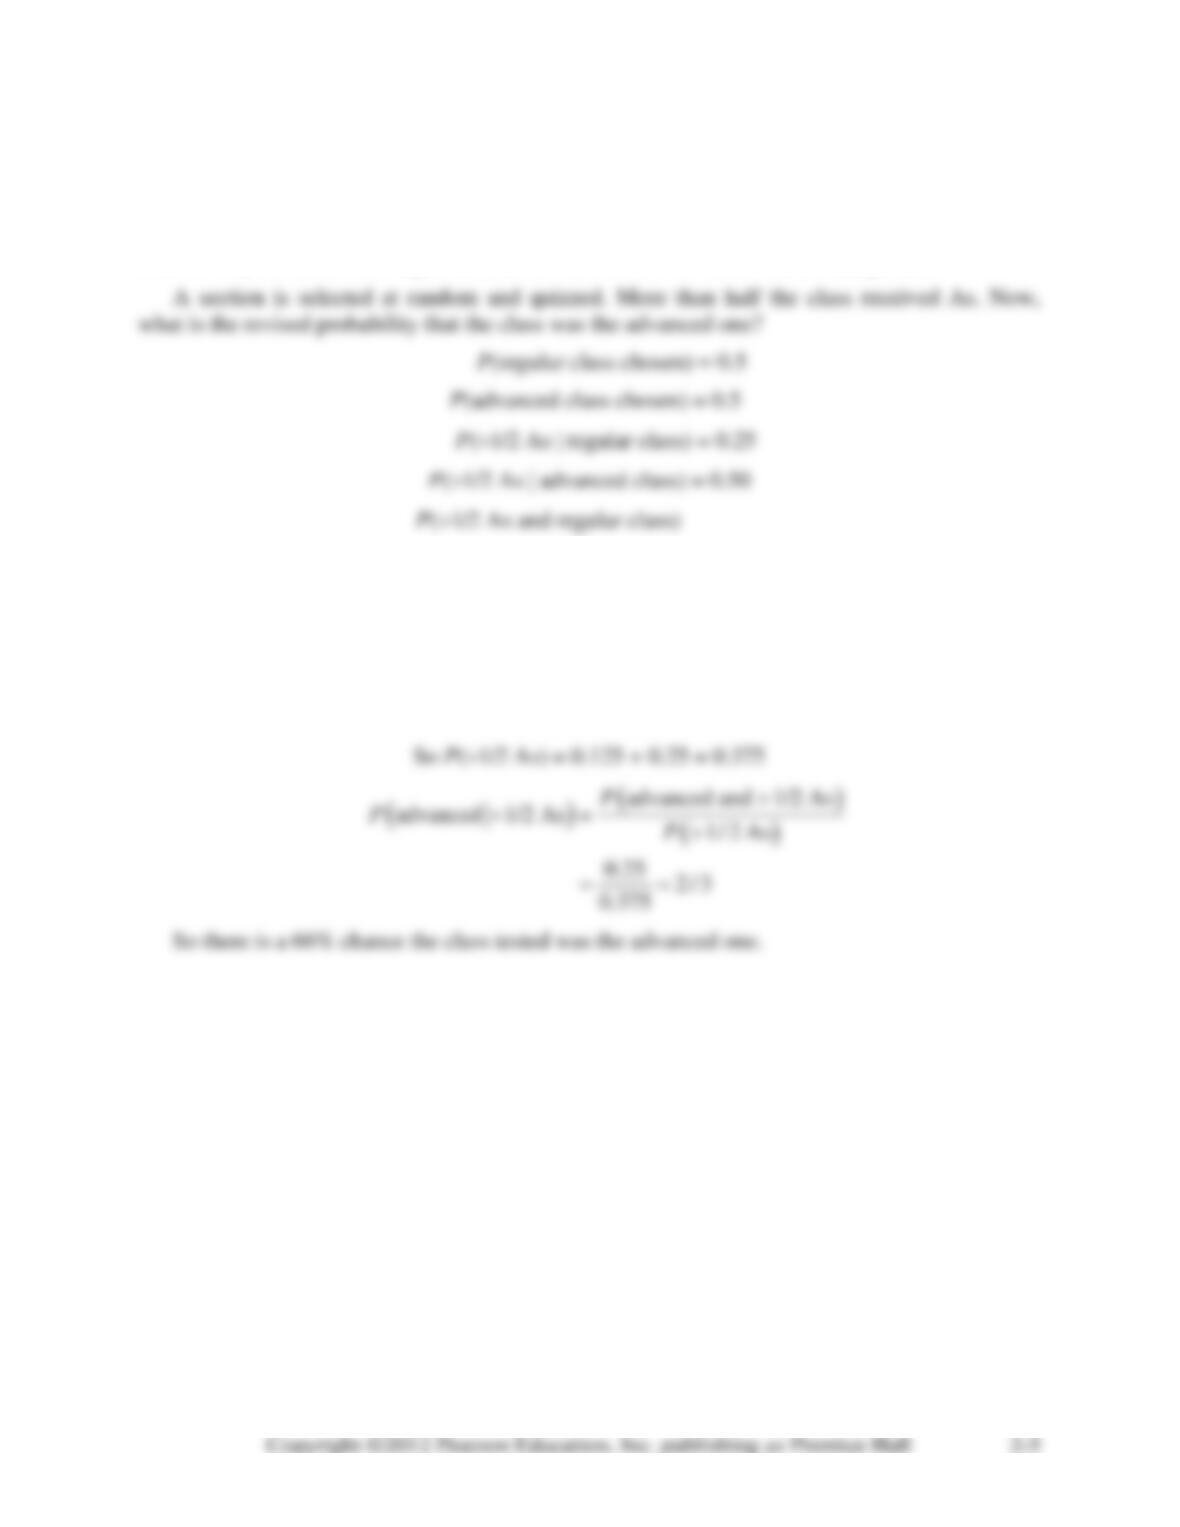
Alternative Example 2.7: An instructor is teaching two sections (classes) of calculus. Each
class has 24 students, and on the surface, both classes appear identical. One class, however,
consists of students who have all taken calculus in high school. The instructor has no idea which
class is which. She knows that the probability of at least half the class getting As on the first
exam is only 25% in an average class, but 50% in a class with more math background.
= P(1/2 As regular ) P(regular)
= (0.25)(0.50) = 0.125
P(1/2 As and advanced class)
= P(1/2 As advanced) P(advanced)
= (0.50)(0.5) = 0.25
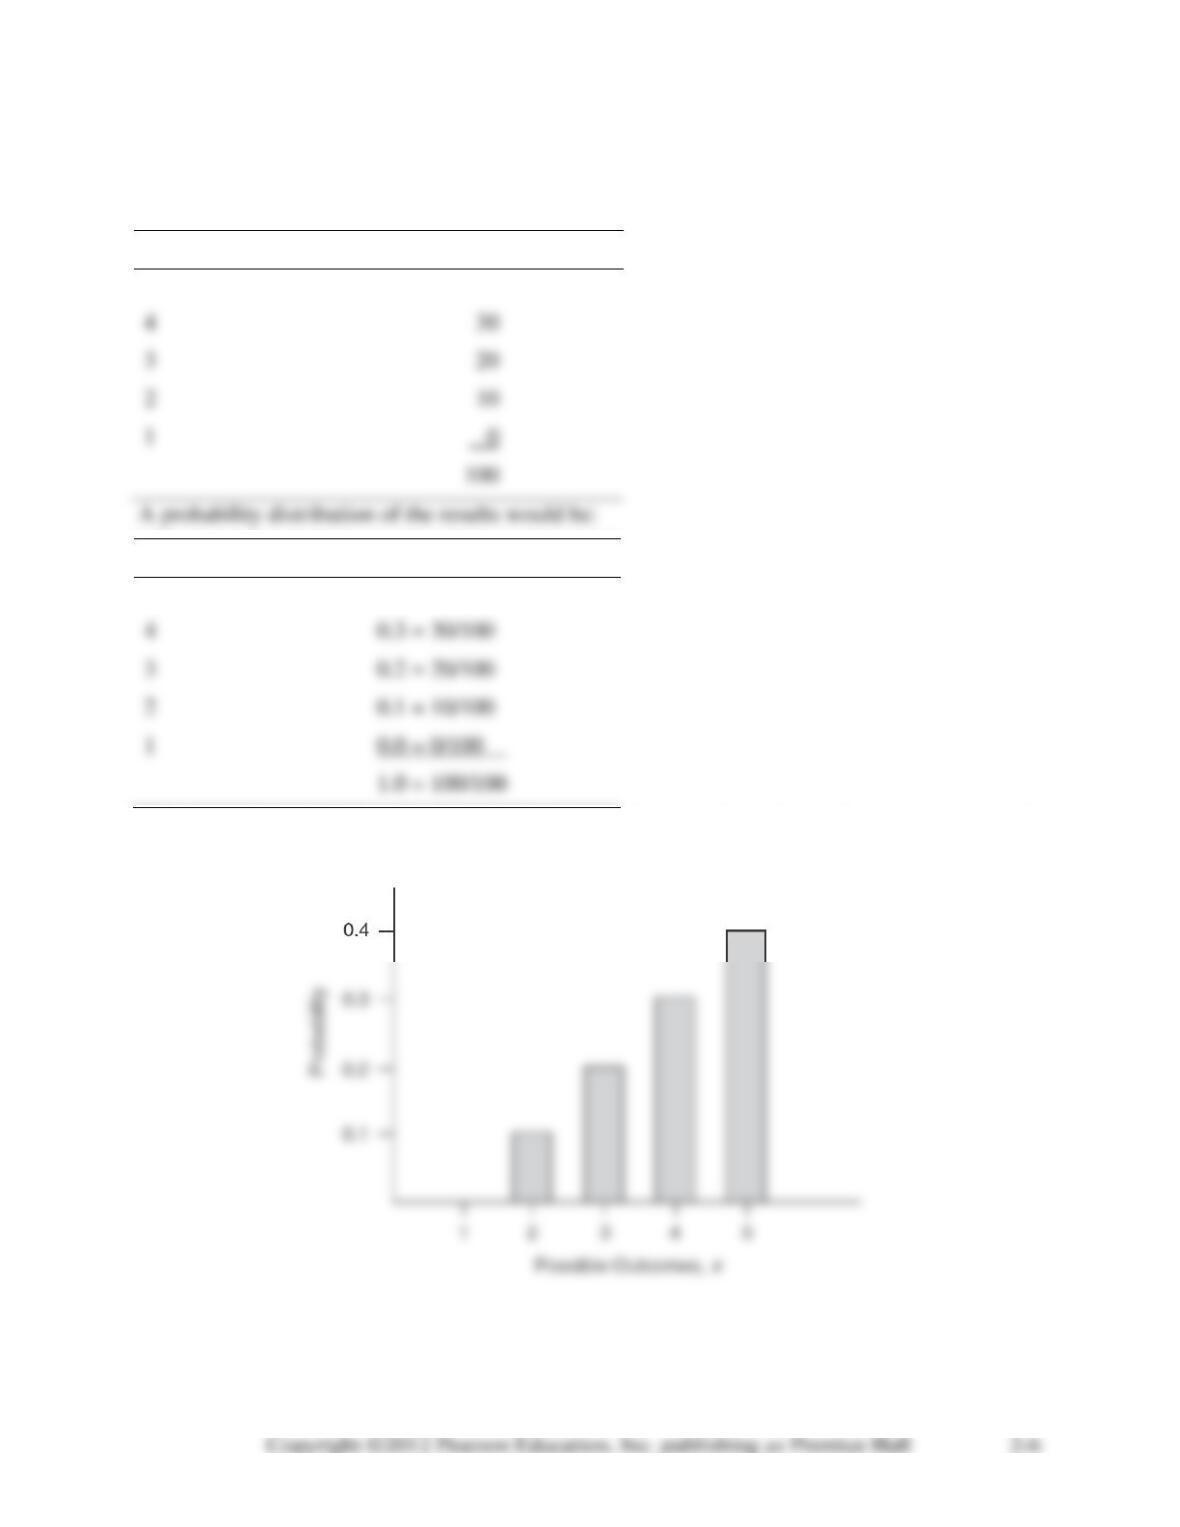
Alternative Example 2.8: Students in a statistics class were asked how many “away” football
games they expected to attend in the upcoming season. The number of students responding to
each possibility is shown below:
Number of games
Number of students
5
40
4
30
3
20
2
10
1
Number of games
Probability P(X)
5
0.4 = 40/100
4
0.3 = 30/100
3
0.2 = 20/100
2
0.1 = 10/100
1
0.0 = 0/100
This discrete probability distribution is computed using the relative frequency approach.
Probabilities are shown in graph form below.

Alternative Example 2.9: Here is how the expected outcome can be computed for the question
in Alternative Example 2.8.
Alternative Example 2.10: Here is how variance is computed for the question in Alternative
Example 2.8:
( )
( )
( )
52
1
variance ii
i
x E x P x
=
=−
The standard deviation is
variance
1
=
=
= 1
Alternative Example 2.11: The length of the rods coming out of our new cutting machine can
be said to approximate a normal distribution with a mean of 10 inches and a standard deviation
of 0.2 inch. Find the probability that a rod selected randomly will have a length
a. of less than 10.0 inches
b. between 10.0 and 10.4 inches
First compute the standard normal distribution, the Z-value:
x
z
−
=
Next, find the area under the curve for the given Z-value by using a standard normal distribution
table.
a. P(x 10.0) = 0.50000
SOLUTIONS TO DISCUSSION QUESTIONS AND PROBLEMS
2-1. There are two basic laws of probability. First, the probability of any event or state of nature
2-2. Events are mutually exclusive if only one of the events can occur on any one trial. Events
are collectively exhaustive if the list of outcomes includes every possible outcome. An example
of mutually exclusive events can be seen in flipping a coin. The outcome of any one trial can
2-3. Probability values can be determined both objectively and subjectively. When determining
2-4. The probability of the intersection of two events is subtracted in summing the probability of
2-5. When events are dependent, the occurrence of one event does have an effect on the
probability of the occurrence of the other event. When the events are independent, on the other
2-6. Bayes’ theorem is a probability relationship that allows new information to be incorporated
2-7. A Bernoulli process has two possible outcomes, and the probability of occurrence is
constant from one trial to the next. If n independent Bernoulli trials are repeated and the number
of outcomes (successes) are recorded, the result is a binomial distribution.
2-8. A random variable is a function defined over a sample space. There are two types of
random variables: discrete and continuous.
2-9. A probability distribution is a statement of a probability function that assigns all the
probabilities associated with a random variable. A discrete probability distribution is a
2-11. The variance is a measure of the dispersion of the distribution. The variance of a discrete
probability distribution is computed by the formula
2 = [X – E(X)]2P(X)
2-12. The purpose of this question is to have students name three business processes they know
2-13. This is an example of a discrete probability distribution. It was most likely computed using
2-14.
Grade
Probability
A
80
0.27 300
=
30
=
1.0
Thus, the probability of a student receiving a C in the course is 0.30 = 30%.
The probability of a student receiving a C may also be calculated using the following
equation:
2-15. a. P(H) = 1/2 = 0.5
b. P(T H) = P(T) = 0.5
c. P(TT) = P(T) P(T) = (0.5)(0.5) = 0.25
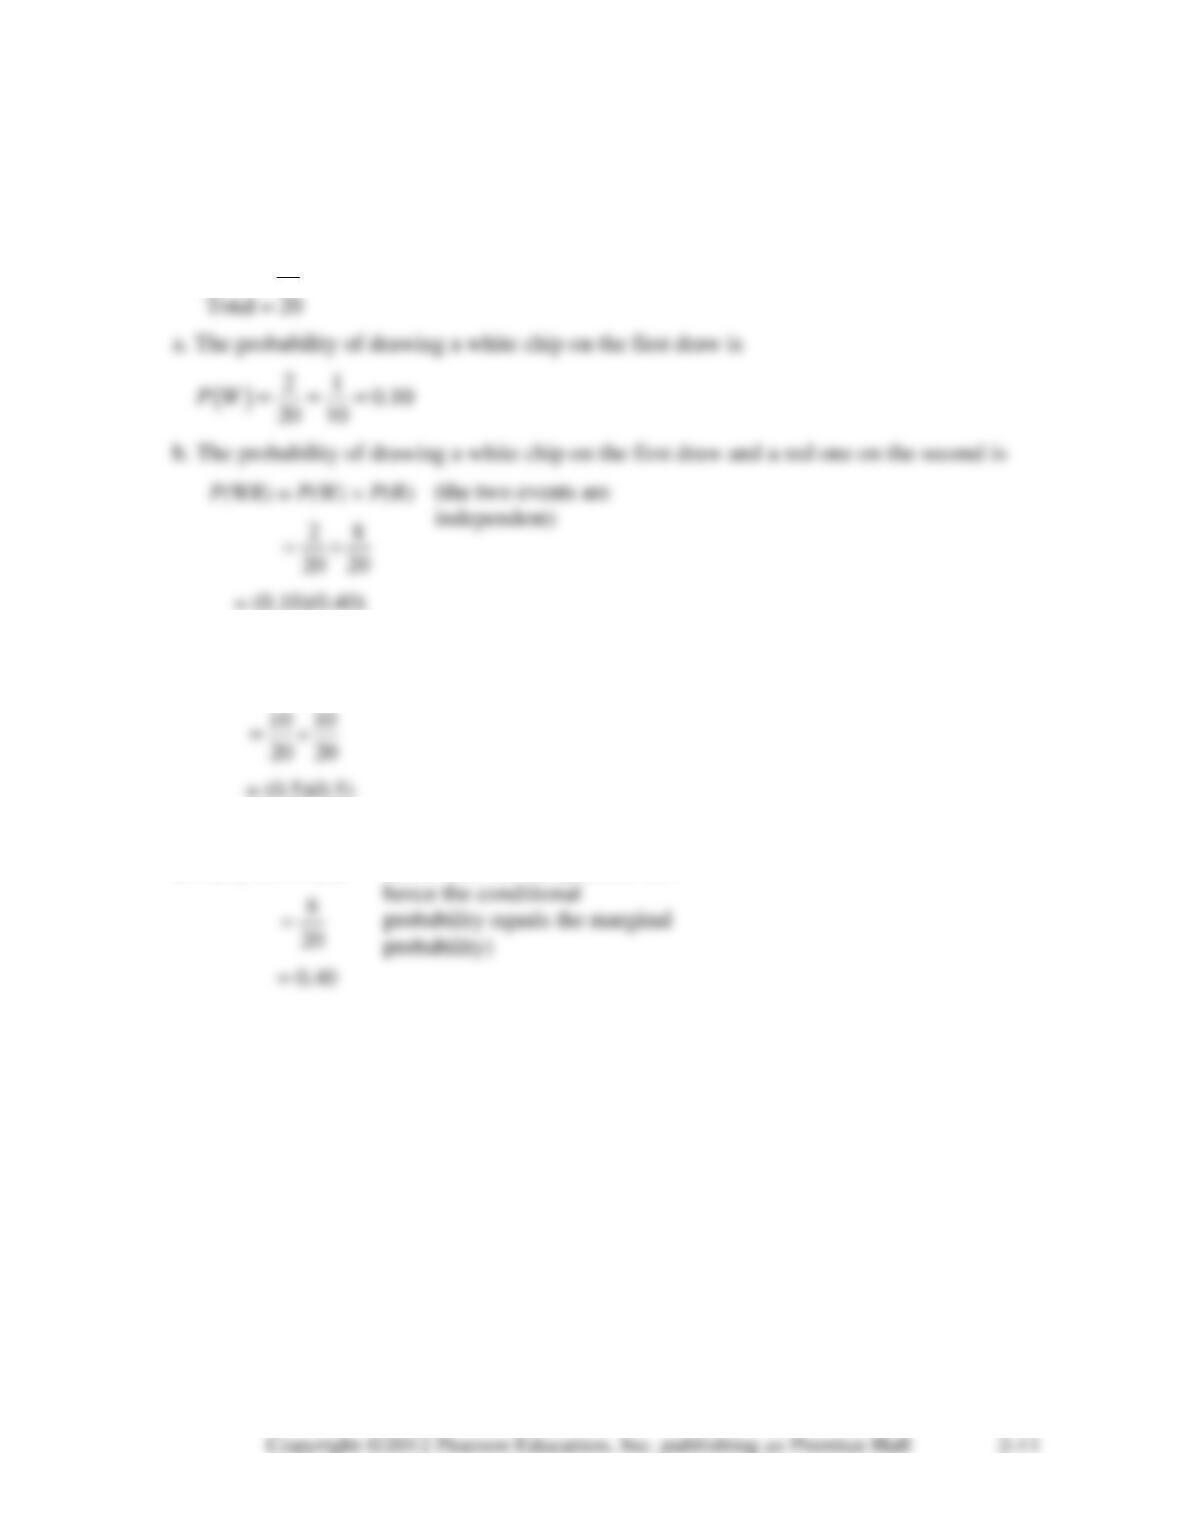
2-16. The distribution of chips is as follows:
Red 8
Green 10
White 2
= 0.04
c. P(GG) = P(G) P(G)
= 0.25
d. P(R W) = P(R)
(the events are independent and
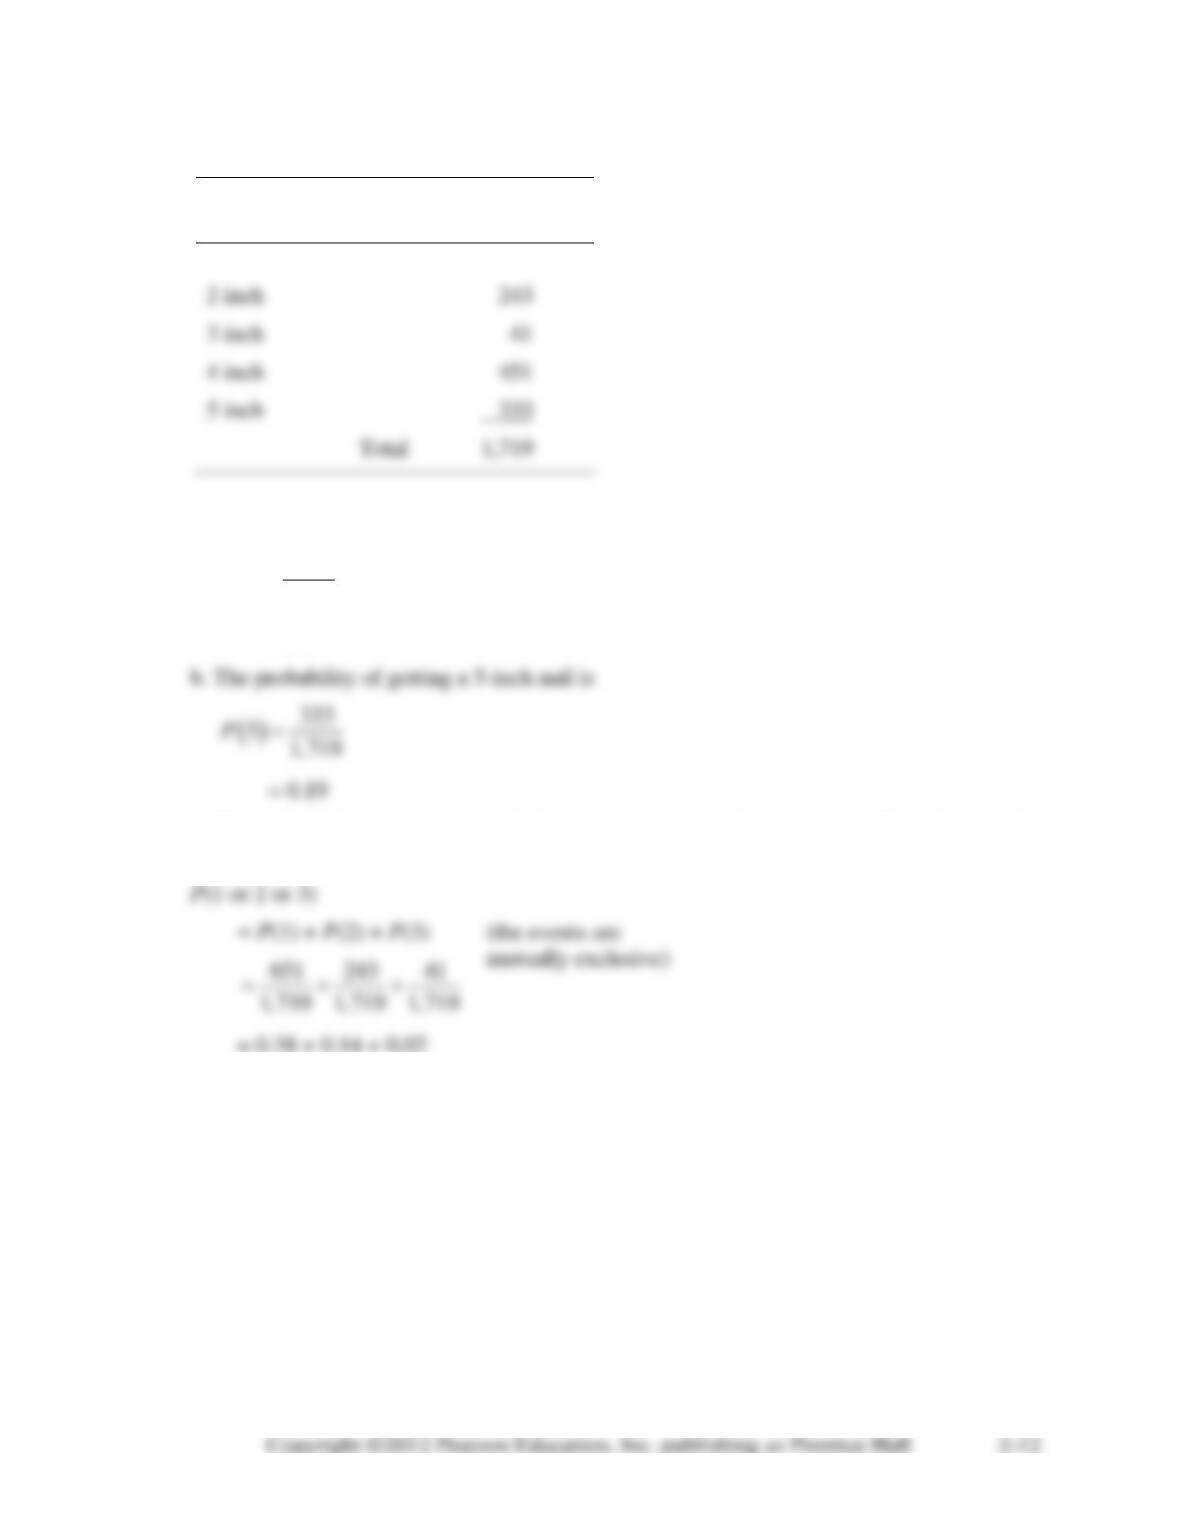
2-17. The distribution of the nails is as follows:
Type of Nail
Number in
Bin
1 inch
651
2 inch
243
3 inch
4 inch
451
5 inch
Total
a. The probability of getting a 4-inch nail is
( )
451
41,719
P=
= 0.26
c. The probability of getting a nail 3 inches or shorter is the probability of getting a nail 1
inch, 2 inches, or 3 inches in length. The probability is thus
= 0.54
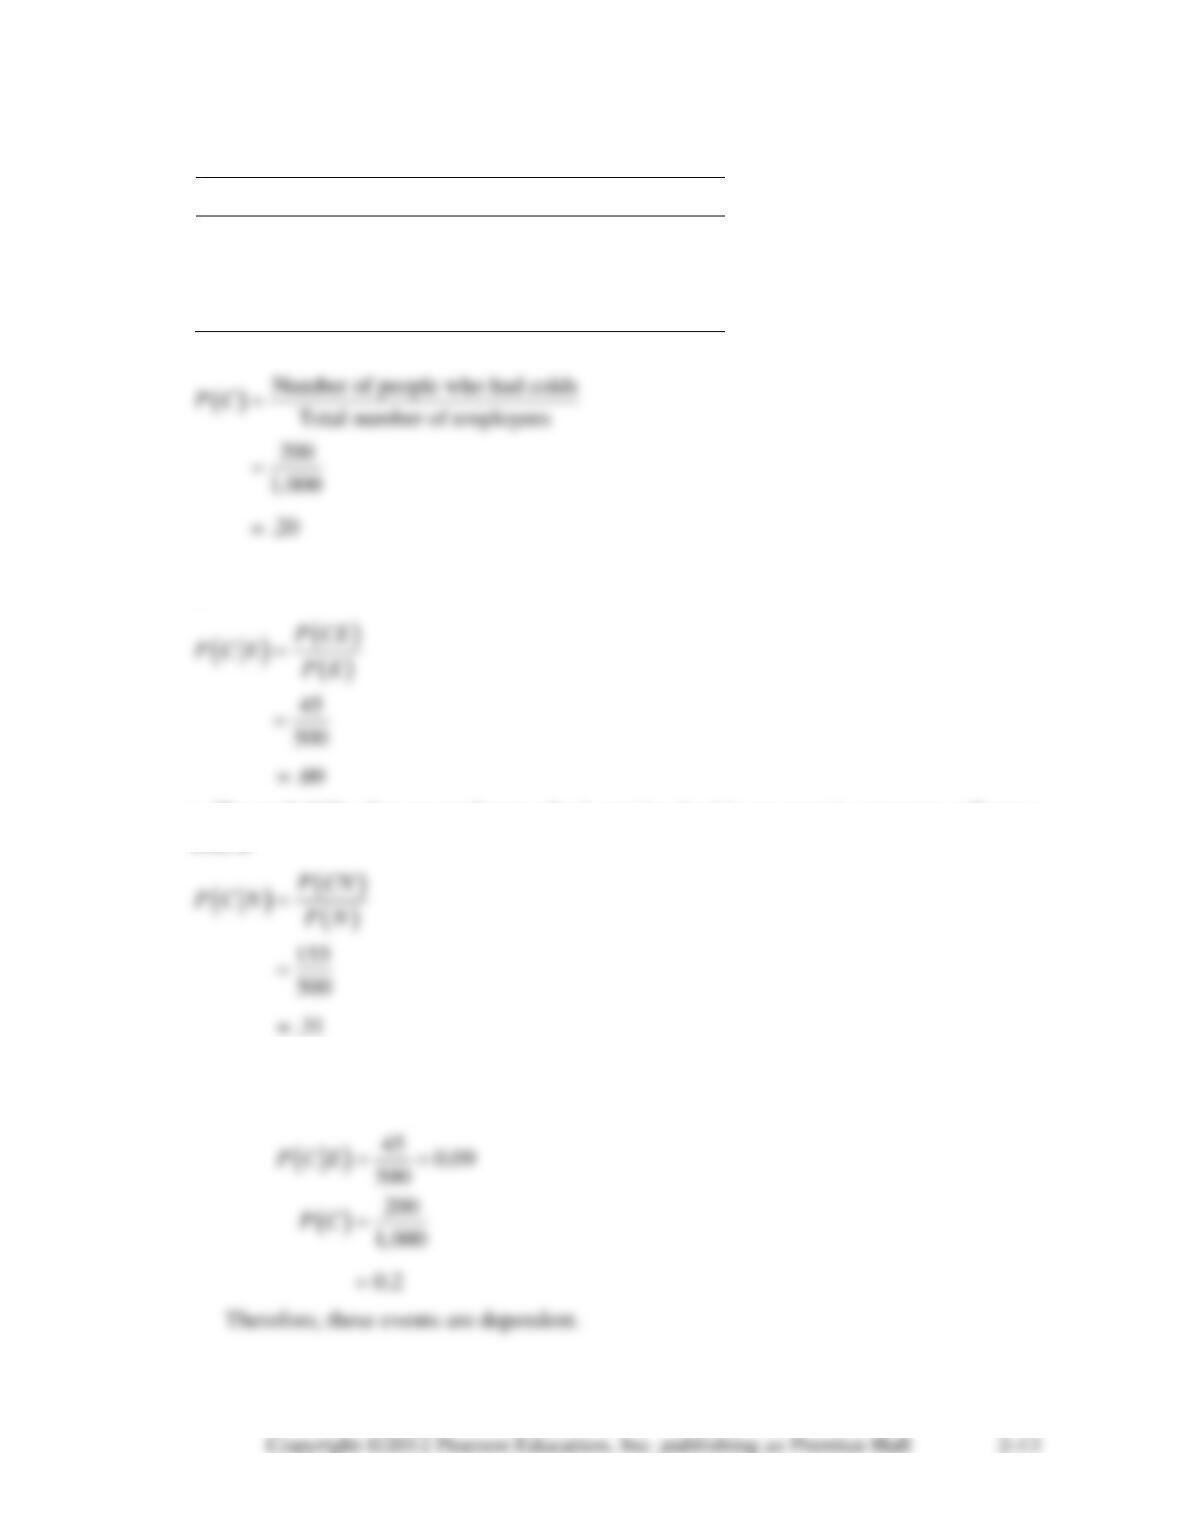
2-18.
Exercise
No Exercise
Total
Cold
45
155
200
No cold
455
345
800
Total
500
500
1000
a. The probability that an employee will have a cold next year is
b. The probability that an employee who is involved in an exercise program will get a cold
is
c. The probability that an employee who is not involved in an exercise program will get a
cold is
d. No. If they were independent, then
P(C E) = P(C), but
2-19. The probability of winning tonight’s game is
number of wins 12
number of games 20
=
The probability that the team wins tonight is 0.60. The probability that the team wins tonight and
draws a large crowd at tomorrow’s game is a joint probability of dependent events. Let the
probability of winning be P(W) and the probability of drawing a large crowd be P(L). Thus
2-20. The second draw is not independent of the first because the probabilities of each outcome
depend on the rank (sophomore or junior) of the first student’s name drawn. Let
J1 = junior on first draw
= 0.49
e. P(J1J2) = P(J2 J1) P(J1) = (0.8)(0.3) = 0.24
2-21. Without any additional information, we assume that there is an equally likely probability
that the soldier wandered into either oasis, so P(Abu Ilan) = 0.50 and P(El Kamin) = 0.50. Since
the oasis of Abu Ilan has 20 Bedouins and 20 Farimas (a total population of 40 tribesmen), the
probability of finding a Bedouin, given that you are in Abu Ilan, is 20/40 = 0.50. Similarly, the
probability of finding a Bedouin, given that you are in El Kamin, is 32/40 = 0.80. Thus,
The total probability of finding a Bedouin is
P(Bedouin) = 0.25 + 0.40 = 0.65
P(Abu Ilan Bedouin)
2-22. P(Abu Ilan) is 0.50; P(El Kamin) is 0.50.
P(2 Bedouins Abu Ilan) = (0.50)(0.50) = 0.25
= 0.125
P(El Kamin and 2 Bedouins)
Total probability of finding 2 Bedouins is 0.125 + 0.32 = 0.445.
P(Abu Ilan 2 Bedouins)
( )
( )
Abu Ilan and 2 Bedouin 0.125 0.281
2 Bedouin 0.445
P
P
= = =
2-23. P(adjusted) = 0.8, P(not adjusted) = 0.2.
P(pass adjusted) = 0.9,
P(pass not adjusted) = 0.2
2-24. MB = Mama’s Boys, K = the Killers, and M = the Machos
( )
3
over 0.6
5
P MB K ==
( )
4
over M 0.8
5
P MB ==
5
5
a. The probability that K will win every game is
P = P(K over MB) and P(K over M)
= (0.4)(0.2 ) = 0.08
b. The probability that M will win at least one game is
c. The probability is
1. [P(MB over K) and P(M over MB)], or
2. [P(MB over M) and P(K over MB)]
d. Probability = 1 – winning every game
= 1 – answer to part (a)
2-25. a. Probability = P(K over M) = 0.2.
b. Probability = P(K over MB) = 0.4.
c. Probability
= [P(K over M) and P(MB over K)] or
d. Probability = [P(K over MB) and P(K over M)]
= (0.4)(0.2)
= 0.08
2-26. The probability of Dick hitting the bull’s-eye:
P(D) = 0.90
= 0.995
= 0.855
c. It was assumed that the events are independent. This assumption seems to be justified.
Dick’s performance shouldn’t influence Sally’s performance.
2-27. In the sample of 1,000 people, 650 people were from Laketown and 350 from River City.
Thirteen of those with cancer were from Laketown. Six of those with cancer were from River
City.
a. The probability of a person from Laketown having cancer:
The probability of a person having cancer:
( )
19
cancer 1,000
P=
2-28.
( ) ( )
( )
( )
( )
( )
( )
P B A P A
P A B
P B A P A P B A P A
=+
Therefore,
P(L) = 1 – 0.22 = 0.78
2-29. Parts (a) and (c) are probability distributions because the probability values for each event
are between 0 and 1, and the sum of the probability values for the events is 1.