College Mathematics: Learning Worksheets Chapter 2
15
Name ________________________________ Date ______________ Class ____________
Goal: To evaluate function values and to determine the domain of functions
1. Evaluate the following function at the specified values of the independent variable and
simplify the results.
() 4 5
f
xx a) (1) 4(1) 5
f
b) (3) 4(3) 5
f
c)
(1)4(1)5
fx x
d) 11
45
44
f
Section 2-1 Functions
Definition: Function
A function is a correspondence between two sets of elements such that to each
element in the first set, there corresponds one and only one element in the second set.
The first set is called the domain and the set of corresponding elements in the second
set is called the range.
Definition: Function specified by equations
If in an equation in two variables, we get exactly one output (value for the dependent
variable) for each input (value for the independent variable), then the equation
specifies a function. The graph of such a function is just the graph of the specifying
equation.
College Mathematics: Learning Worksheets Chapter 2
16
In Problems 2–10 evaluate the given function for 2
() 1fx x and () 4gx x.
2. ( )(5) (5) (5)
f
gfg
+=+
2
(5) (5) 1
f
=+
(5) 5 4
g
=−
3.
( )(2 ) (2 ) (2 )
fgc fc gc
2
(2 ) (2 ) 1
fc c
(2 ) 2 4gc c
4. ( )(2) (2)(2)
fg f g
−= − −
2
(2) (2) 1
f
−=− +
(2) 2 4
g
−=−−
5. (0)
(0) (0)
f
f
2
(0) (0) 1
f
(0) 0 4
g
g
⋅−=−
(3) 7
g
−=−
7. 3 (4) 2 ( 1) 3(17) 2( 5)
fg
2
(4) (4) 1
f
(1) 1 4
g
College Mathematics: Learning Worksheets Chapter 2
17
8. (4) (3) 17 ( 1)
fg
−−−
=
2
(4) (4) 1
f
=+
2
(2) (2) 1
f
=+
(3) 3 4
g
=−
9. (1 ) (1) 5 (5)
ghg h
(1 ) 1 4
gh h
(1) 1 4
g
10.
2
(3 ) (3) 6 10 (10)
fhf hh
hh
+− + +−
=
2
(3 ) (3 ) 1
fh h
+=+ +
2
(3) (3) 1
f
=+

College Mathematics: Learning Worksheets Chapter 2
18
College Mathematics: Learning Worksheets Chapter 2
19
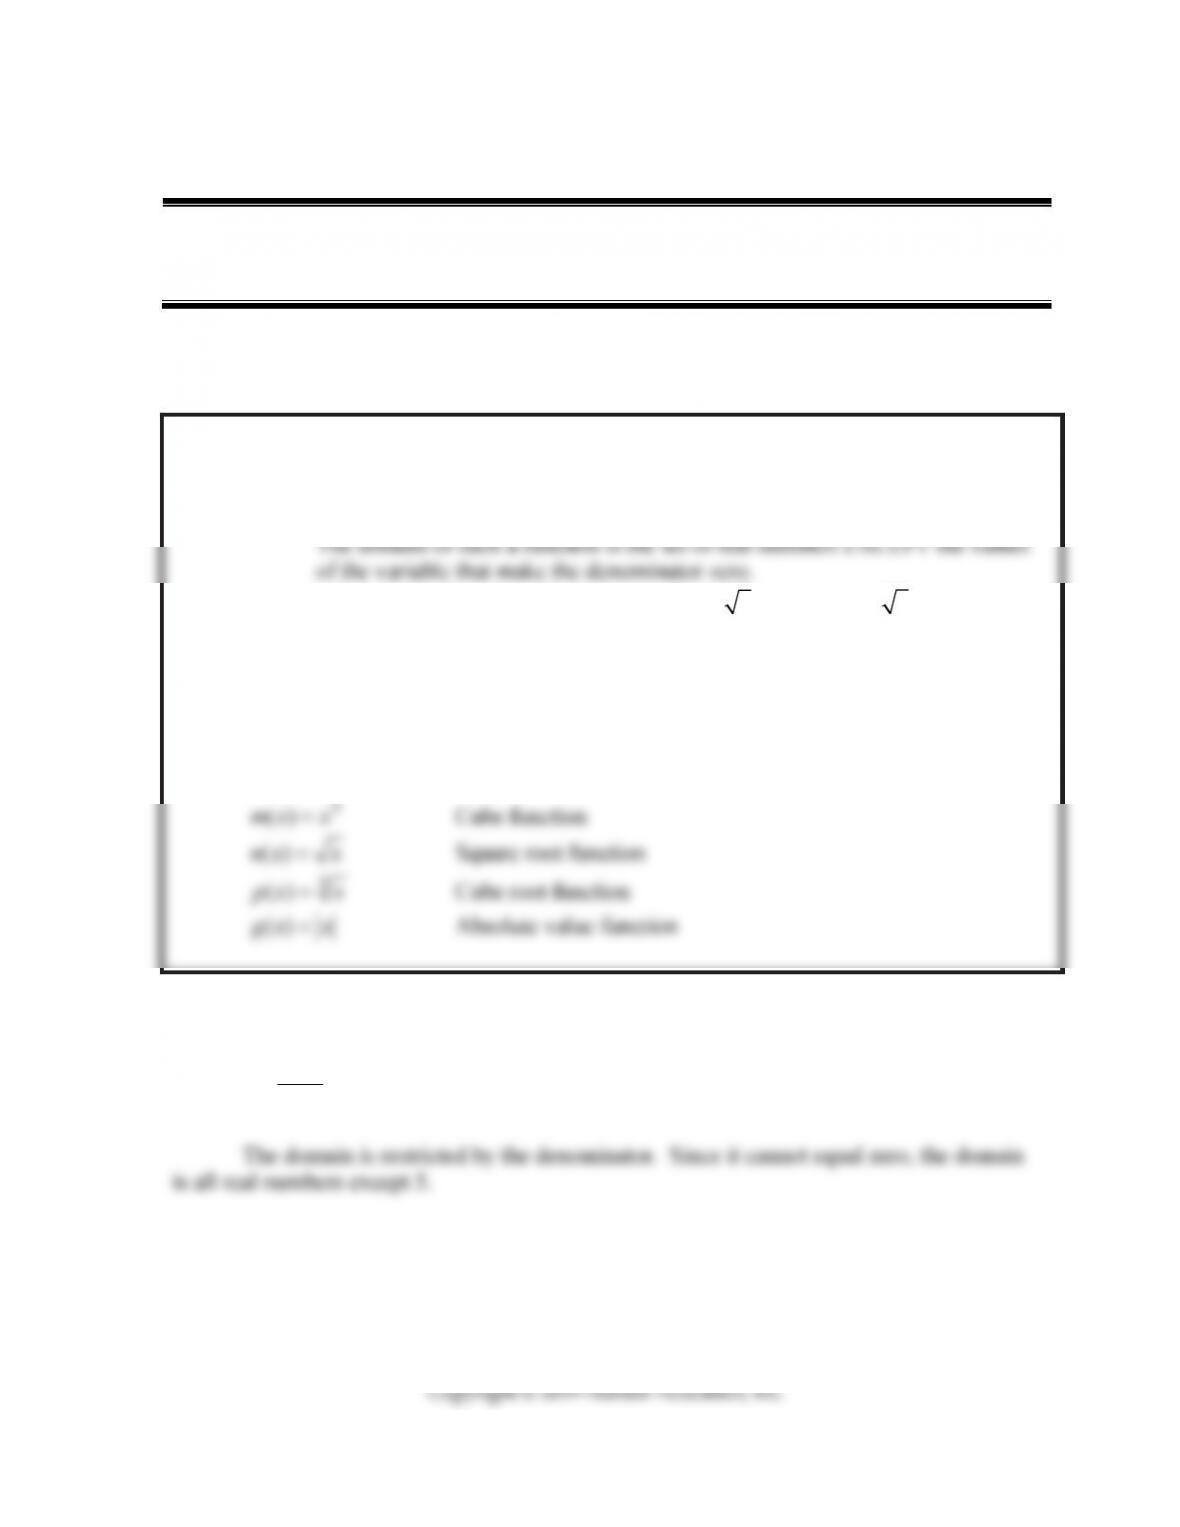
Name ________________________________ Date ______________ Class ____________
Goal: To determine the domain of a function and to describe the shapes of graphs based on
vertical and horizontal shifts and reflections, stretches, and shrinks
In Problems 1–8 find the domain of each function.
1. 5
() 5
gx x
=−
Section 2-2 Elementary Functions:
Graphs and Transformations
The domain of the following functions will be the set of real numbers unless it meets
one of the following conditions:
1. The function contains a fraction whose denominator has a variable.
2. The function contains an even root (square root , fourth root 4 , etc.).
The domain of such a function is limited to values of the variable that make
the radicand (the part under the radical) greater than or equal to 0.
Basic Elementary Functions:
()fxx Identity function
2
()hx x Square function
20
2. 4
() 56
x
fx x
=+
5
3. 4
() 1 5ht t=−
5
4. 2
() 1 2gx x
5. 3
() 4fx x
6. () 3hw w
7. 32
() 2 5 17fx x x x
8.
4
3
() 4
x
gx=
College Mathematics: Learning Worksheets Chapter 2
21
9. 2
() 12gx x=−
10. () 3fx x=+
11. ()
f
xx
12. 3
() 4fx x=−
13.
()
2
() 6 3gx x=− +
14. 2
() 1fx x
15. () 2 4gx x
College Mathematics: Learning Worksheets Chapter 2
22
16. () 7hx x=+
17. 3
() 3gx x
18. () 3 2fx x=+−
19. () 3 2hx x
20. 3
() 2fx x
21. 3
() ( 5) 3fx x=− + −
22. 3
() 3 4hx x
College Mathematics: Learning Worksheets Chapter 2
23
23. The shape of 3
y
x shifted 8 units right.
24. The shape of yx shifted 5 units down.
25. The shape of
y
x reflected over the x-axis and shifted 5 units up.
26. The shape of 2
y
x shifted 5 units right and 3 units up.
27. The shape of 3
y
x reflected over the x-axis and shifted 1 unit up.
y
28. The shape of 2
y
x reflected over the x-axis and shifted 3 units down.
29. The shape of
y
x shifted 4 units left.
30. The shape of 3
y
x shifted 6 units right and 2 units down.
31. The shape of
y
x shifted 6 units right and 5 units up.

College Mathematics: Learning Worksheets Chapter 2
24
College Mathematics: Learning Worksheets Chapter 2
Name ________________________________ Date ______________ Class ____________
Goal: To describe functions that are linear and quadratic in nature
For 1–8 find: a) the domain
b) the vertex
c) the axis of symmetry
d) the x-intercept(s)
Section 2-3 Quadratic Functions
Quadratic Functions:
Standard form of a quadratic: 2
() ,
f
xaxbxc=++where a, b, c are real and 0.a
Vertex form of a quadratic: 2
() ( ) ,
f
xaxh k=−+where 0aand ( , )hk is the vertex.
Axis of symmetry:
x
h
Minimum/Maximum value:
If 0,a then the turning point (or vertex) is a minimum point on the graph and the
College Mathematics: Learning Worksheets Chapter 2
26
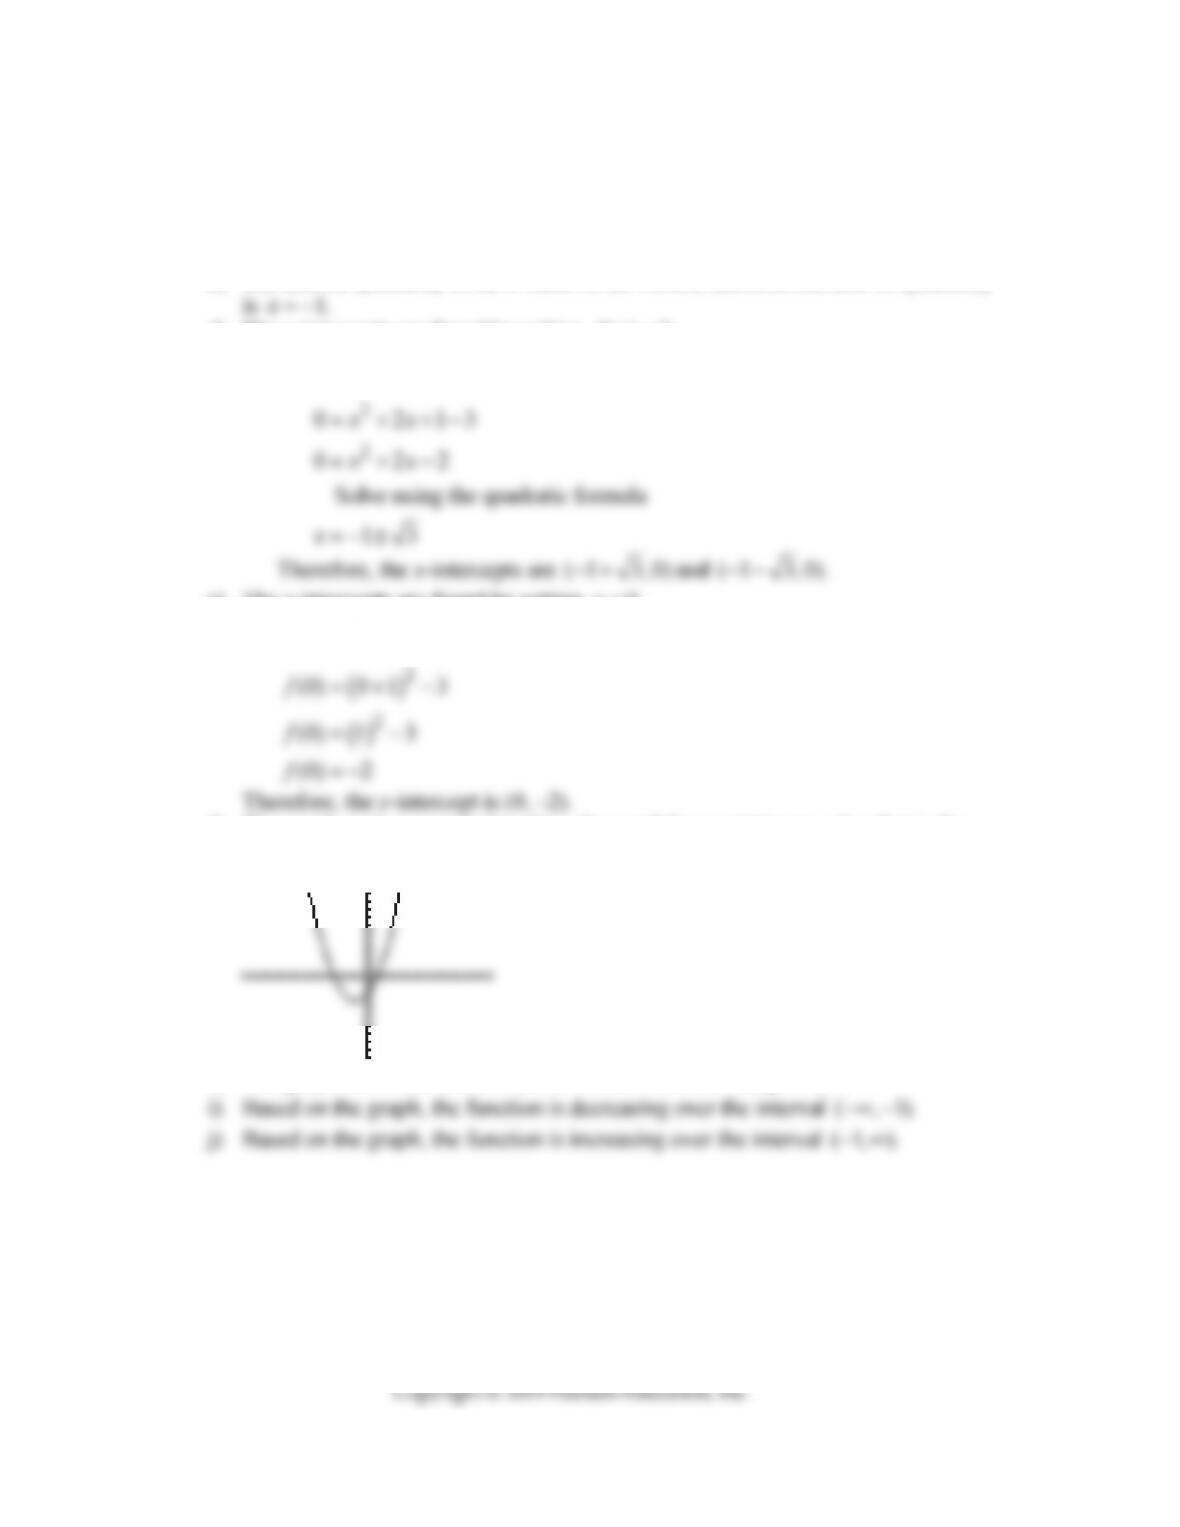
1.
()
2
() 1 3fx x=+ −
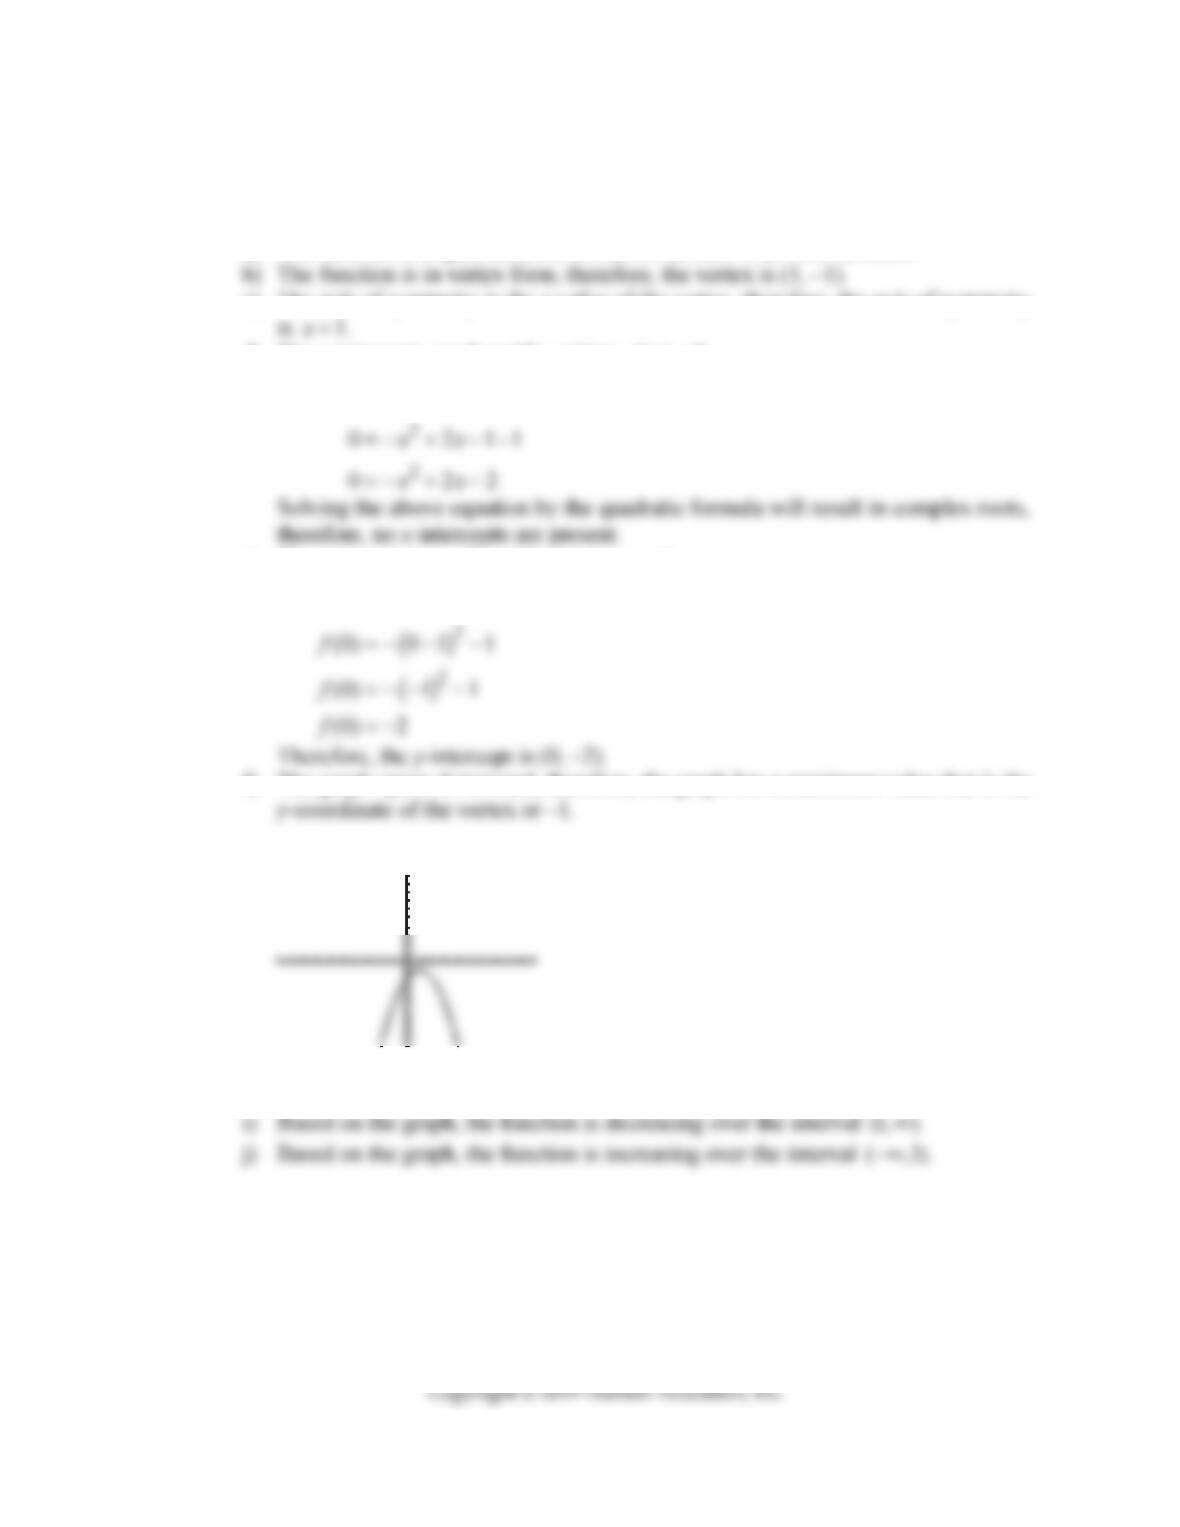
a) The function is a quadratic, therefore, the domain is all real numbers.
b) The function is in vertex form, therefore, the vertex is (–1, – 3).
c) The axis of symmetry is the x-value of the vertex, therefore the axis of symmetry
d) The x-intercepts are found by setting ( ) 0.fx
()
2
() 1 3
fx x
=+ −
e) The y-intercepts are found by setting 0.x
()
2
() 1 3
fx x
=+ −
f) The graph opens upward, therefore, the graph has a minimum value that is the
y-coordinate of the vertex or –3.
g)
h) The graph has a minimum value of –3, therefore, the range is 3.y
College Mathematics: Learning Worksheets Chapter 2
27
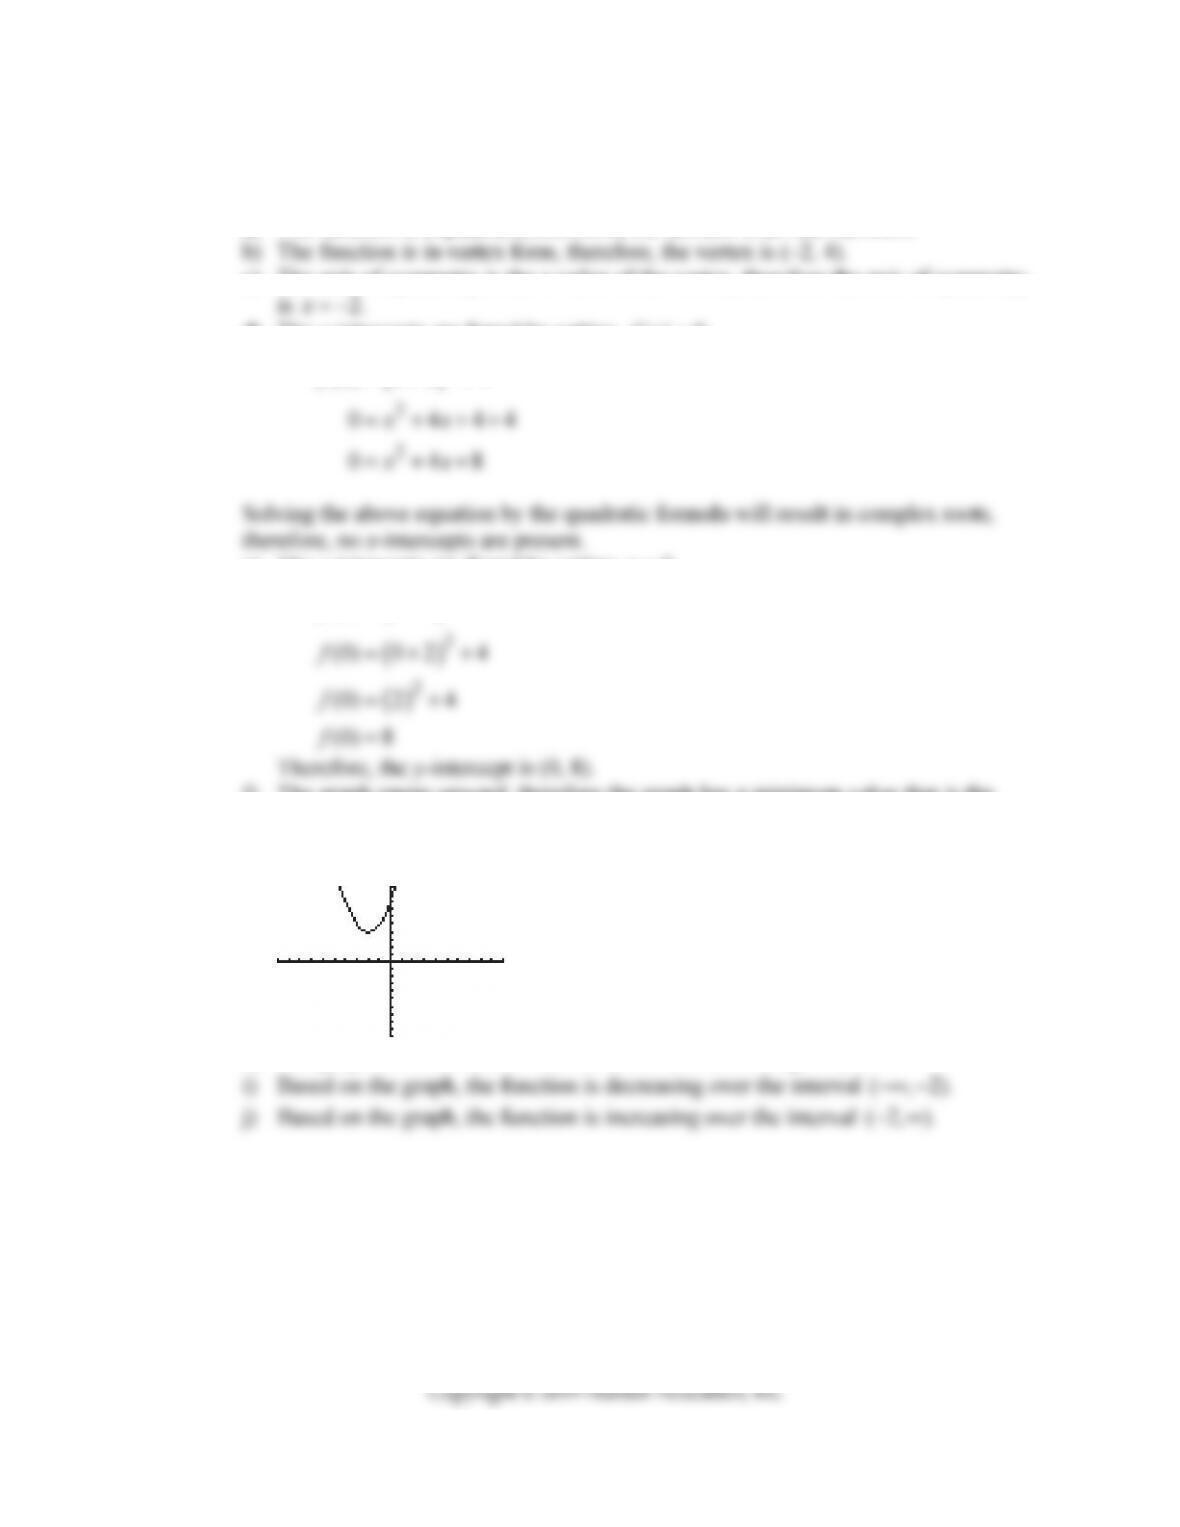
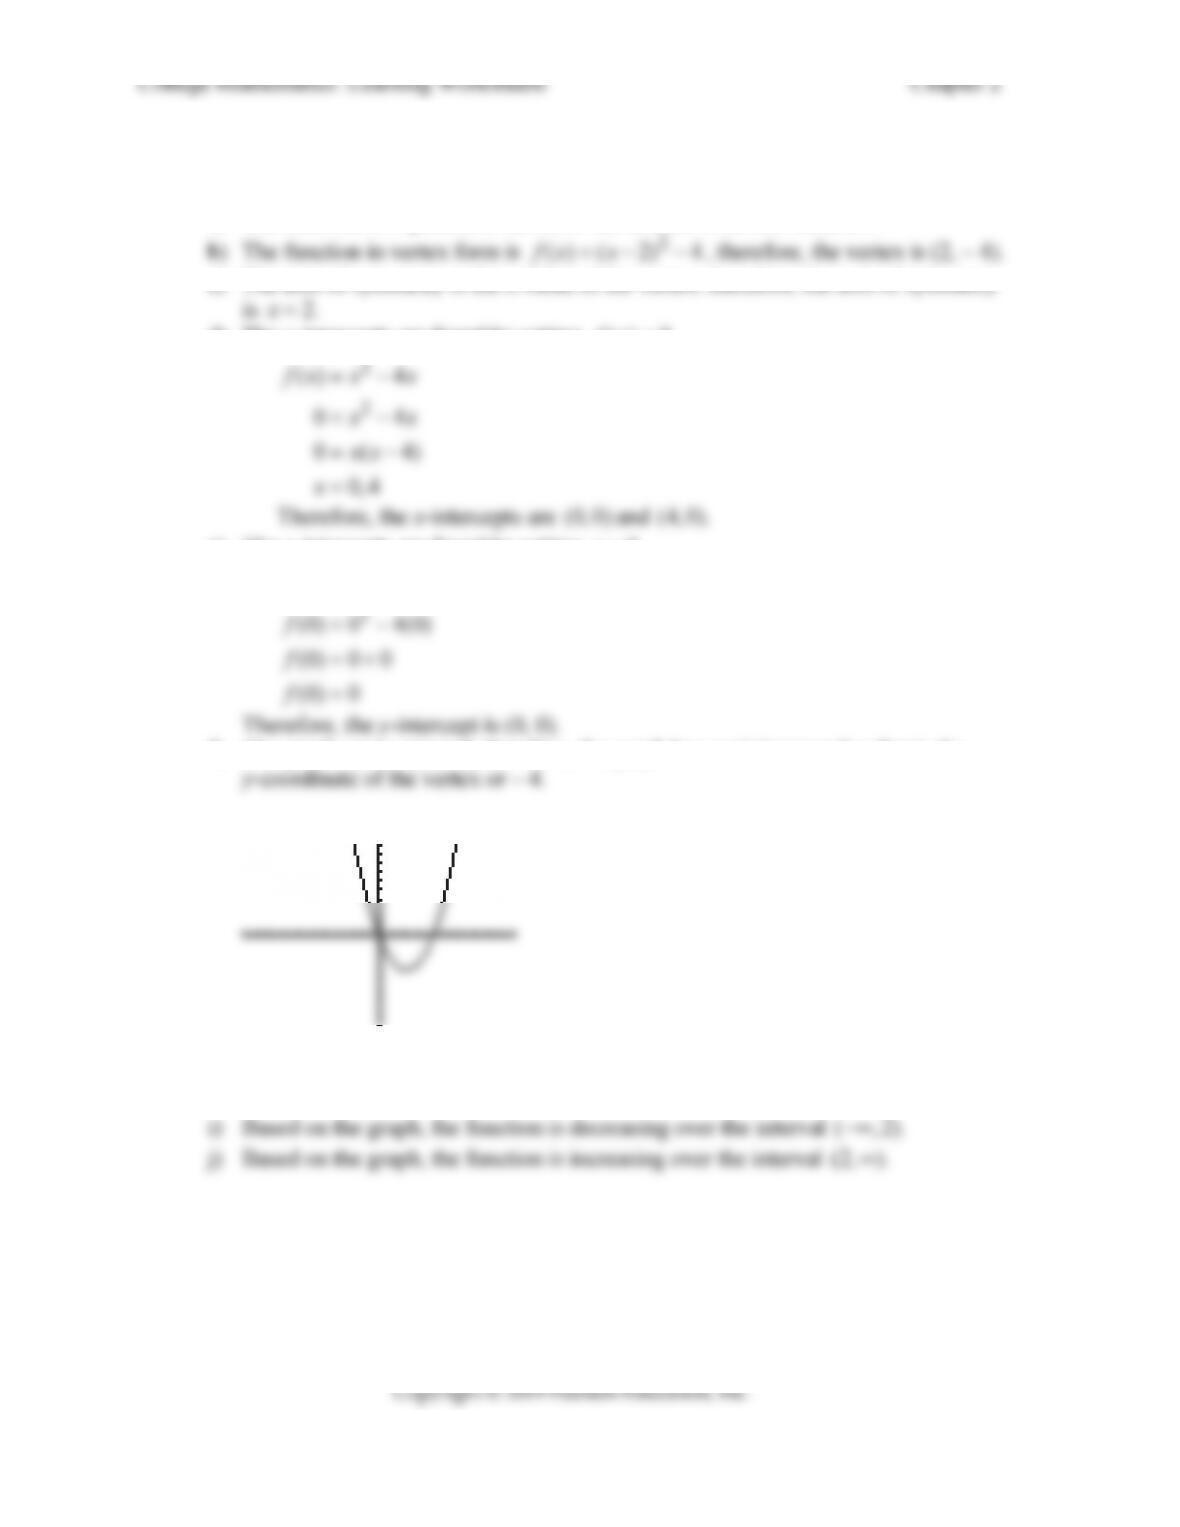
2.
()
2
() 2 4fx x=+ +
a) The function is a quadratic, therefore, the domain is all real numbers.
c) The axis of symmetry is the x-value of the vertex, therefore the axis of symmetry
d) The x-intercepts are found by setting ( ) 0.fx
()
2
() 2 4
fx x
=+ +
e) The y-intercepts are found by setting 0.x
()
2
() 2 4
fx x
=+ +
f) The graph opens upward, therefore the graph has a minimum value that is the
y-coordinate of the vertex or 4.
g)
h) The graph has a minimum value of 4, therefore, the range is 4.y
College Mathematics: Learning Worksheets Chapter 2
28
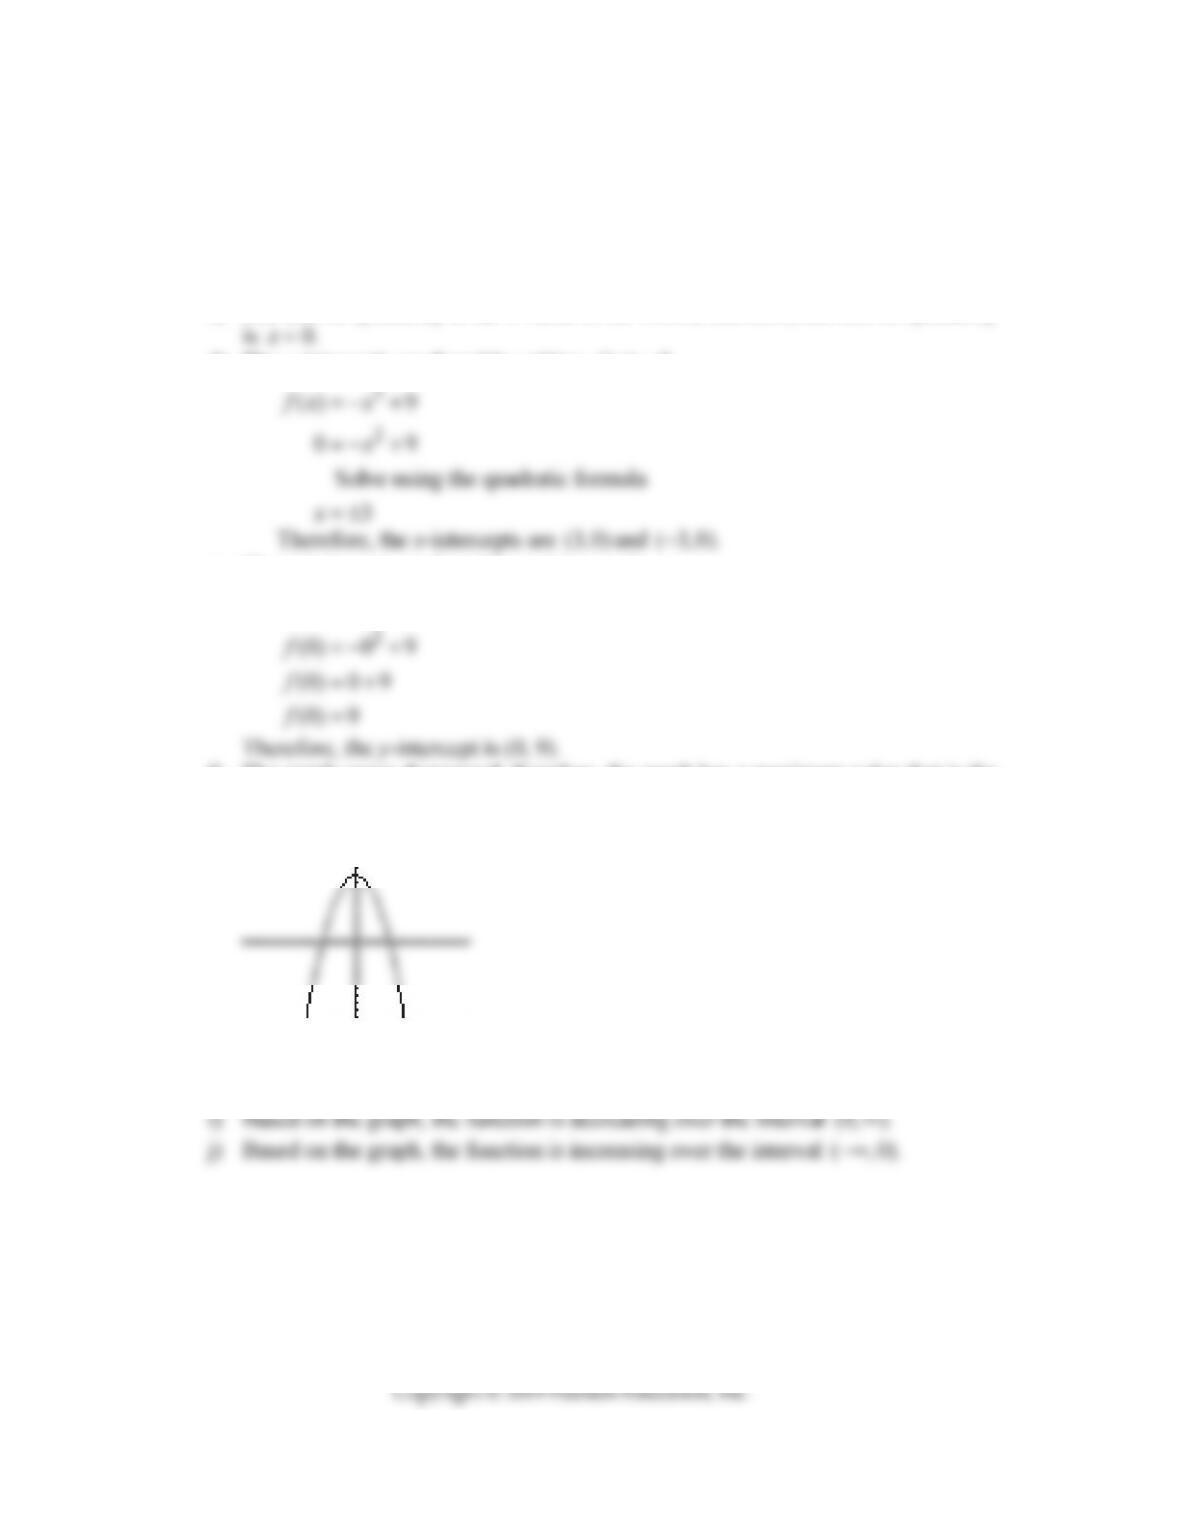
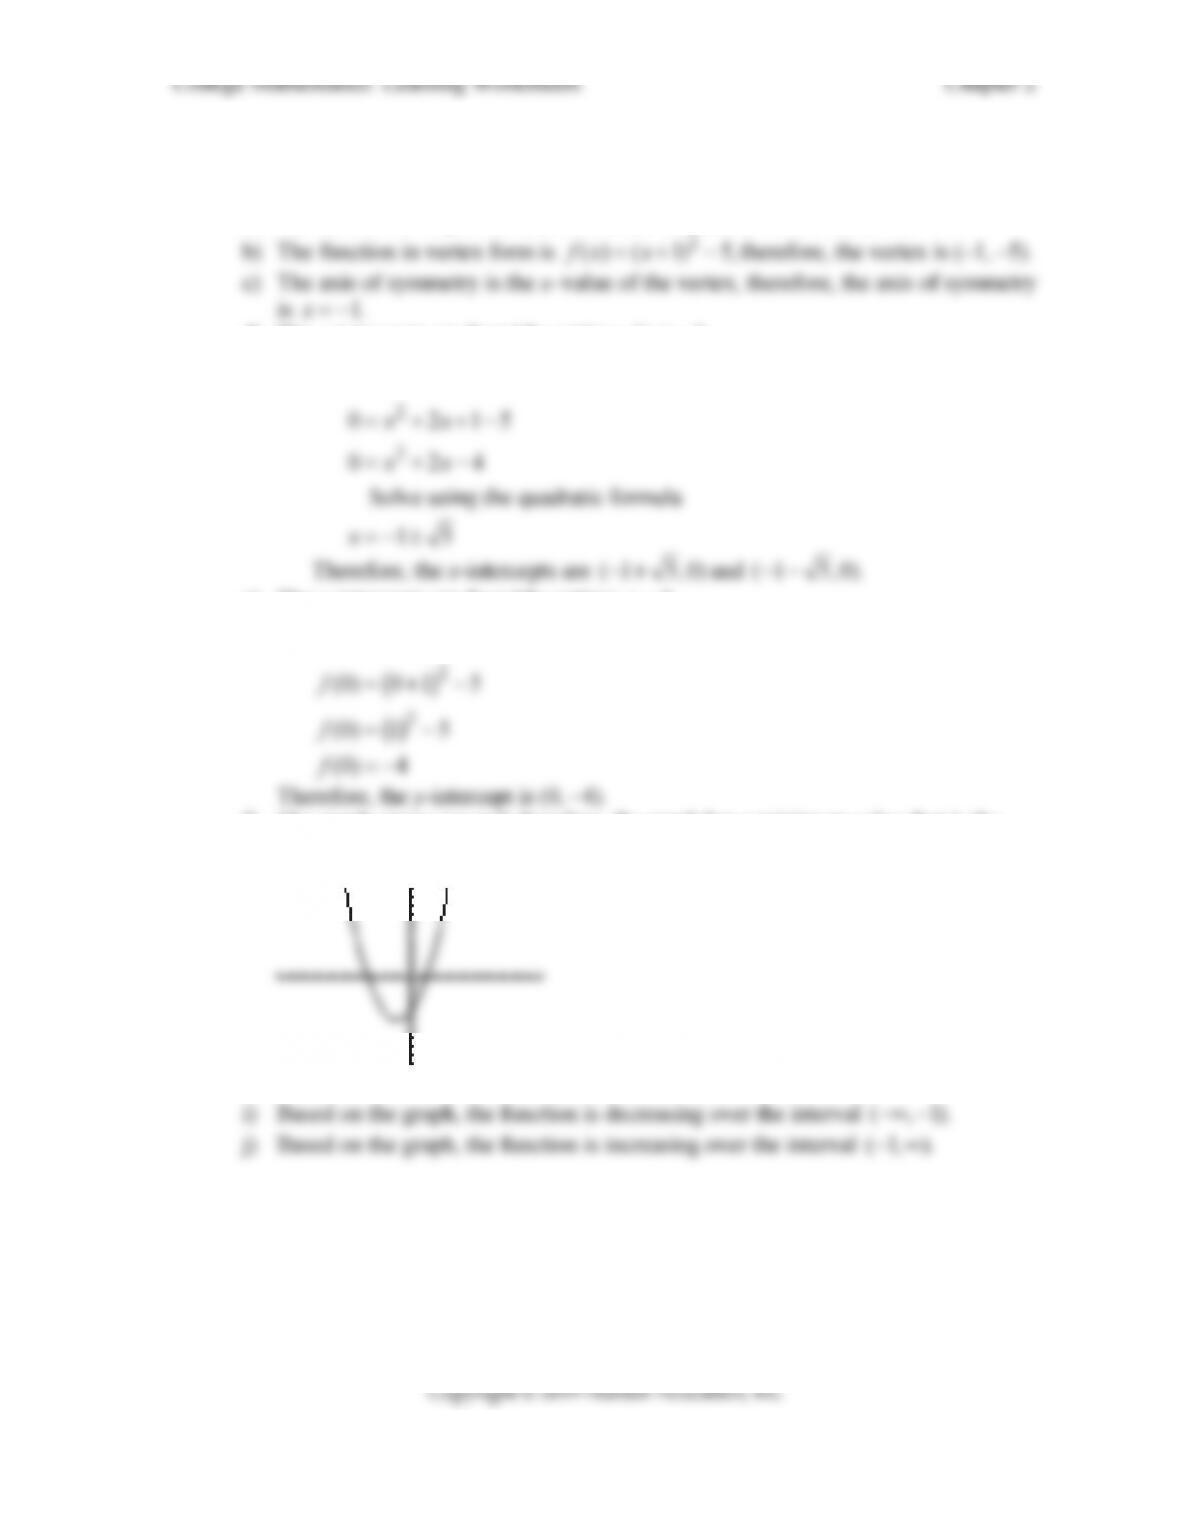
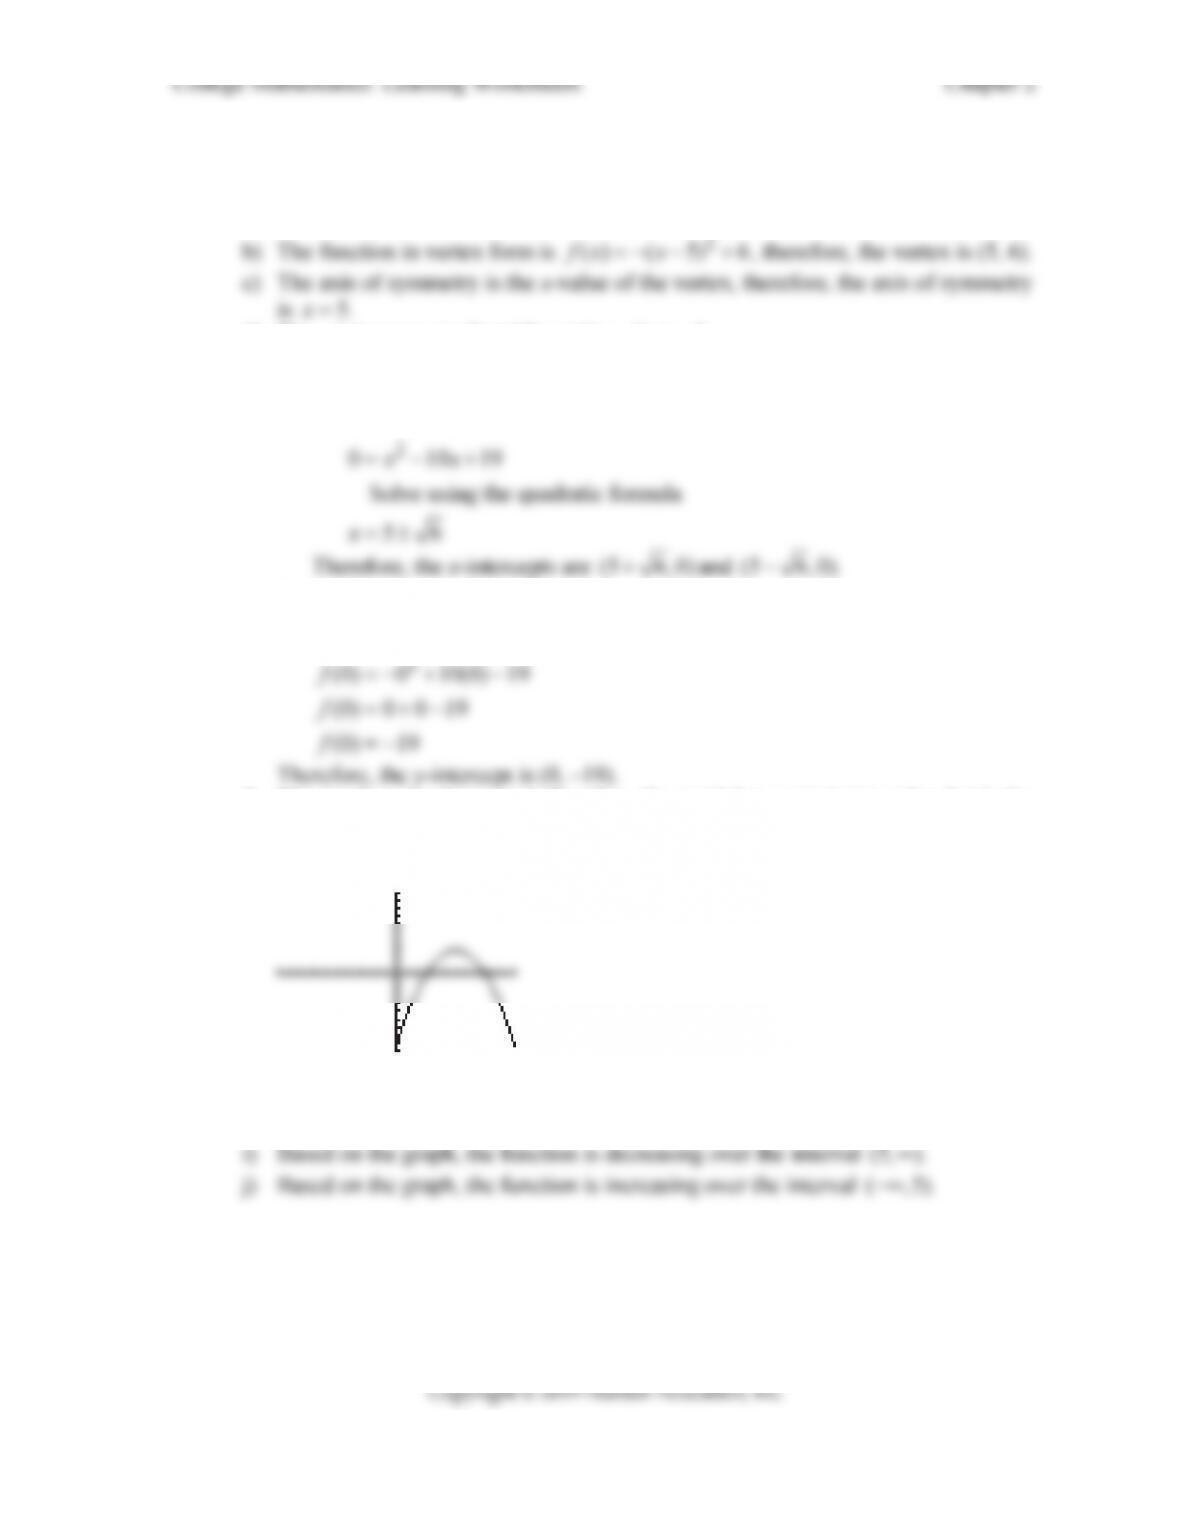
3. 2
() 9fx x=− +
a) The function is a quadratic, therefore, the domain is all real numbers.
b) The function in vertex form is 2
() ( 0) 9fx x=− − + , therefore, the vertex is (0, 9).
c) The axis of symmetry is the x-value of the vertex, therefore, the axis of symmetry
d) The x-intercepts are found by setting () 0.fx
e) The y-intercepts are found by setting 0.x
2
() 9
fx x
=− +
f) The graph opens downward, therefore, the graph has a maximum value that is the
y-coordinate of the vertex or 9.
g)
h) The graph has a maximum value of 9, therefore, the range is 9.y≤
College Mathematics: Learning Worksheets Chapter 2
29
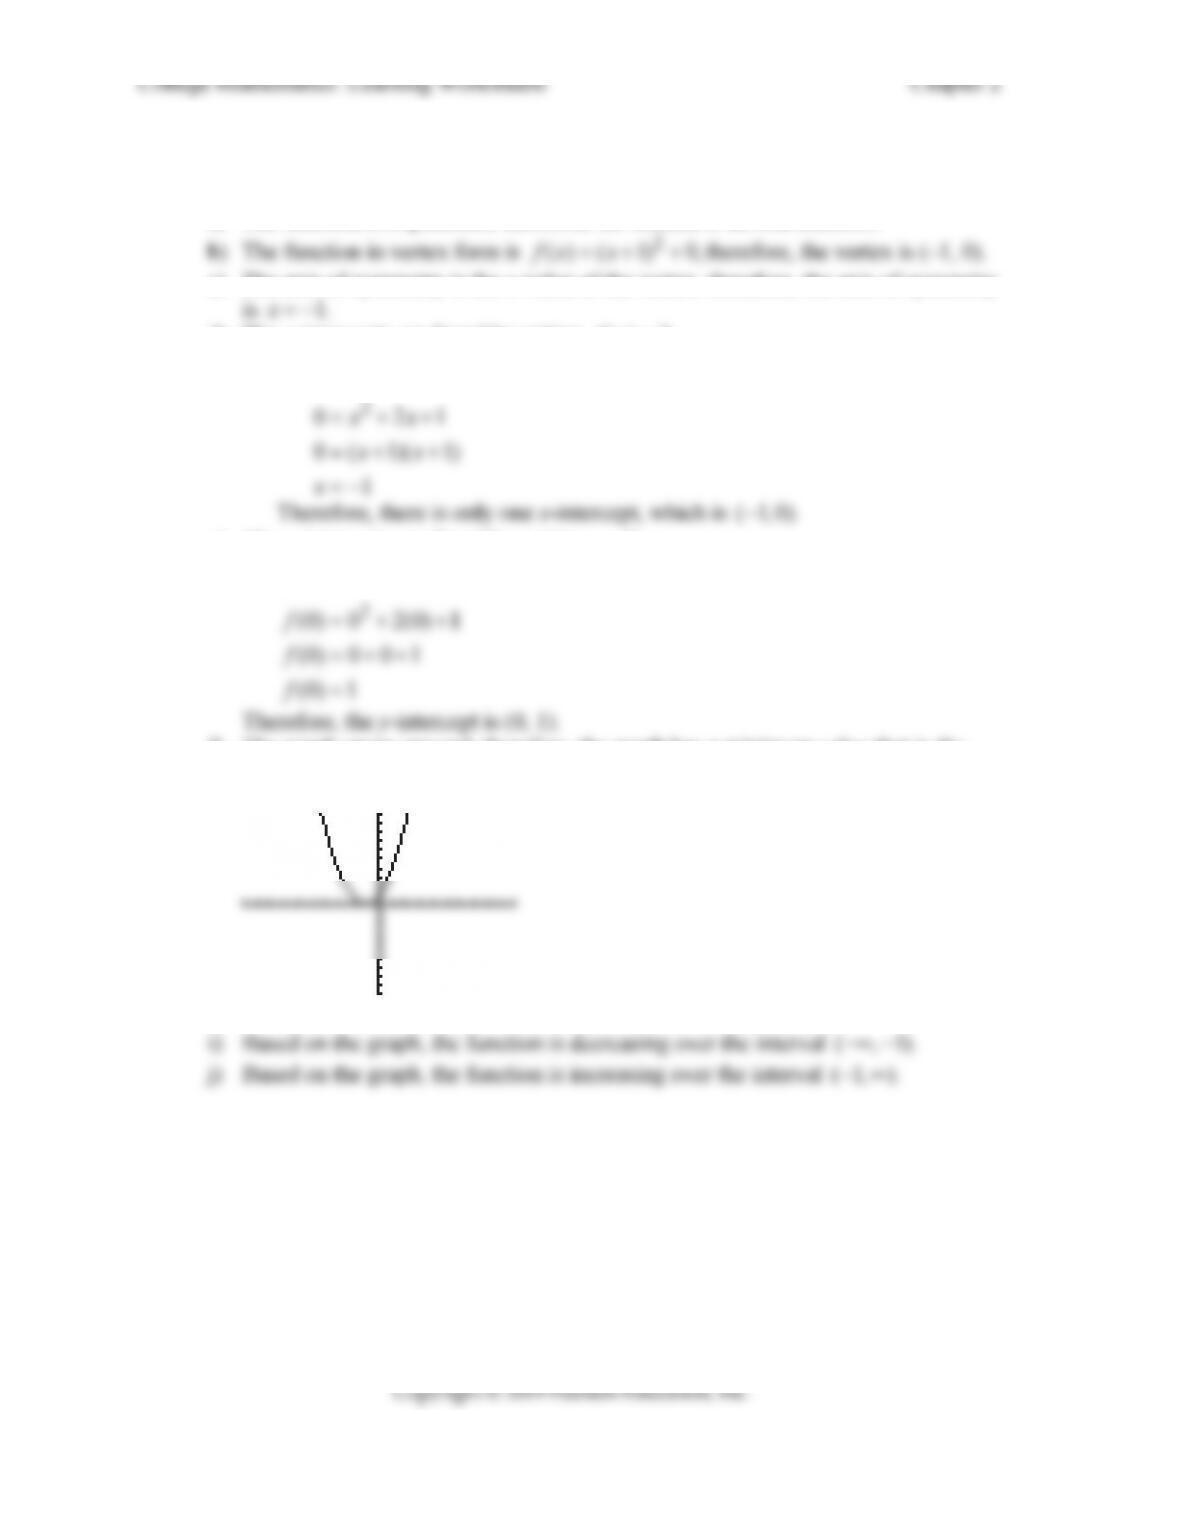
4.
2
() 1 1fx x
a) The function is a quadratic, therefore, the domain is all real numbers.
c) The axis of symmetry is the x-value of the vertex, therefore, the axis of symmetry
d) The x-intercepts are found by setting () 0.fx
2
() 1 1
fx x
e) The y-intercepts are found by setting 0.x
2
() 1 1
fx x
f) The graph opens downward, therefore, the graph has a maximum value that is the
g)
h) The graph has a maximum value of –1, therefore, the range is 1.y
30
5. 2
() 4
f
xx x=−
a) The function is a quadratic, therefore the domain is all real numbers.
c) The axis of symmetry is the x-value of the vertex, therefore, the axis of symmetry
d) The x-intercepts are found by setting () 0.fx
e) The y-intercepts are found by setting 0.x
2
() 4
f
xx x
f) The graph opens upward, therefore, the graph has a minimum value that is the
g)
h) The graph has a minimum value of – 4, therefore, the range is 4.y
31
6. 2
() 2 4fx x x
a) The function is a quadratic, therefore, the domain is all real numbers.
d) The x-intercepts are found by setting () 0.fx
2
() 1 5
fx x
e) The y-intercepts are found by setting 0.x
2
() 1 5
fx x
f) The graph opens upward, therefore, the graph has a minimum value that is the
y-coordinate of the vertex or –5.
g)
h) The graph has a minimum value of –5, therefore, the range is 5.y
7. 2
() 2 1
f
xx x
a) The function is a quadratic, therefore, the domain is all real numbers.
c) The axis of symmetry is the x-value of the vertex, therefore, the axis of symmetry
d) The x-intercepts are found by setting () 0.fx
2
() 2 1
fx x x
33
8. 2
( ) 10 19fx x x
a) The function is a quadratic, therefore, the domain is all real numbers.
d) The x-intercepts are found by setting () 0.fx
2
2
( ) 10 19
01019
fx x x
xx
e) The y-intercepts are found by setting 0.x
2
( ) 10 19
fx x x
f) The graph opens downward, therefore, the graph has a maximum value that is the
y-coordinate of the vertex or 6.
g)
h) The graph has a maximum value of 4, therefore, the range is 6.y
34
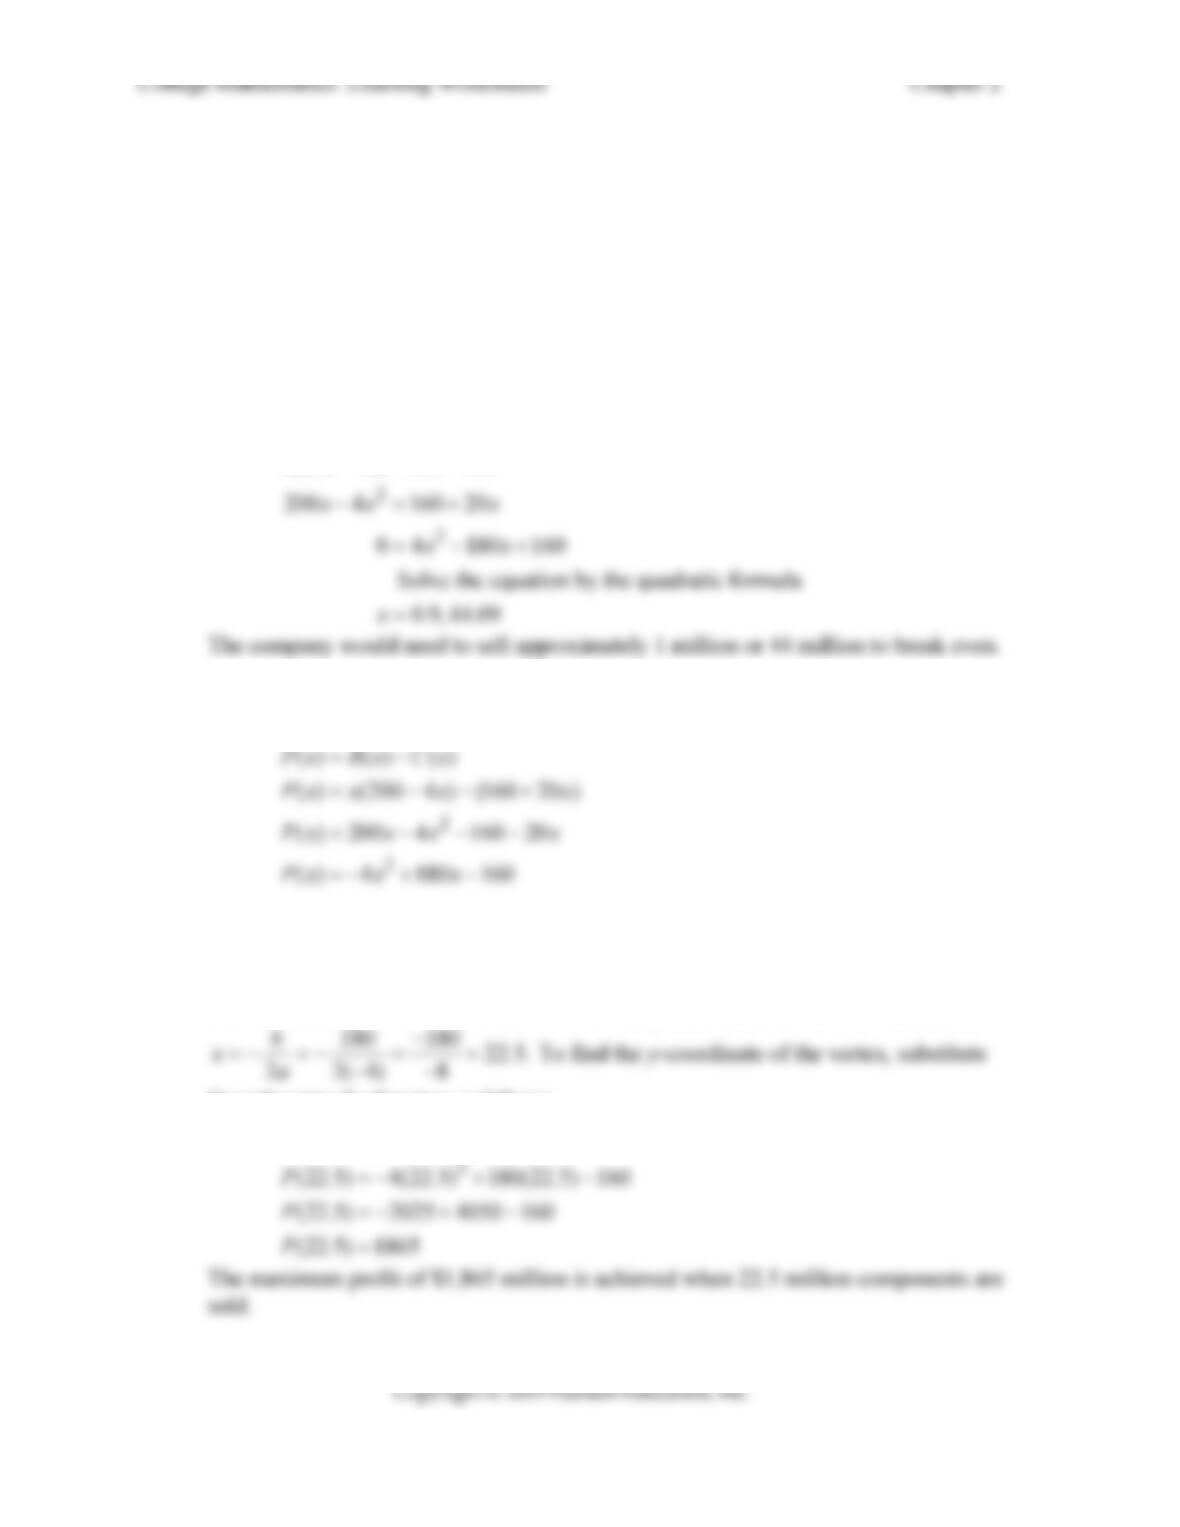
9. The revenue and cost functions for a company that manufactures components for washing
machines were determined to be
( ) (200 4 )
R
xx x and ( ) 160 20 ,Cx x=+
where x is the number of components in millions and R(x) and C(x) are in millions of dollars.
a) How many components must be sold in order for the company to break even?
(Break-even points are when ( ) ( )
R
xCx.) (Round answers to nearest million.)
() ()
(200 4 ) 160 20
Rx Cx
xx x
b) Find the profit equation. ( () () ()Px Rx Cx)
2
2
( ) (200 4 ) (160 20 )
( ) 200 4 160 20
( ) 4 180 160
Px x x x
Px x x x
Px x x
c) Determine the maximum profit. How many components must be sold in order to
achieve that maximum profit?
The maximum profit occurs at the vertex of the profit function. The x-coordinate is
the value into the function as follows:
2
( ) 4 180 160
Px x x