CASE 19
Panera Bread Company (2010): Still Rising Fortunes?
19–12
c. Invest in television commercials.
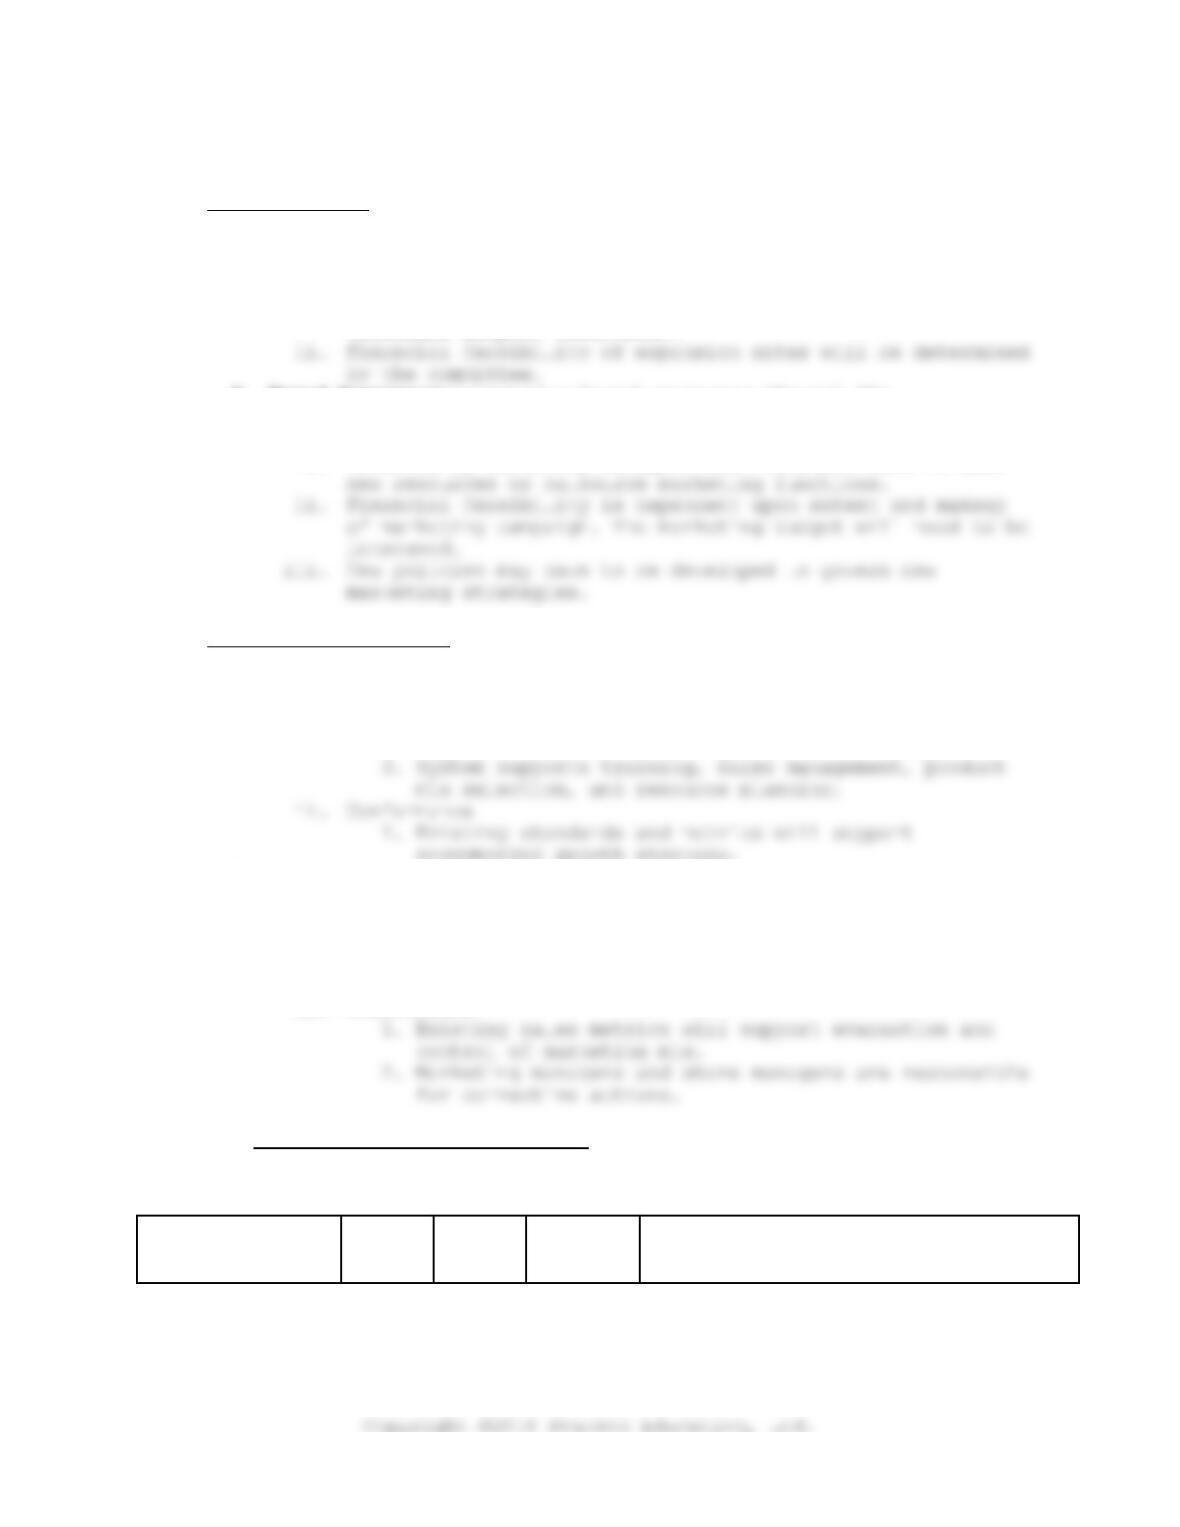
7. IMPLEMENTATION
a. Growth—growth strategy will require leveraging existing policies
and core competencies governing site selection, supply chain
management, human resources, and information systems.
i. Overseen by Senior Management. Installation of committee to
investigate and select international sites for expansion
(includes airport selection).
b. Brand Awareness—increasing brand awareness through the
implementation of a varied marketing mix will require modification
of existing strategies and may necessitate new talent being hired.
i. Overseen by Marketing Manager. Must evaluate need to hire
8. EVALUATION, & CONTROL
a. Growth
i. Information Systems
1. Existing information systems is scalable to support
international and domestic expansion.
2. Supports real–time data acquisition and analysis.
recommended growth strategy.
b. Brand Awareness
i. Information Systems
1. Existing information systems is capable of providing
information, which can be used to determine impact of
marketing mix strategies.
2. Supports real–time data acquisition and analysis.
ii. Conformance
IX. EFAS, IFAS, and SFAS EXHIBITS
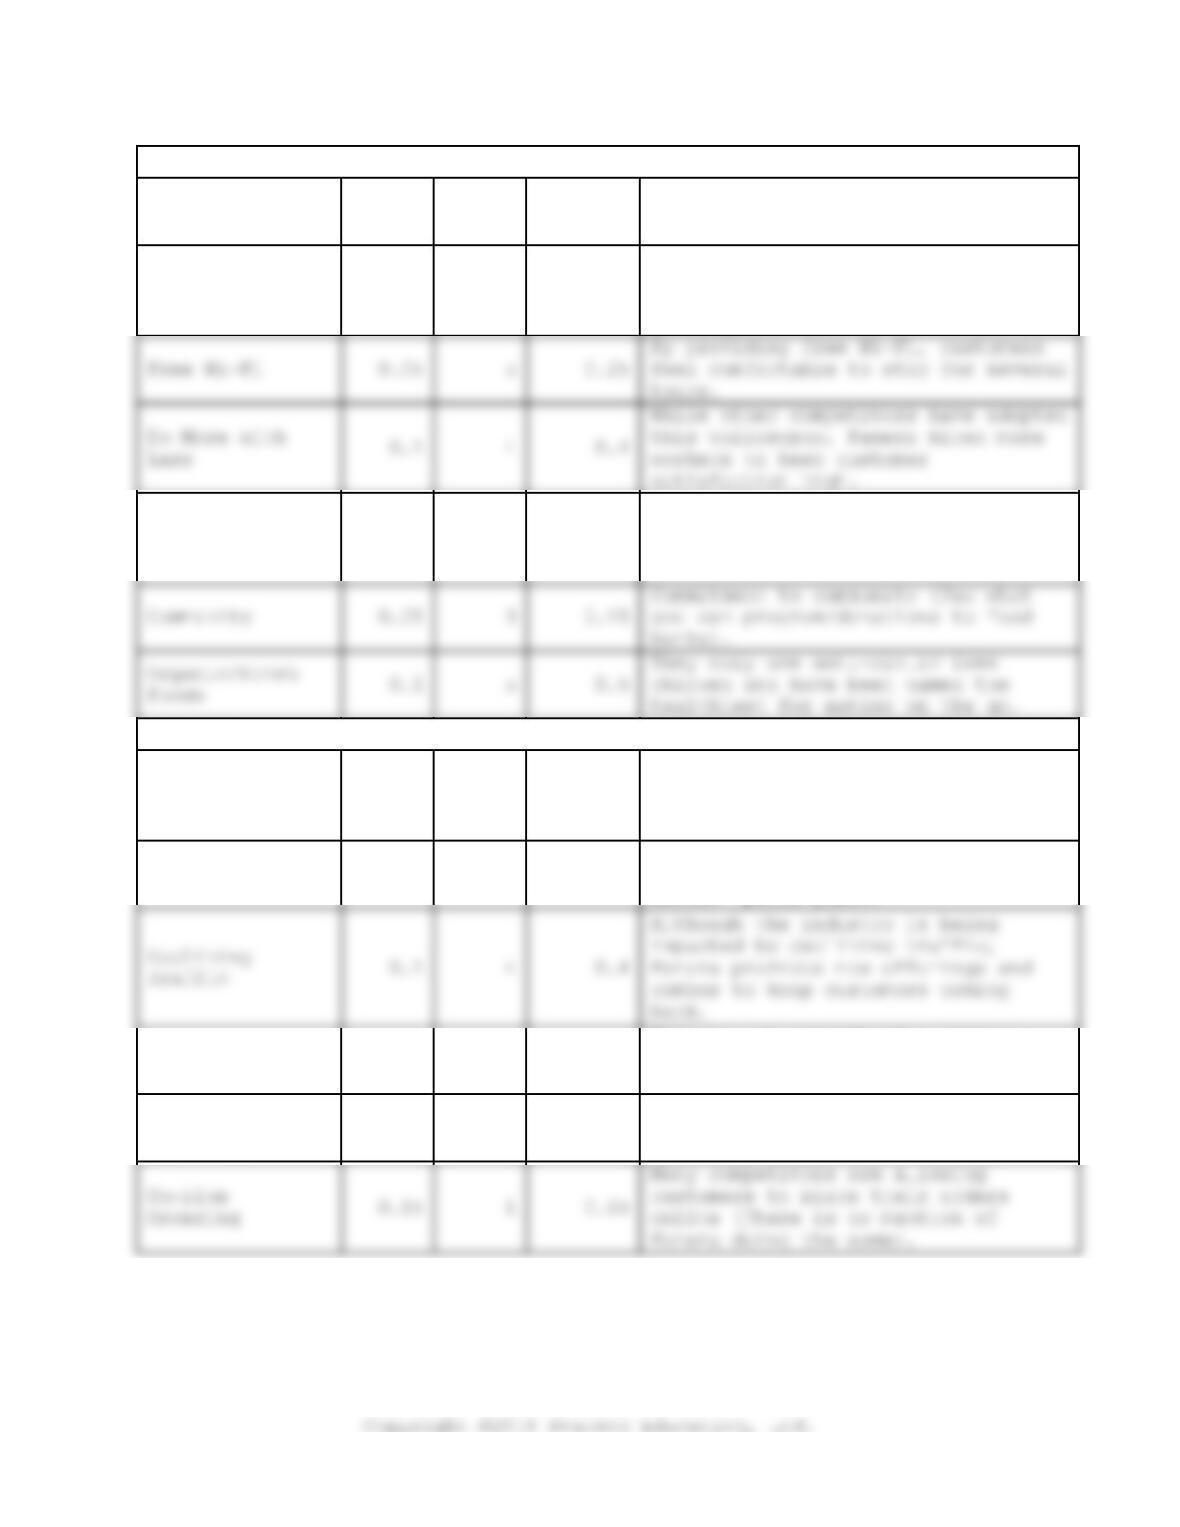
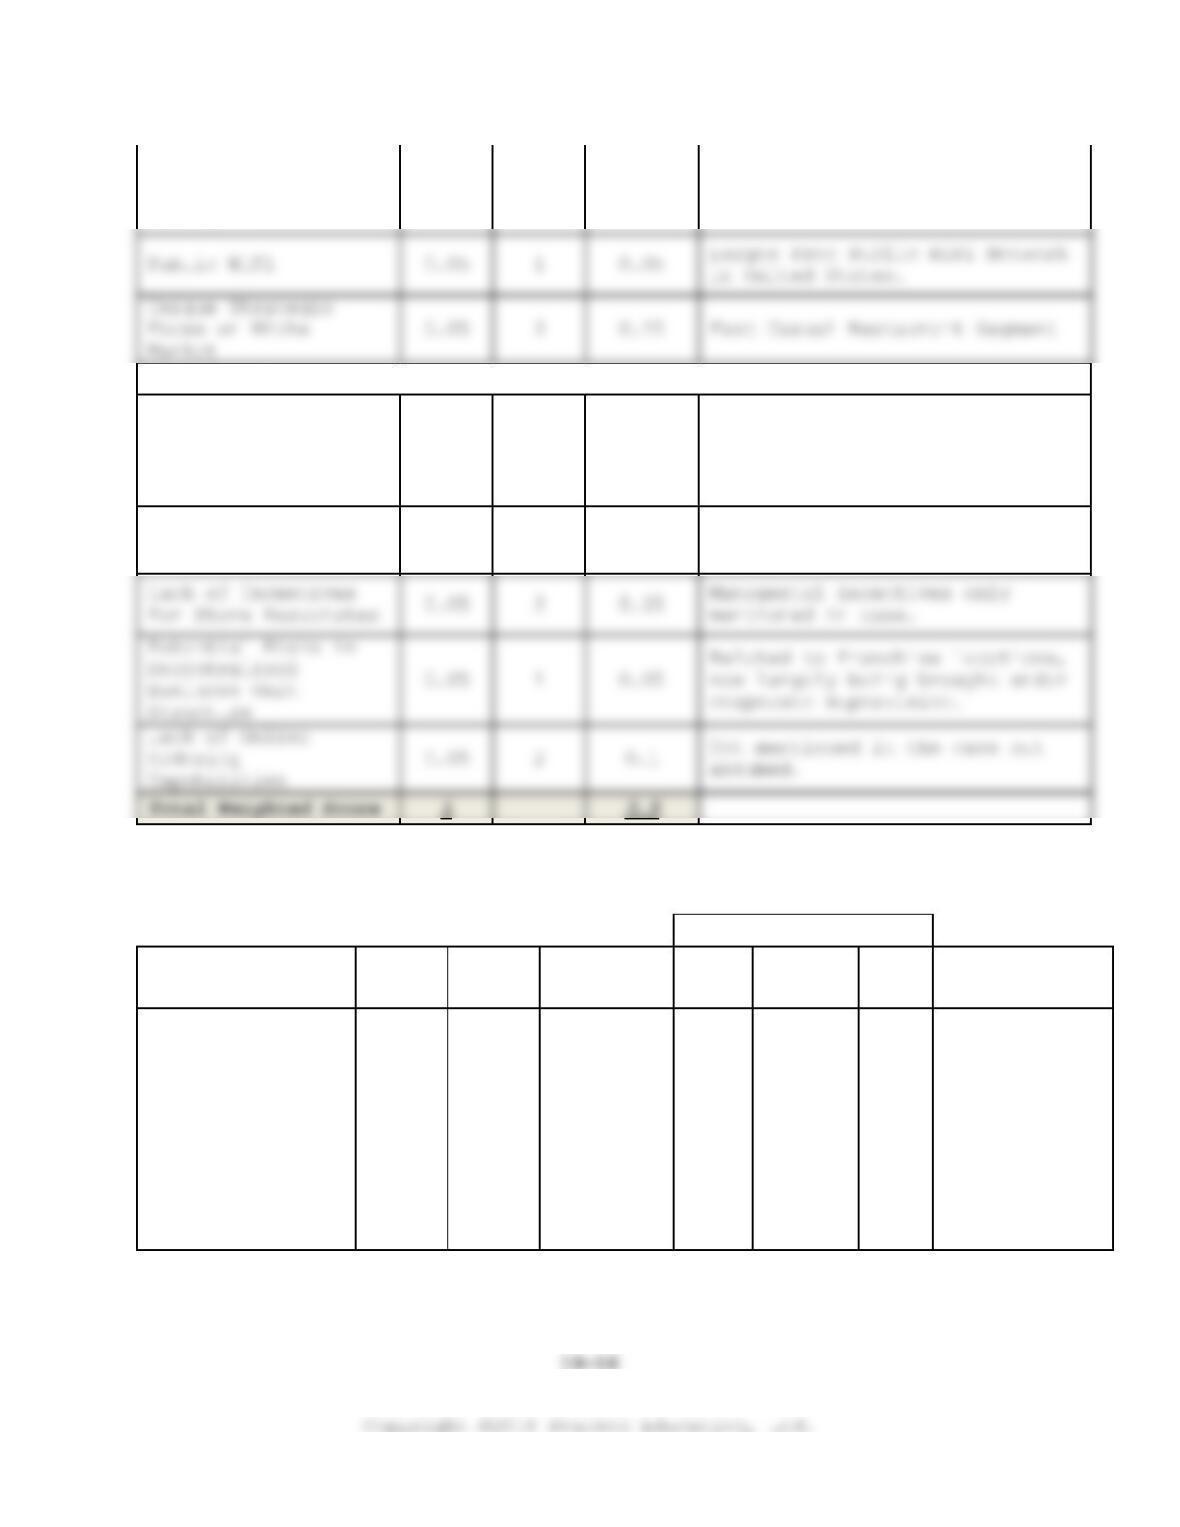
Exhibit 1: External Factor Analysis Summary (EFAS)
External
Strategic
Factors
Weight
Rating
Weighted
Score
Comments
CASE 19
Panera Bread Company (2010): Still Rising Fortunes?
19–13
Opportunities
Trade–down from
Dining Out
0.1
3
0.3
Customers are still eating out, but
are now using casual dining to lower
cost.
Dining Segment
Sales Growth
0.05
5
0.25
Panera has increased prices to
improve margins, due to the fact
that their dining category is
growing.
0.05
5
0.25
By providing free Wi–Fi, customers
4
0.4
POS Data
Acquisition
0.05
2
0.1
Panera could use the data collection
from programmable registers to learn
more about their customer base.
0.05
3
0.15
Commitment to community (Pay what
Organic/Fresh
0.1
5
0.5
They only use anti–biotic free
Threats
Economic
Recession
0.05
4
0.2
Rather than focusing on customers
who are unemployed, they focus their
energy on the 90 percent of customer
who is still employed.
Same Store
Sales
0.05
2
0.1
To boost sales they are offering
additional items to customers at a
better “price point.”
Competitors Low
Prices
0.1
1
0.1
This is not considered a serious
threat to Panera, they actually
raised prices.
Trade–down to
Fast Food
0.05
3
0.15
Due to the healthy nature of their
product, they believe people will
not trade down.
0.15
1
customers to place their orders
CASE 19
Panera Bread Company (2010): Still Rising Fortunes?
19–14
Total Weighted
Score
1
3.05
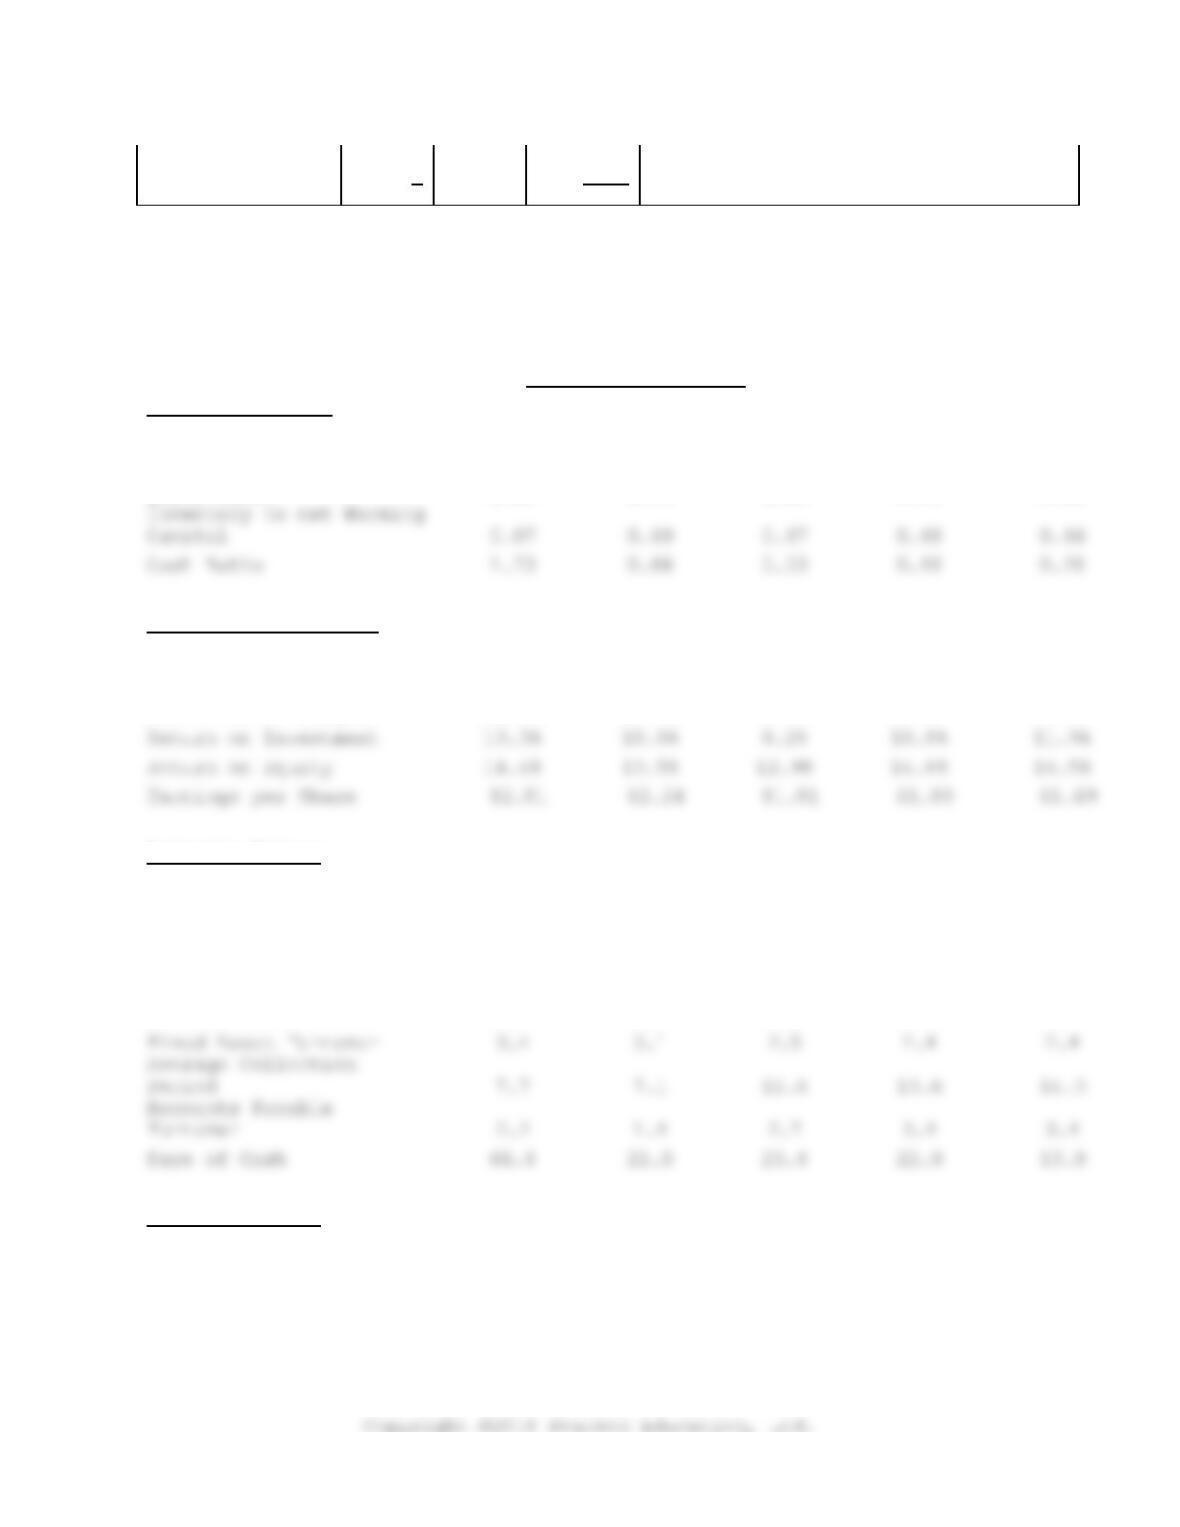
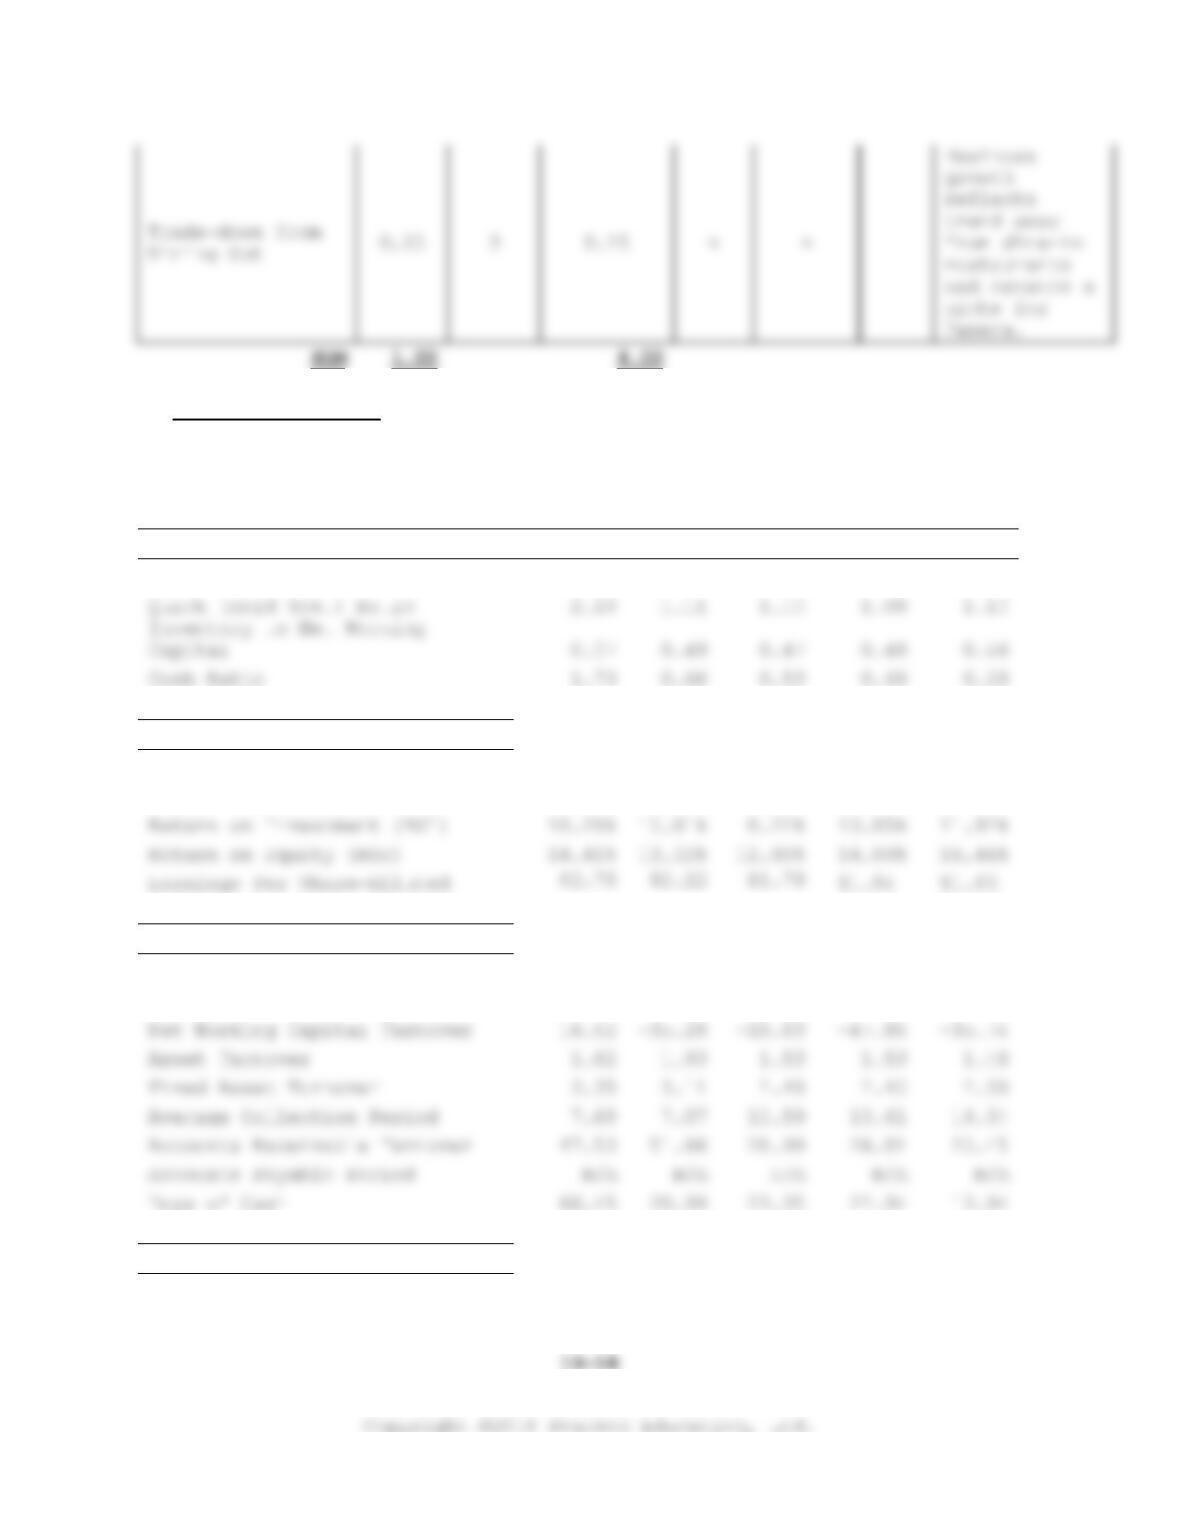
Exhibit 2—Financial Ratios
Panera Bread Ratios
Liquidity Ratios
2009
2008
2007
2006
2005
Current Ratio
2.26
1.21
1.19
1.16
1.18
Quick Ratio
2.18
1.11
1.10
1.08
1.10
0.07
0.49
0.47
0.48
0.46
Cash Ratio
1.73
0.66
0.53
0.48
0.28
Profitability Ratios
Net Profit Margin
6.4%
5.2%
5.4%
7.1%
8.2%
Gross Profit Margin
21.7%
20.6%
21.0%
24.2%
25.8%
Return on Investment
10.3%
10.0%
8.2%
10.8%
11.9%
Return on Equity
14.4%
13.5%
12.9%
14.8%
16.5%
Activity Ratios
Inventory Turnover
110.1
108.6
93.6
95.1
87.0
Days of Inventory
4.2
4.2
4.9
5.1
5.7
Net Working Capital
Turnover
7.5
53.2
43.8
46.0
40.2
Asset Turnover
1.6
1.9
1.5
1.5
1.5
Fixed Asset Turnover
3.4
3.1
2.5
2.4
2.4
Average Collection
Period
7.7
7.1
12.6
13.6
14.3
Accounts Payable
Turnover
2.2
1.4
2.7
3.4
3.4
Days of Cash
66.4
21.0
23.4
22.9
13.9
Leverage Ratios
Debt to Asset Ratio
N/A
N/A
10.7%
N/A
N/A
CASE 19
Panera Bread Company (2010): Still Rising Fortunes?
19–15
Debt to Equity Ratio
N/A
N/A
16.8%
N/A
N/A
N/A
N/A
16.8%
N/A
N/A
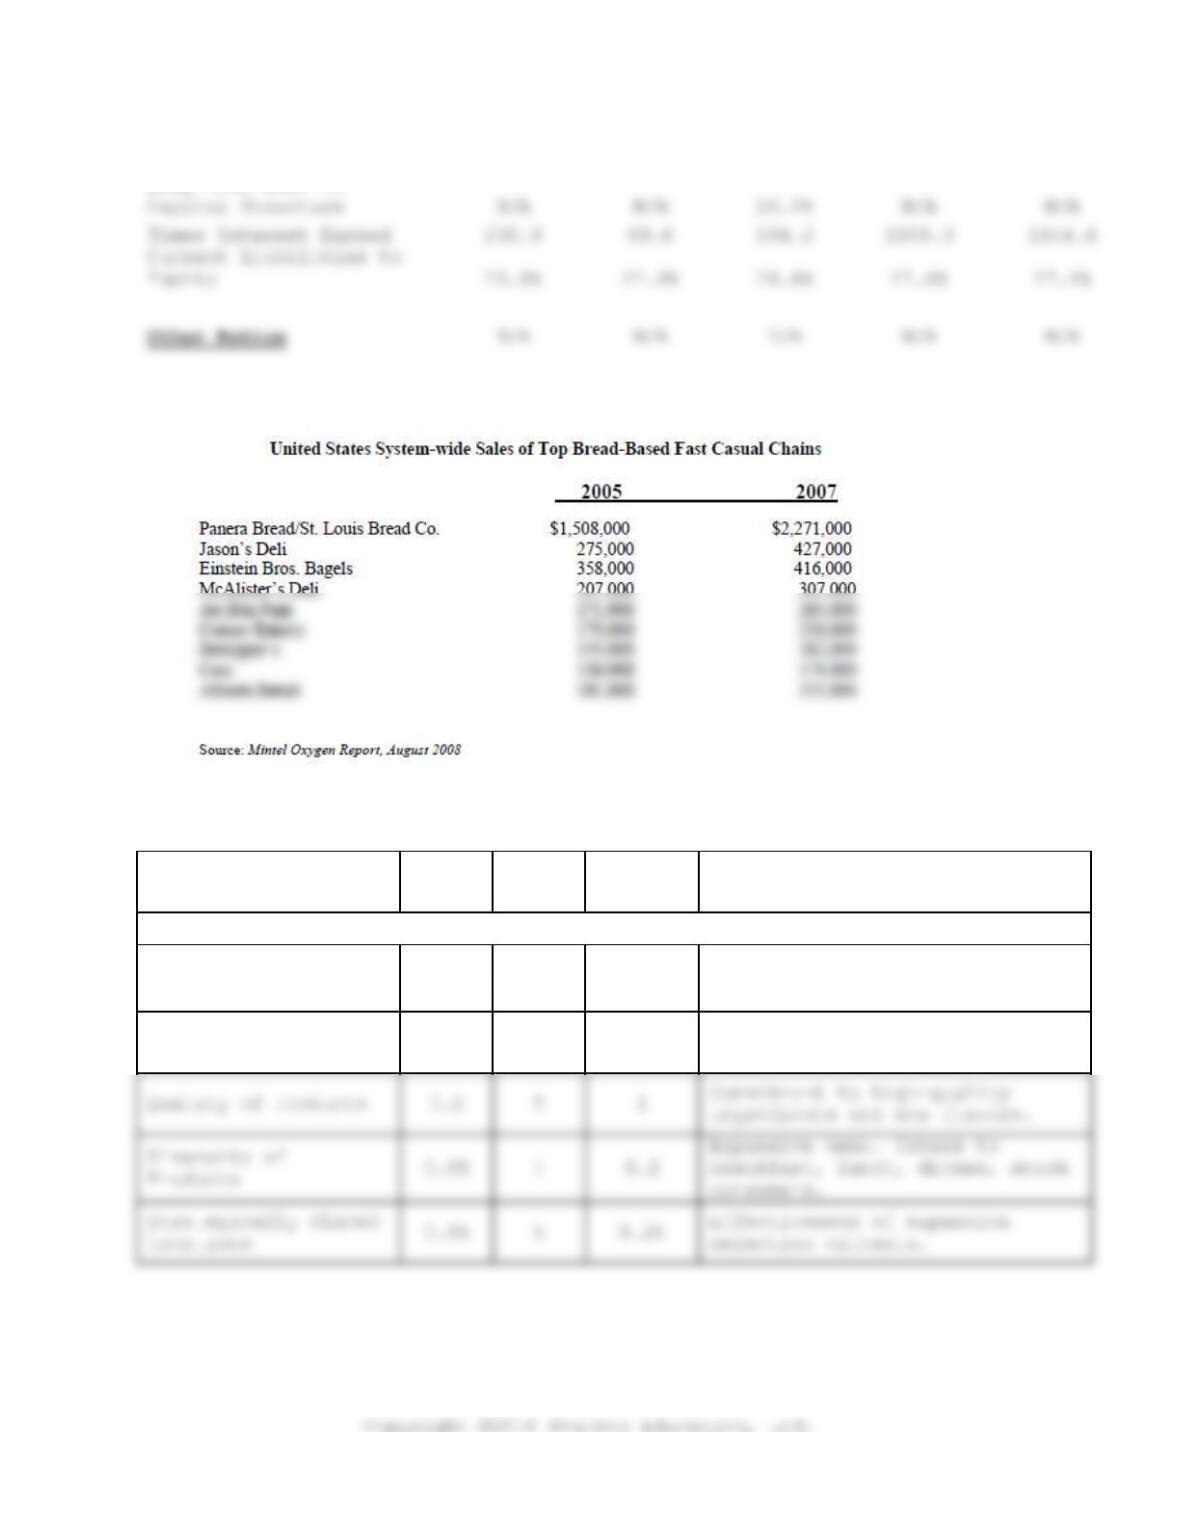
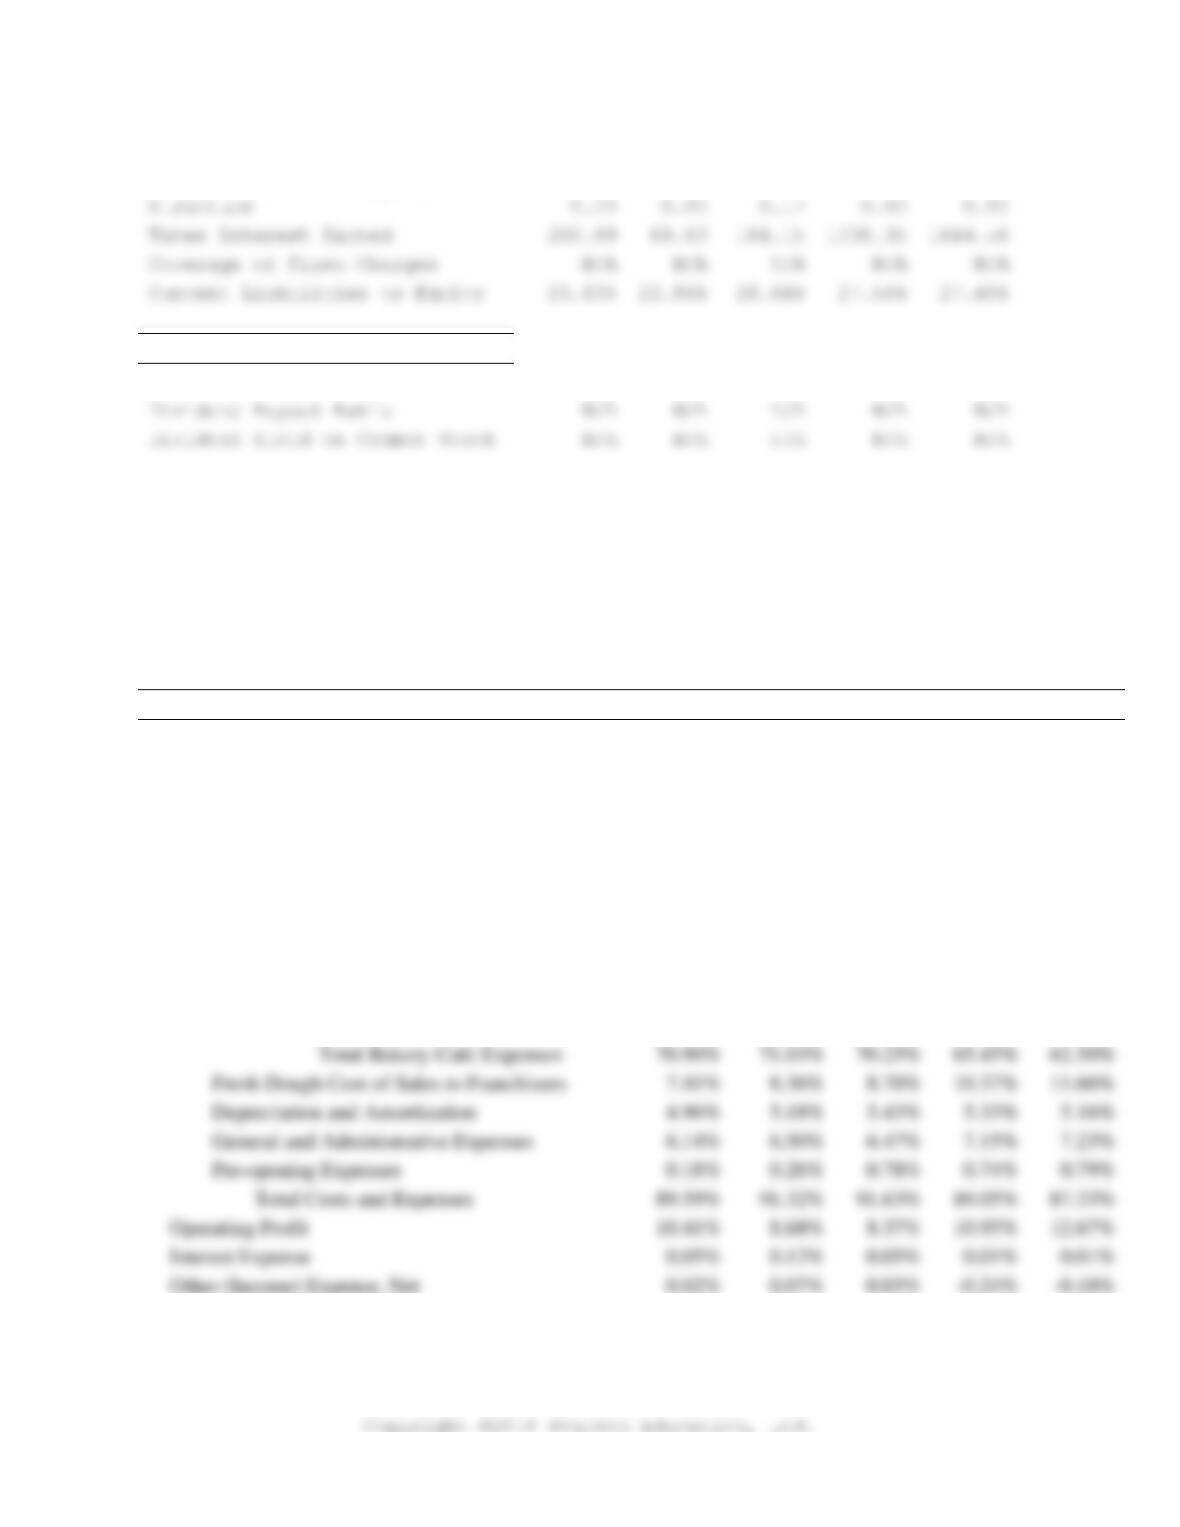
Times Interest Earned
184.2
28.6%
N/A
N/A
N/A
N/A
Long–term Debt to
Exhibit 3—Sales for top Fast Casual Chains in the United States
Exhibit 4—Internal Factor Analysis Summary (IFAS)
Internal Factors
Weight
Rating
Weighted
Score
Comments
Strengths
Functional
Integration with
Strategic Goals
0.1
4
0.4
HR, Finance, Information
Systems, etc.: all contribute to
overall vision.
Superior Customer
Service
0.2
3
0.6
Due to well–trained employees
and “total customer experience.”
0.2
5
Commitment to high–quality
5
CASE 19
Panera Bread Company (2010): Still Rising Fortunes?
Monetary Incentives
for Managerial Level
Employees
0.05
2
0.1
Joint Venture Program
0.05
3
Weaknesses
Limited Large–Scale
Marketing Efforts
0.05
5
0.25
**Difficult to find weaknesses
due to success in an economic
recession and nature of
description provided in the
case.
Almost Entirely
U.S.—Based
0.05
4
0.2
Limited/no presence in
international market
(three locations in Canada).
0.05
1
0.05
2
0.1
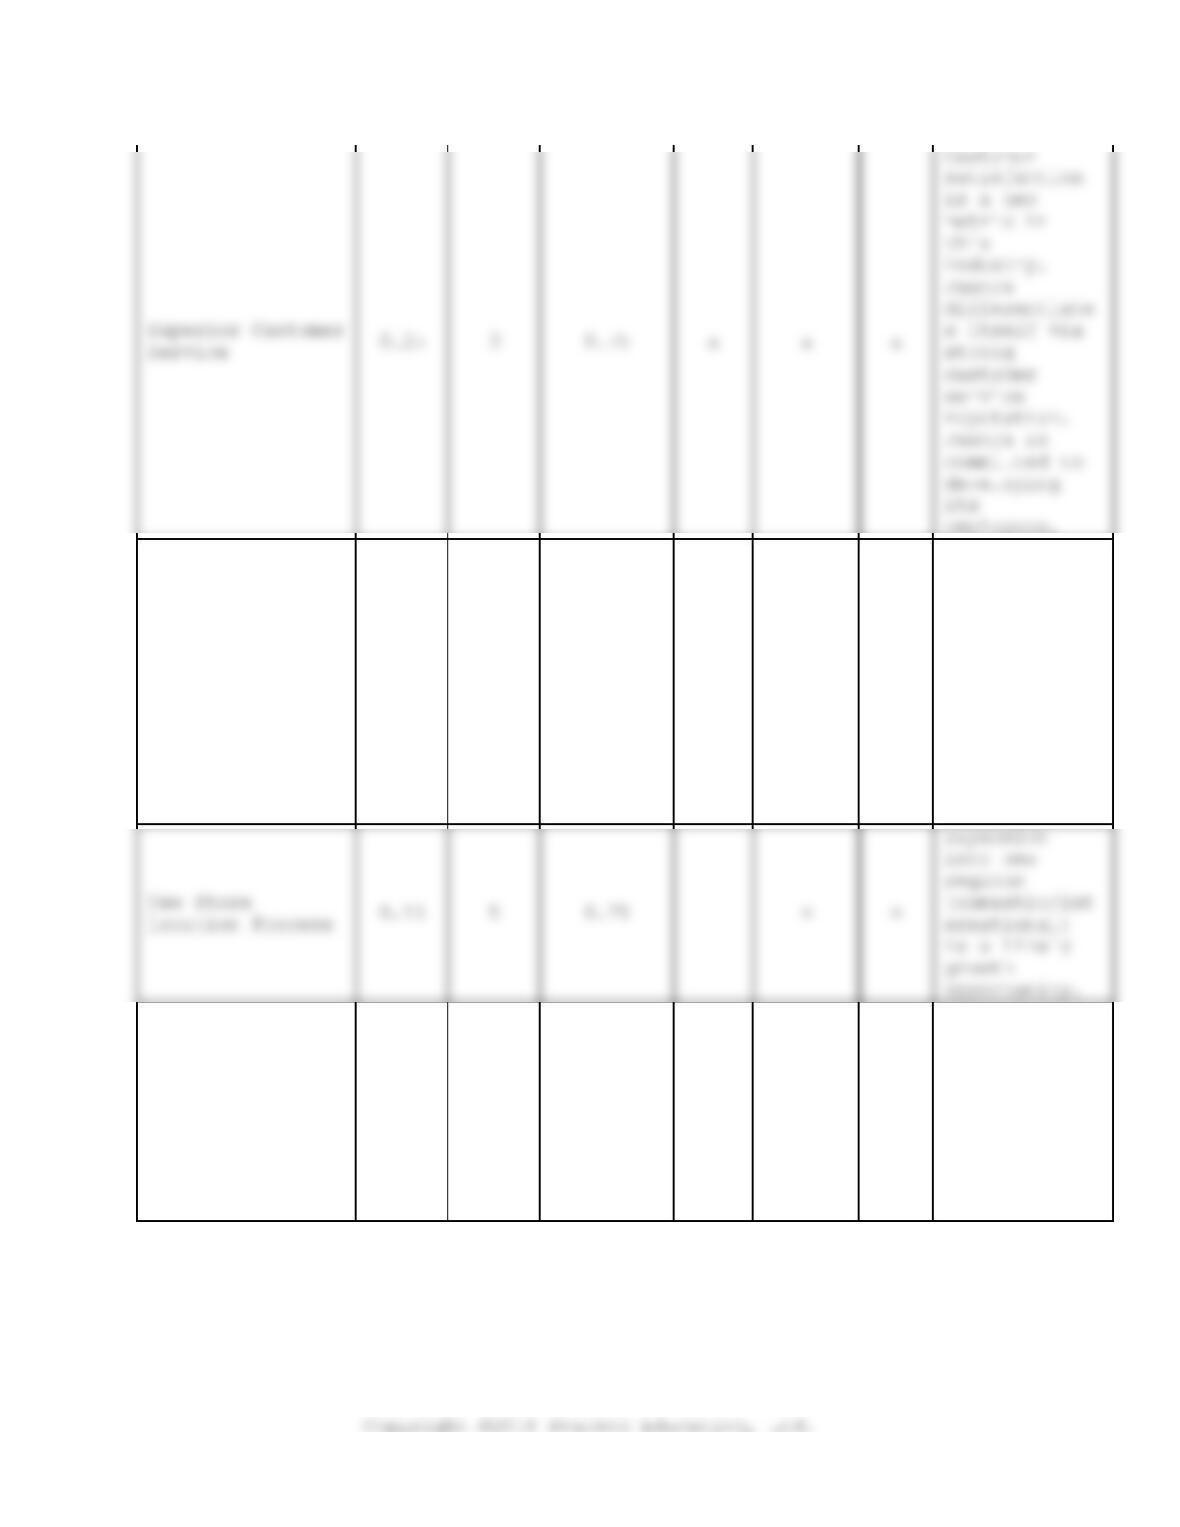
Exhibit 5—Strategic Factor Analysis Summary (SFAS)
Duration
Strategic Factor
Analysis
Weight
Rating
Weighted
Score
Short
Inter–
mediate
Long
Comment
Quality/Diversity
of Products
0.3
5
1.5
x
x
x
Reputation
based on high
quality,
flavorful,
healthy
choices.
Foundation
behind price
point
establishment
.
CASE 19
Panera Bread Company (2010): Still Rising Fortunes?
19–17
Functional
Integration with
Strategic Goals
0.2
4
0.8
x
x
x
Integration
and
information
sharing
enhance
capability to
develop new
products,
share best
practices,
and manage
business
functions.
On–line Ordering
0.05
1
0.05
x
x
Competition
is expanding
its
capabilities
based on the
increasing
presence and
utilization
of IT by
consumers.
CASE 19
Panera Bread Company (2010): Still Rising Fortunes?
X. FINANCIAL ANALYSIS
A. FINANCIAL RATIOS
YEARS
1. Liquidity Ratios
2009
2008
2007
2006
2005
Current Ratio
1.34
0.79
0.61
0.88
0.85
Quick (Acid Test) Ratio
2.18
1.11
1.10
1.08
1.10
0.07
0.49
0.47
0.48
0.46
Cash Ratio
1.73
0.66
0.53
0.48
0.28
2. Profitability Ratios
Net Profit Margin
6.36%
5.19%
5.39%
7.10%
8.15%
Gross Profit Margin
10.41%
8.68%
8.37%
10.95%
12.67%
Return on Investment (ROI)
10.28%
10.01%
8.22%
10.85%
11.92%
Return on Equity (ROE)
14.41%
13.52%
12.88%
14.80%
16.46%
Earnings Per Share—Diluted
$1.84
$1.65
3. Activity Ratios
Inventory Turnover
110.08
108.61
93.62
95.13
87.02
Days of Inventory
3.70
3.68
4.25
4.31
4.80
Net Working Capital Turnover
16.52
Asset Turnover
1.62
1.93
1.53
1.53
1.46
Fixed Asset Turnover
3.35
3.11
2.48
2.40
2.38
Average Collection Period
7.68
7.07
12.59
13.61
14.34
Accounts Receivable Turnover
47.50
51.66
28.99
26.81
25.45
Accounts Payable Period
N/A
N/A
N/A
Days of Cash
66.45
20.99
23.35
22.94
13.94
4. Leverage Ratios
Debt to Asset Ratio
28.68%
26.00%
36.15%
26.71%
27.58%
CASE 19
Panera Bread Company (2010): Still Rising Fortunes?
19–19
Debt to Equity Ratio
40.22%
35.14%
56.61%
36.45%
38.07%
Structure
0.00
0.00
0.00
0.00
Times Interest Earned
200.89
69.63
184.15
1008.35
1644.56
Coverage of Fixed Charges
N/A
N/A
N/A
N/A
N/A
Current Liabilities to Equity
23.83%
22.86%
28.64%
27.56%
27.40%
Long–term Debt to Capital
5. Other Ratios
Price/Earnings Ratio
N/A
N/A
N/A
N/A
N/A
Dividend Payout Ratio
N/A
N/A
N/A
N/A
N/A
Dividend Yield on Common Stock
N/A
N/A
N/A
N/A
N/A
* N/A—Key information Not
Available
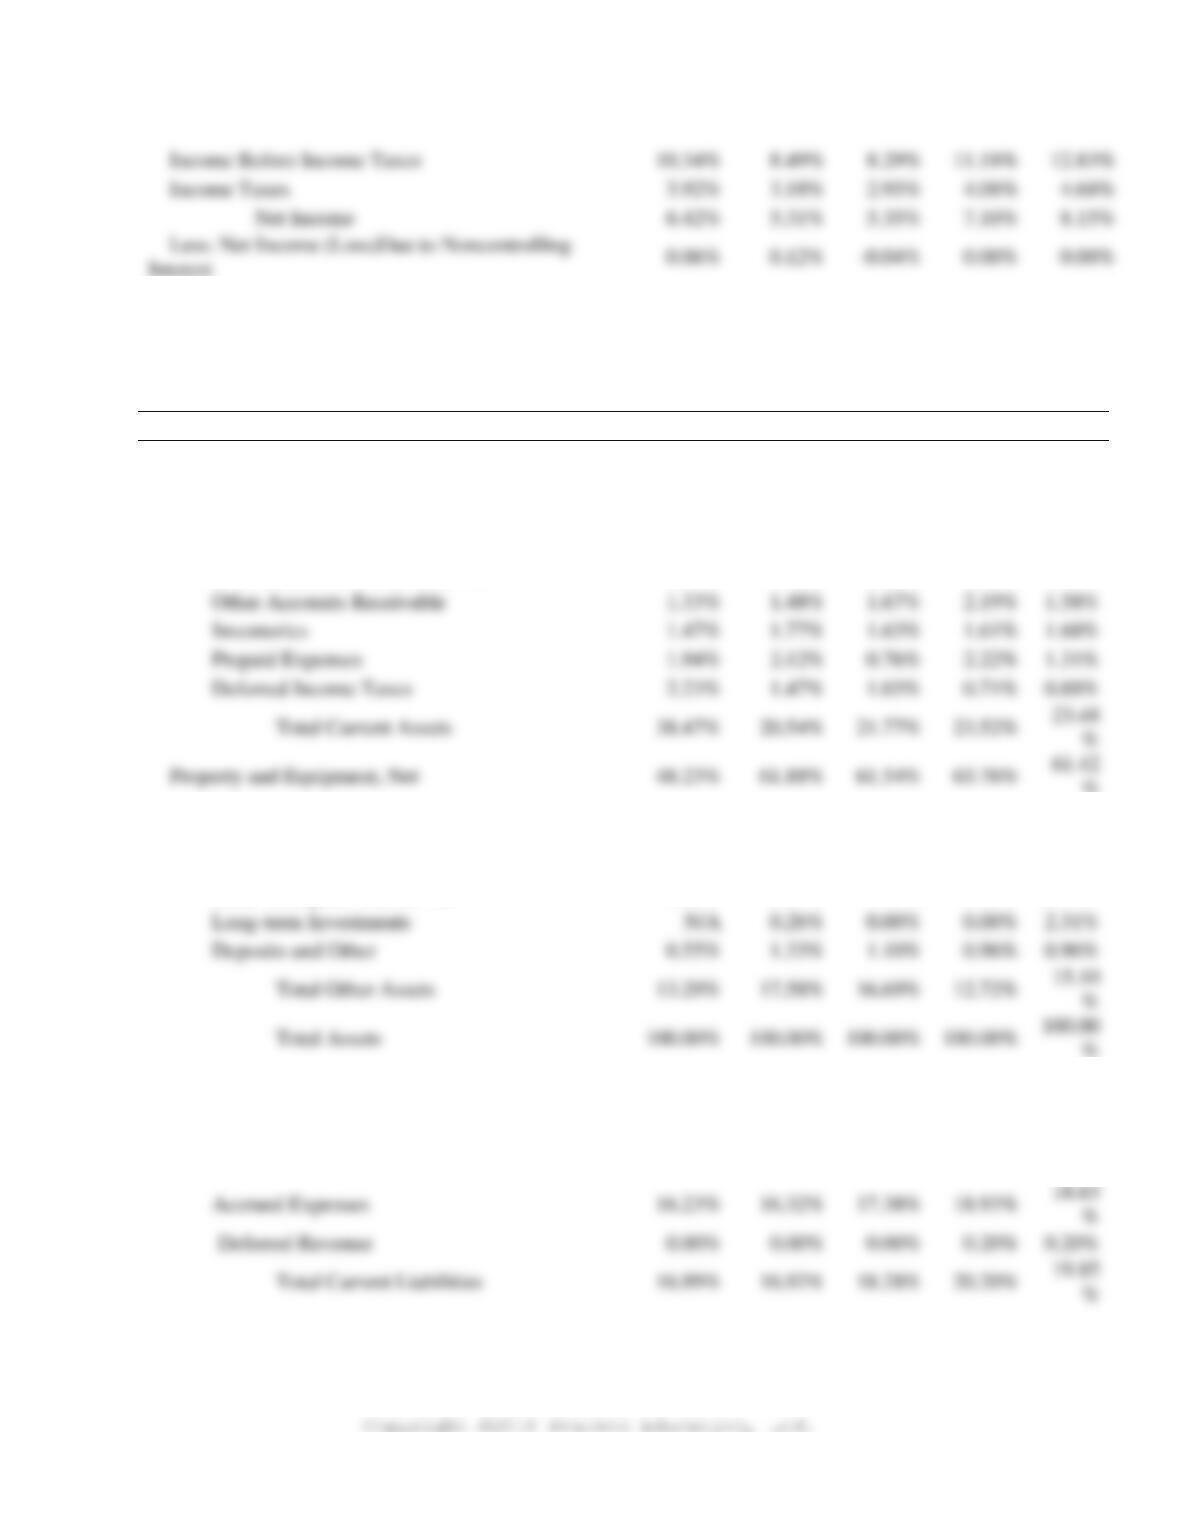
B. COMMON SIZED STATEMENTS
CONSOLIDATED STATEMENT
INCOME STATEMENT
Year Ending December
2009
2008
2007
2006
2005
Revenues:
Bakery-Cafe Sales
85.21%
85.17%
83.90%
80.36%
78.00%
Franchise Royalties and Fees
5.79%
5.76%
6.30%
7.42%
8.48%
Fresh Dough Sales to Franchisees
9.00%
9.07%
9.81%
12.22%
13.52%
Total Revenue
100.00%
100.00%
100.00%
100.00%
100.00%
Costs and Expenses:
Bakery-Cafe Expenses:
Cost of Food and Paper Products
24.94%
25.61%
25.45%
23.75%
22.34%
Labor
27.38%
27.14%
26.83%
24.72%
23.67%
Occupancy
7.09%
6.96%
6.60%
5.86%
5.55%
Other Operating Expenses
11.48%
11.32%
11.37%
11.12%
10.93%
70.90%
71.03%
70.25%
65.45%
62.50%
Fresh Dough Cost of Sales to Franchisees
7.41%
8.36%
8.70%
10.37%
11.66%
Depreciation and Amortization
4.96%
5.18%
5.43%
5.33%
5.16%
General and Administrative Expenses
6.14%
6.50%
6.47%
7.15%
7.23%
Pre-opening Expenses
0.18%
0.26%
0.78%
0.74%
0.79%
Total Costs and Expenses
89.59%
91.32%
91.63%
89.05%
87.33%
Operating Profit
10.41%
8.68%
8.37%
10.95%
12.67%
Interest Expense
0.05%
0.12%
0.05%
0.01%
0.01%
Other (Income) Expense, Net
0.02%
0.07%
0.03%
CASE 19
Panera Bread Company (2010): Still Rising Fortunes?
19–20
Net Income Attributable to Panera
6.36%
5.19%
5.39%
7.10%
8.15%
BALANCE SHEET
For the year ending
2009
2008
2007
2006
2005
ASSETS
Current assets:
Cash and Cash Equivalents
29.43%
11.09%
9.77%
9.60%
5.59%
Short-term Investments
N/A
0.36%
3.32%
3.69%
8.27%
Trade Accounts Receivable, Net
2.07%
2.26%
3.60%
3.51%
4.17%
Other Accounts Receivable
1.33%
1.48%
1.67%
2.19%
1.58%
Inventories
1.47%
1.77%
1.63%
1.61%
1.68%
Prepaid Expenses
1.94%
2.12%
0.76%
2.22%
1.31%
Deferred Income Taxes
2.23%
1.47%
1.03%
0.71%
0.88%
38.47%
20.54%
21.77%
23.52%
23.48
%
61.42
%
Other Assets:
Goodwill
10.45%
12.96%
12.46%
10.54%
11.09
%
Other Intangible Assets, Net
2.29%
3.04%
3.12%
1.22%
0.74%
Long-term Investments
N/A
0.26%
0.00%
0.00%
2.31%
Deposits and Other
0.55%
1.33%
1.10%
0.96%
0.96%
%
LIABILITIES
Current Liabilities:
Accounts Payable
0.77%
0.60%
0.91%
1.07%
1.01%
18.63
%
0.00%
0.20%
16.99%
16.92%
18.28%
20.20%
19.85
%
Income Before Income Taxes
10.34%
8.49%
8.29%
Income Taxes
3.92%
3.18%
2.95%
4.08%
4.68%
6.42%
5.31%
5.35%
7.10%
8.15%
CASE 19
Panera Bread Company (2010): Still Rising Fortunes?
19–21
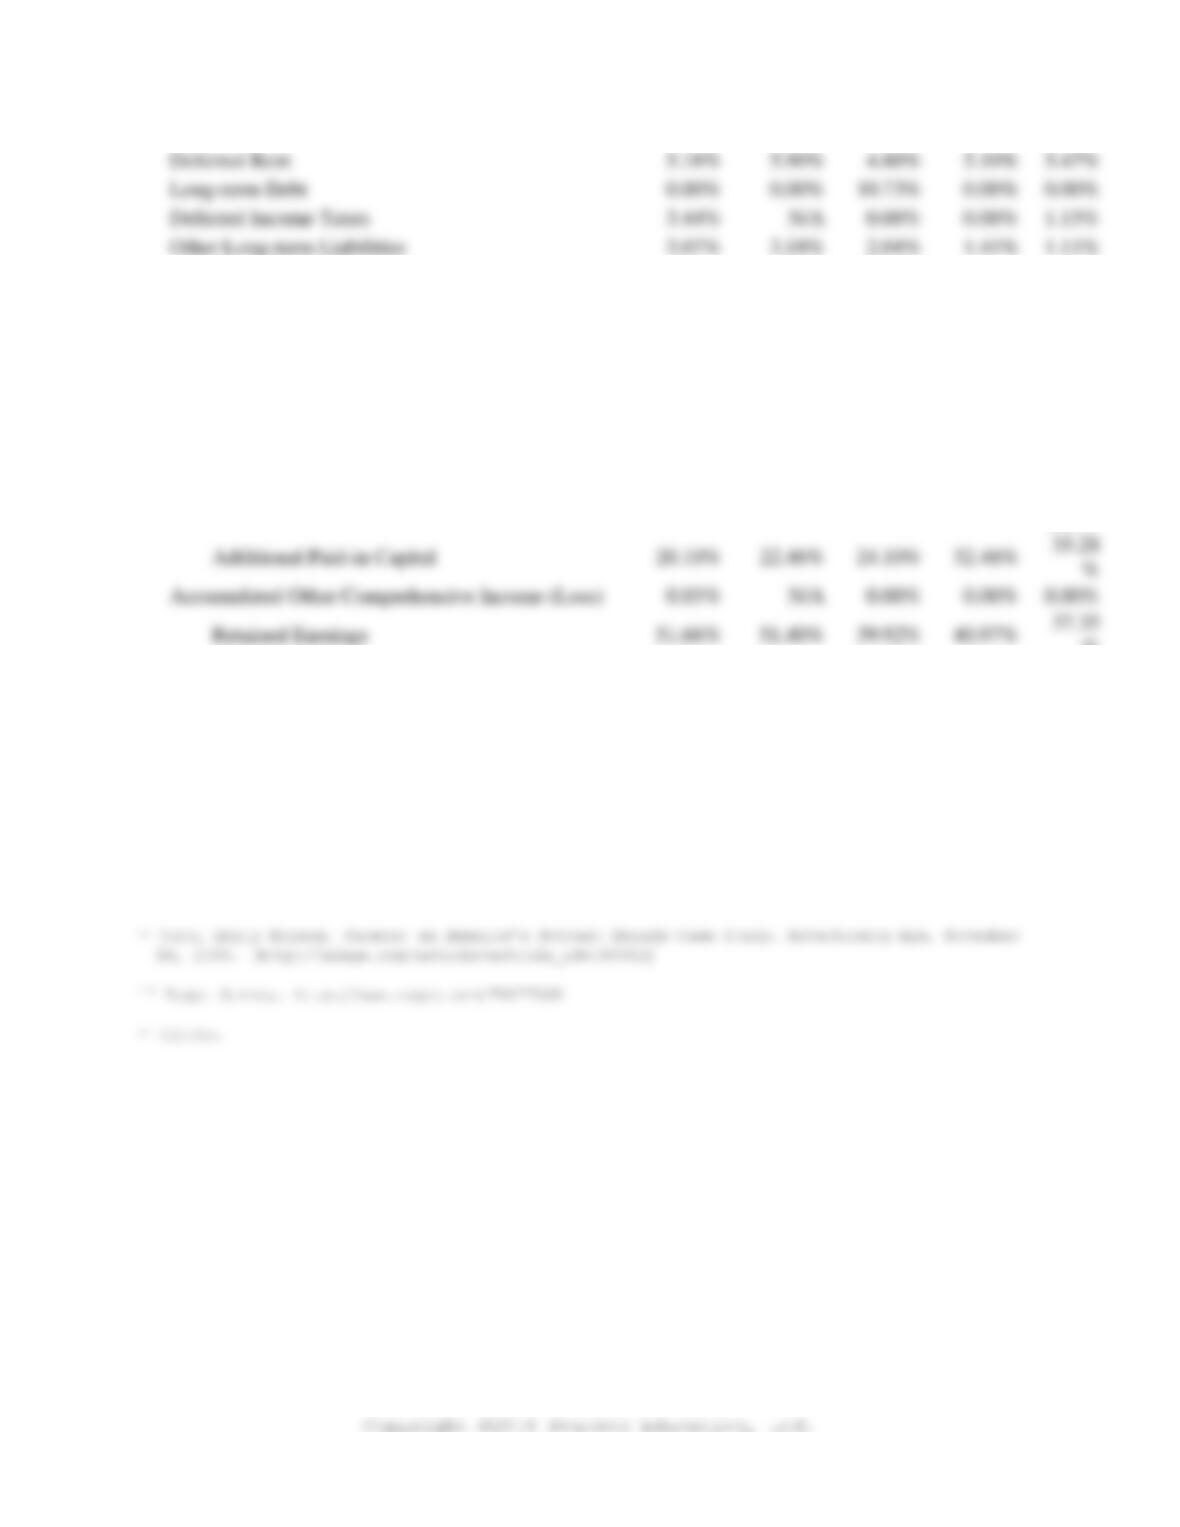
Deferred Rent
5.18%
5.90%
4.80%
5.10%
5.47%
Long-term Debt
0.00%
0.00%
0.00%
0.00%
Deferred Income Taxes
3.44%
N/A
0.00%
0.00%
1.15%
Other Long-term Liabilities
3.07%
3.18%
2.04%
1.41%
1.11%
Total Liabilities
28.68%
26.00%
35.86%
26.71%
27.58
%
Commitments and Contingencies (Note 13)
EQUITY
Panera Bread Company Stockholders’ Equity:
Common Stock, $.0001 par Value:
Class A, 75,000,000 Shares Authorized
0.00%
0.00%
0.00%
0.00%
0.00%
Class B, 10,000,000 Shares Authorized
N/A
N/A
0.00%
0.00%
0.00%
Treasury Stock, Carried at Cost
N/A
N/A
-0.17%
-0.17%
–
0.21%
Additional Paid-in Capital
20.10%
22.46%
24.10%
32.48%
35.28
%
Accumulated Other Comprehensive Income (Loss)
0.03%
N/A
0.00%
0.00%
0.00%
51.66%
51.40%
39.92%
40.97%
37.35
%
Total Panera Bread Company
Stockholders’ Equity
71.32%
73.48%
63.85%
73.29%
72.42
%
Noncontrolling Interest
N/A
0.52%
0.29%
0.00%
0.00%
Total Equity
71.32%
74.00%
63.85%
73.29%
72.42
%
Total Equity and Liabilities
100.00%
100.00%
100.00%
100.00%
100.00
%
i Horovitz, Bruce, “Panera Bakes a Recipe for Success,” USA Today, July 23, 2009, p. 1.