Chapter 17 – Project Management
17–15
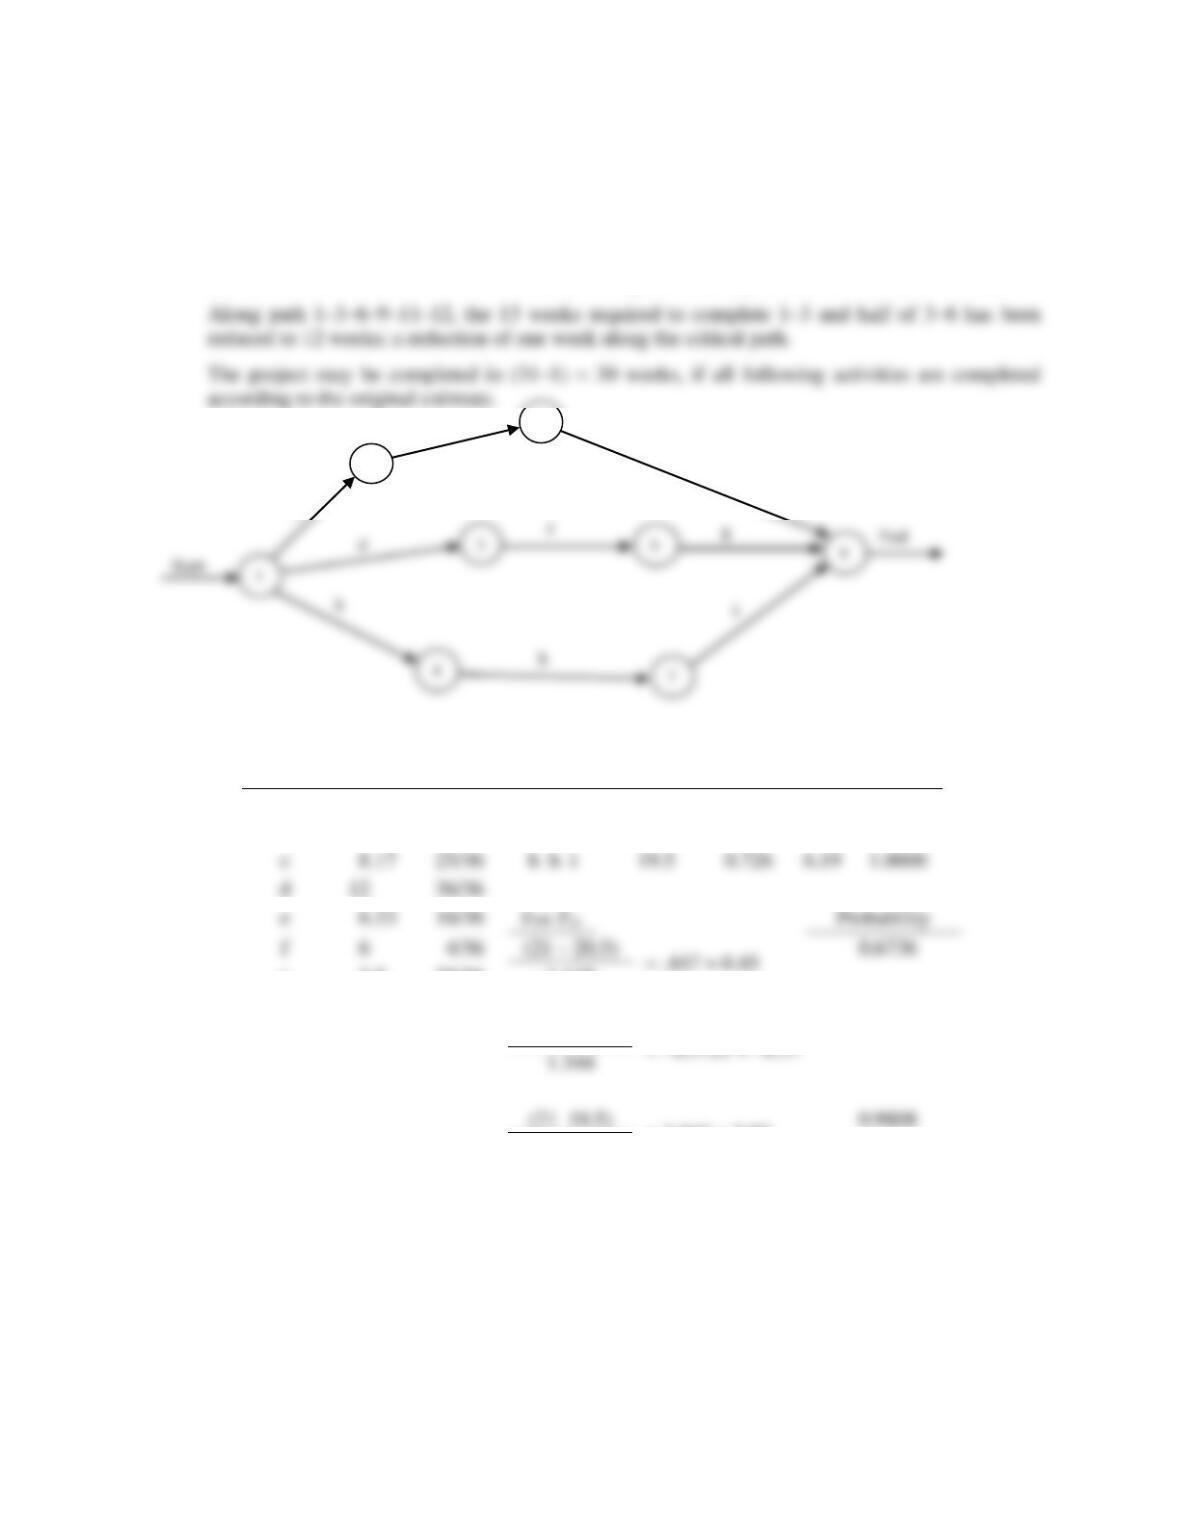
6. The network diagram is given in Problem 1, Part a.
For path 1–2–4–7–10–12, the 13 weeks required for 1–2–4 has been reduced to 12 weeks. On
path 1–2–5–8–10–12, the 12 weeks required for 1–2–5 has been increased to (about) 14 weeks
[12+(8–6)]. However, 1–2–5–8–10–12 is not along the critical path and has a slack of 7 weeks.
7. a.
6
4
g
i
f
d
b
h
b.
Activity
te
2
Path
Expected
Duration
Std.
Dev.
24
Prob.
a
6
4/36
a–c–e
20.5
1.118
3.13
0.9991
b
8.5
9/36
d–f–g
21.5
1.344
1.86
0.9686
d
36/36
f
6
4/36
(21 – 20.5)
= .447 0.45
0.6736
g
3.5
25/36
1.118
h
4.17
1/36
i
6.83
9/36
(21 – 21.5)
1.344
0.9808
0.3557
= 2.065 2.07
0.7265
0.6736 x 0.3557 x 0.9808 = 0.235
2
5
c
e
a
Chapter 17 – Project Management
17–16
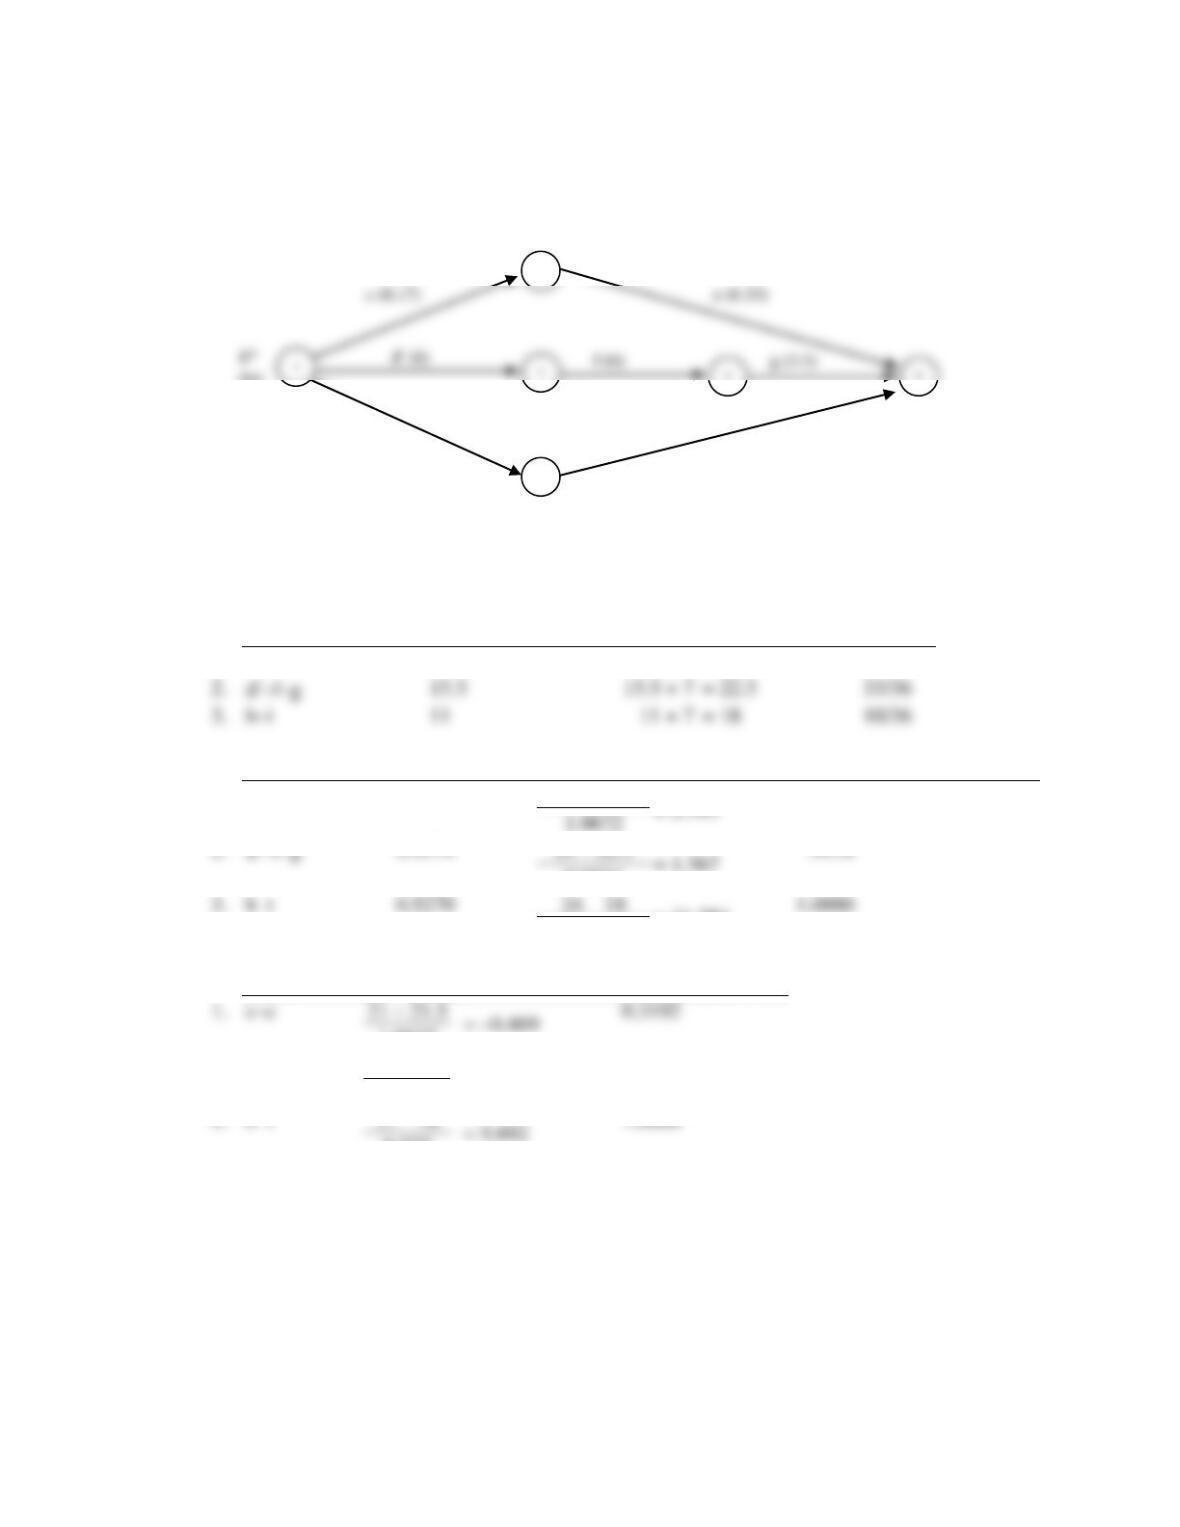
c. On the 8th day, the network could be reviewed as follows:
*Assume it is the beginning of the 8th day
1
3
8
6
f (6)
g (3.5)
Replace d by d and merge nodes (2) and (4) with (1).
d: te = 6: 2 = 4/36
7 days were used to complete activities a, b and one half of d. In the modified network:
Path
Expected Duration
from 8th day
Expected duration from
the start of the project
Variance
1.
c–e
14.50
14.50 + 7 = 21.5
41/36
2.
d–f–g
3.
11
11 + 7 = 18
10/36
Path
Standard Dev.
Z24
Probability (24)
1.
c–e
1.0672
24 – 21.5
= 2.343
.9904
0.9574
3.
1.0000
= 11.384
0.527
.9904(.9418)(1.0000) = .9328
Path
Z21
Probability (21)
1.
c–e
21 – 21.5
1.0672
2.
d–f–g
21 – 22.5
= –1.567
0.0582
0.9574
3.
0.527
.3192 (.0582)(1.0000) = 0.0186
5
7
i (6.83)
h (4.17)
day
e (6.33)
c (8.17)
Chapter 17 – Project Management
17–17
d. Crash activities F, C, and G one day each for a total cost of $23,000. Decide if an additional
expenditure of $3,000 over budget would be worth the cost, or if it would be better to crash only
one day (Activity F for a cost of $7,000), or don’t crash at all.
8.
Path
Expected
Duration
Std. Dev.
Z16
Z15
Z13
A
10
1.1
5.45
4.55
2.73
C
12
1.
4
3
1
D
15
1.7
0.59
0
–1.18
E
14
1.2
1.67
0.83
–0.83
(a) Prob. (T 16) = 1 x 1 x 1 x 0.7224 x 0.9525 = 0.6881
9. Solution
Path
Expected
duration
Std. dev.
z
Probability
1–2–3
4 + 5 = 9
1.64
0.61
.7291
10. Solution
a.
Path
Expected
duration
Std. Dev.
z for 11 wk.
Probability
1–2–4
4 + 6 = 10
1.14
0.88
.8106
1–3–4
2.00
b.
Path
Expected
duration
Std. dev.
z for 12 wk.
Probability
1–2–4
4 + 6 = 10
1.14
1.75
.9599
1–3–4
0
B
1.414
5.66
4.95
3.54
Chapter 17 – Project Management
17–18
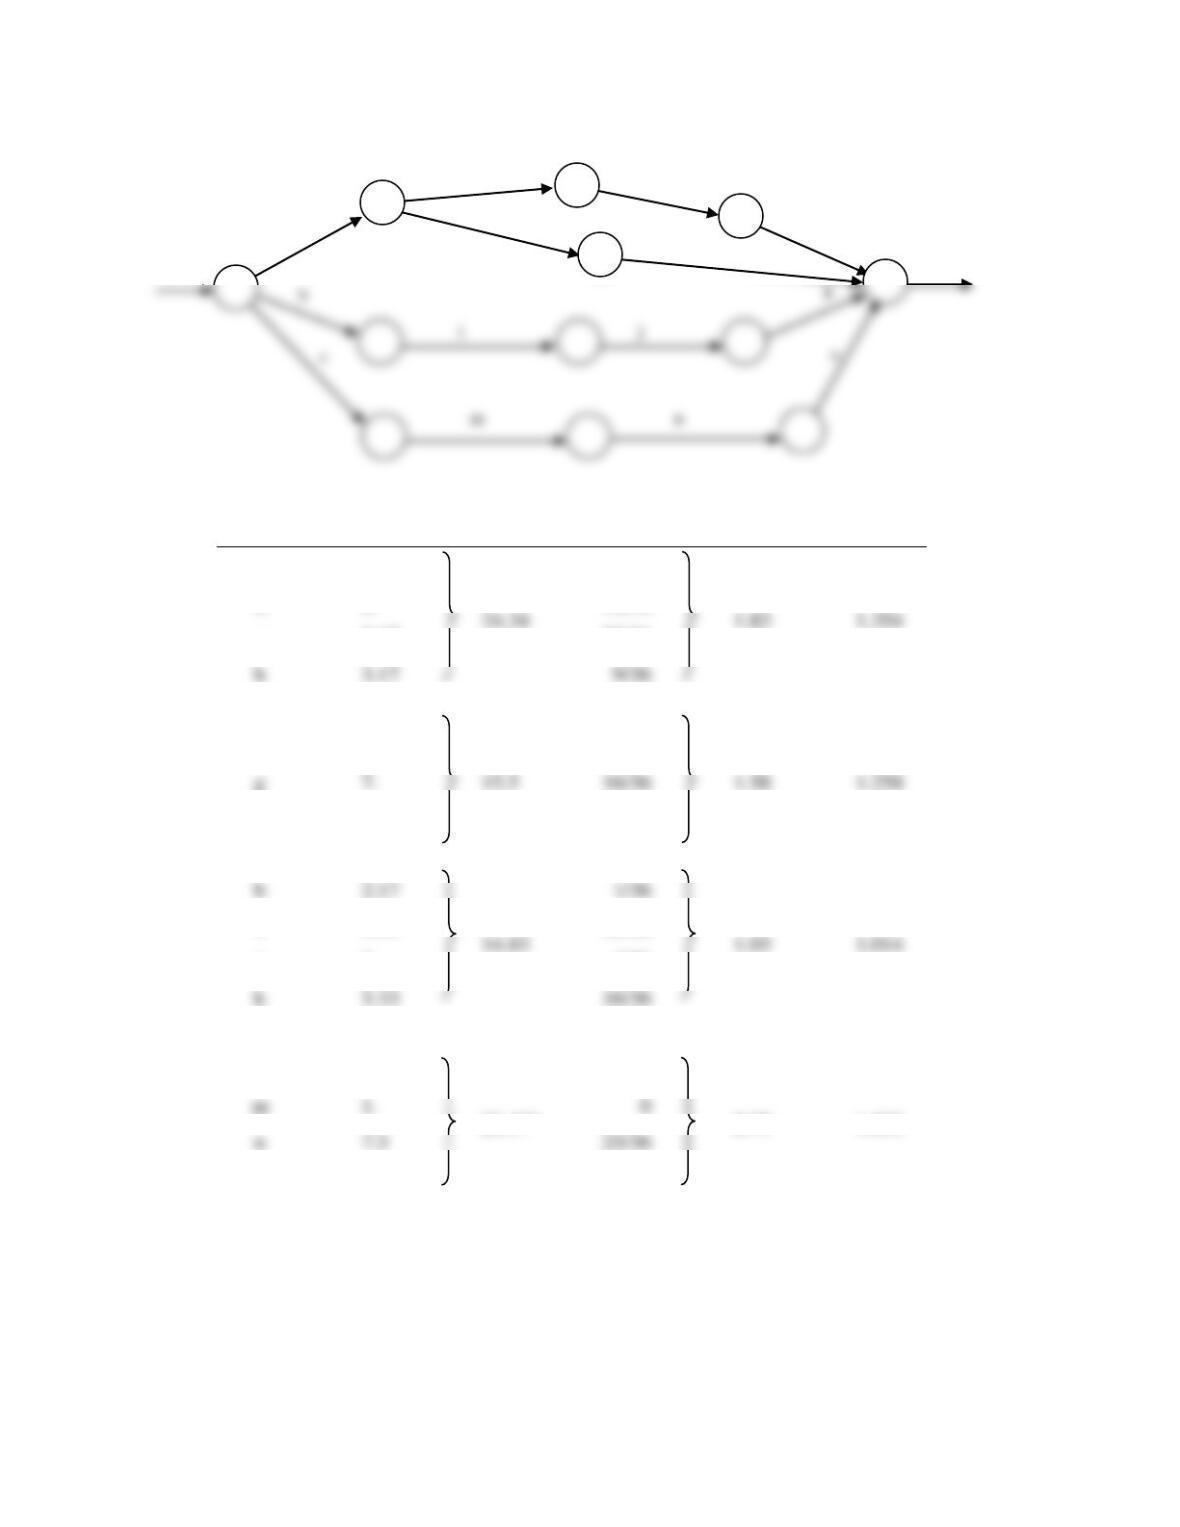
11. Project Management
a.
Path
Mean
Var.
Std. Dev.
z49
Prob.
z46
Prob.
1–2–4–6–11
43
5.11
2.26
2.65
.996
1.33
.9082
1–2–5–10–9–11
46.83
1.25
1.118
1.94
.9738
–0.74
.2296
Chapter 17 – Project Management
17–19
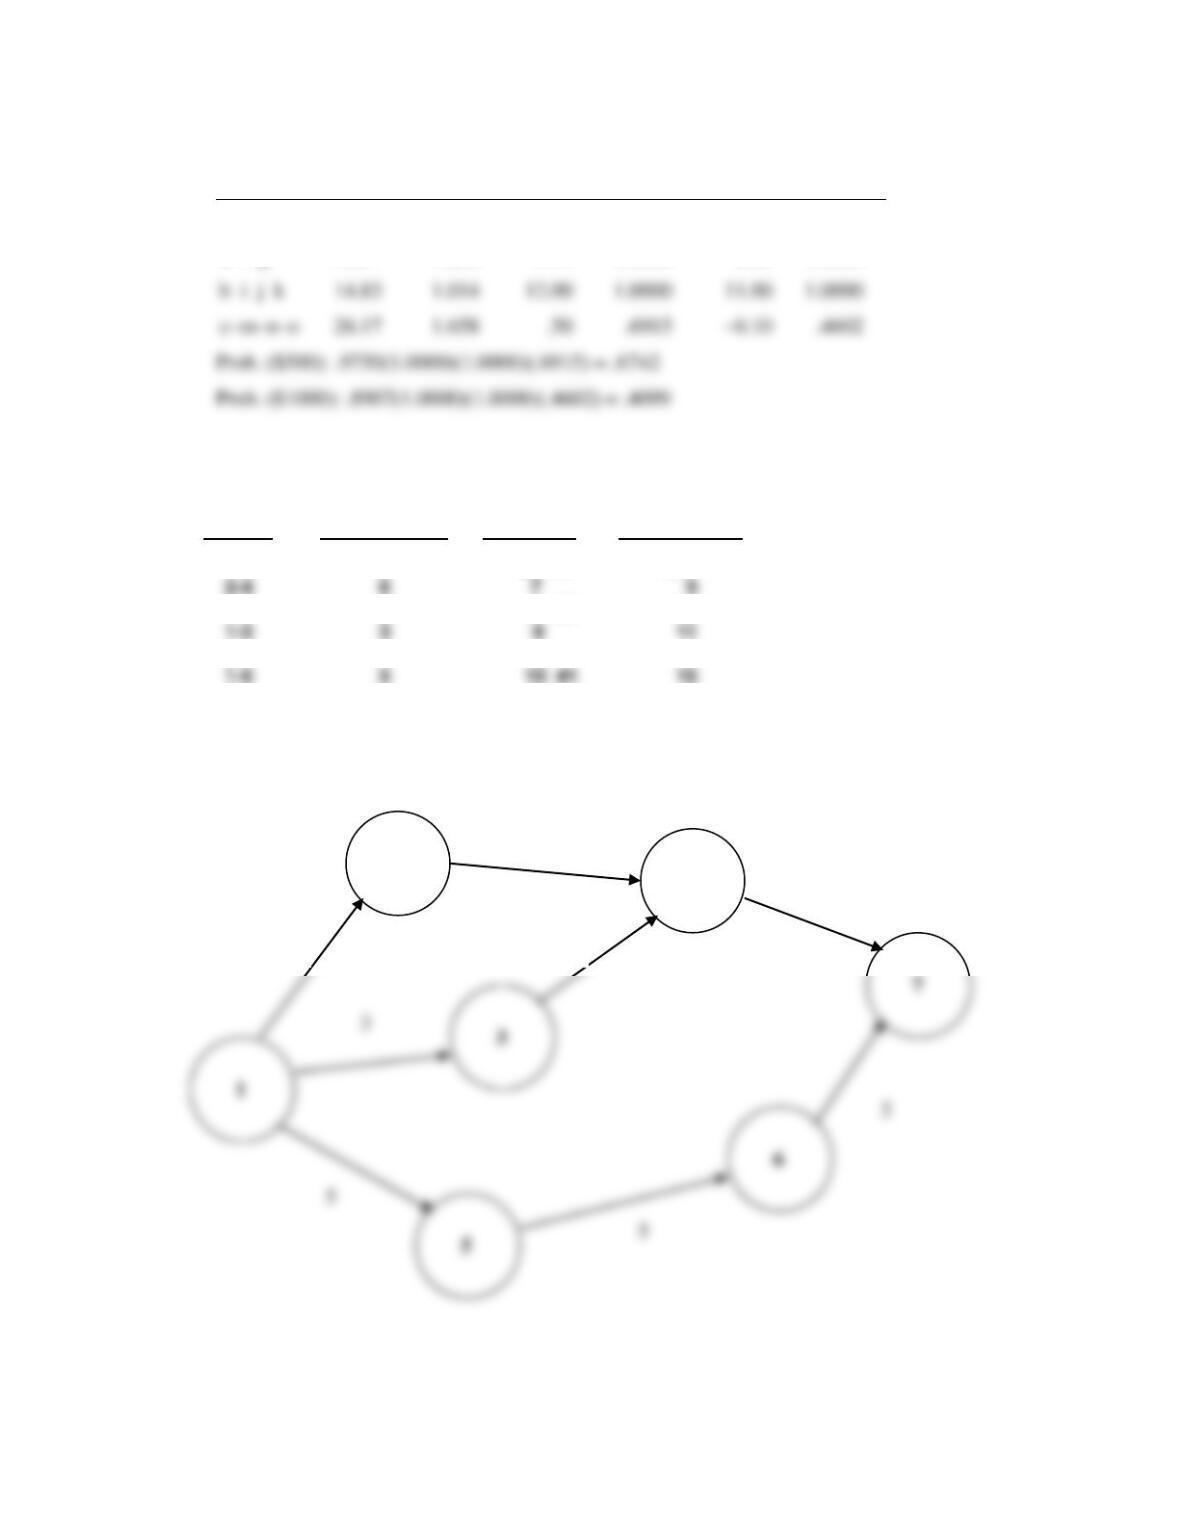
12.
Activity
Expected
Duration
Path
Mean
Variance
Path
Variance
Path Std.
Dev.
a
4.
16/36
d
8.
16/36
e
9.17
25/36
h
3.17
f
4.5
25/36
4.[a]
16/36
b
2.17
1/36
14.83
1.03
1.014
i
3.33
16/36
j
4.
4/36
k
5.33
16/36
c
8.17
26.17*
49/36
2.75
1.658
n
7.5
25/36
o
9.5
25/36
*critical path duration
h
d
a
g
f
e
End
Start
k
b
c
m
i
j
n
o
Chapter 17 – Project Management
17–20
Path
Mean
Std. Dev.
z27
Prob.
z26
Prob.
a–d–e–h
24.34
1.354
1.96
.9750
1.23
.8907
a–f–g
15.5
1.258
9.14
1.0000
8.35
1.0000
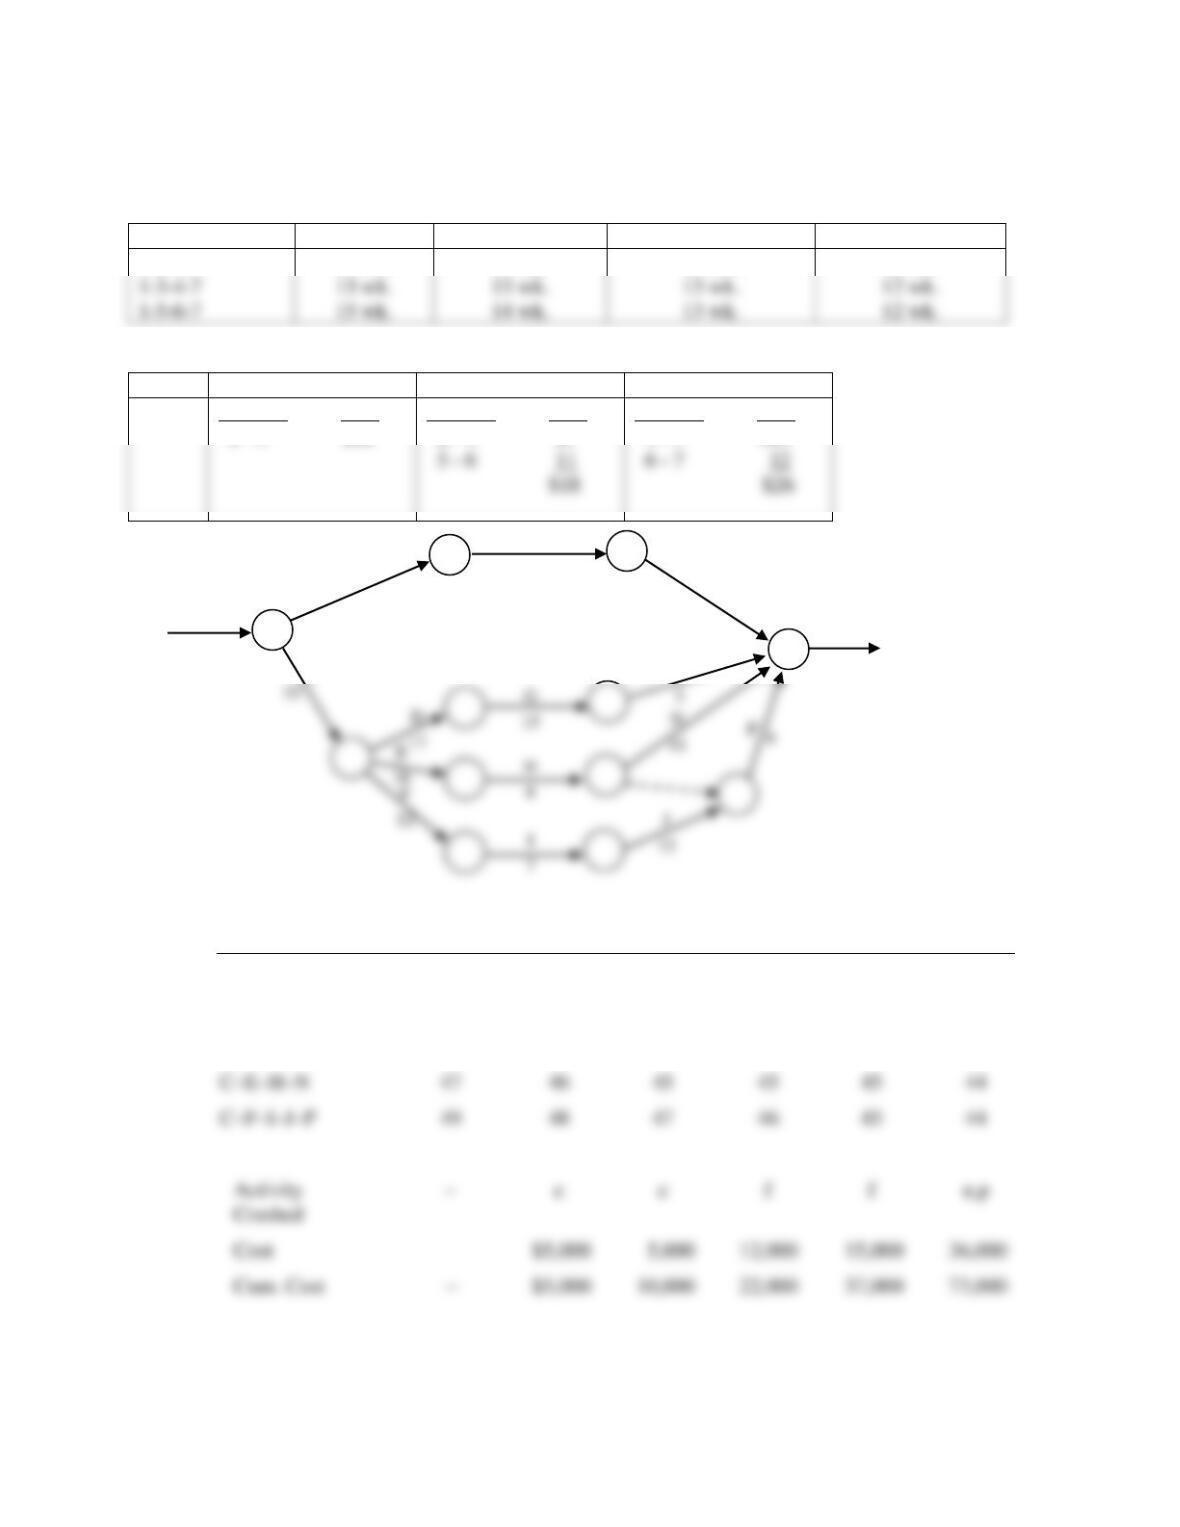
13.
Activity
Duration (wk.)
first crash
second crash
1-2
5
$8 #2
$10
2-4
6
9
4-7
3
14 #3
15
1-3
3
9
11
3-4
7
8
9
1-5
5
10 #1
15
5-6
5
11 #2
13
6-7
5
12 #3
14
3
1
5
6
7
2
4
7
5
6
3
14.83
1.014
11.00
1.0000
c–m–n–o
26.17
1.658
.4602
Chapter 17 – Project Management
17–21
Path
Initial time
After first crash
After second crash
After third crash
1-2-4-7
14 wk.
14 wk.
13 wk.
12 wk.
First Crash
Second Crash
Third Crash
Activity Cost
1 – 5 $10
Activity Cost
2 – 4 $7
Activity Cost
4 – 7 $14
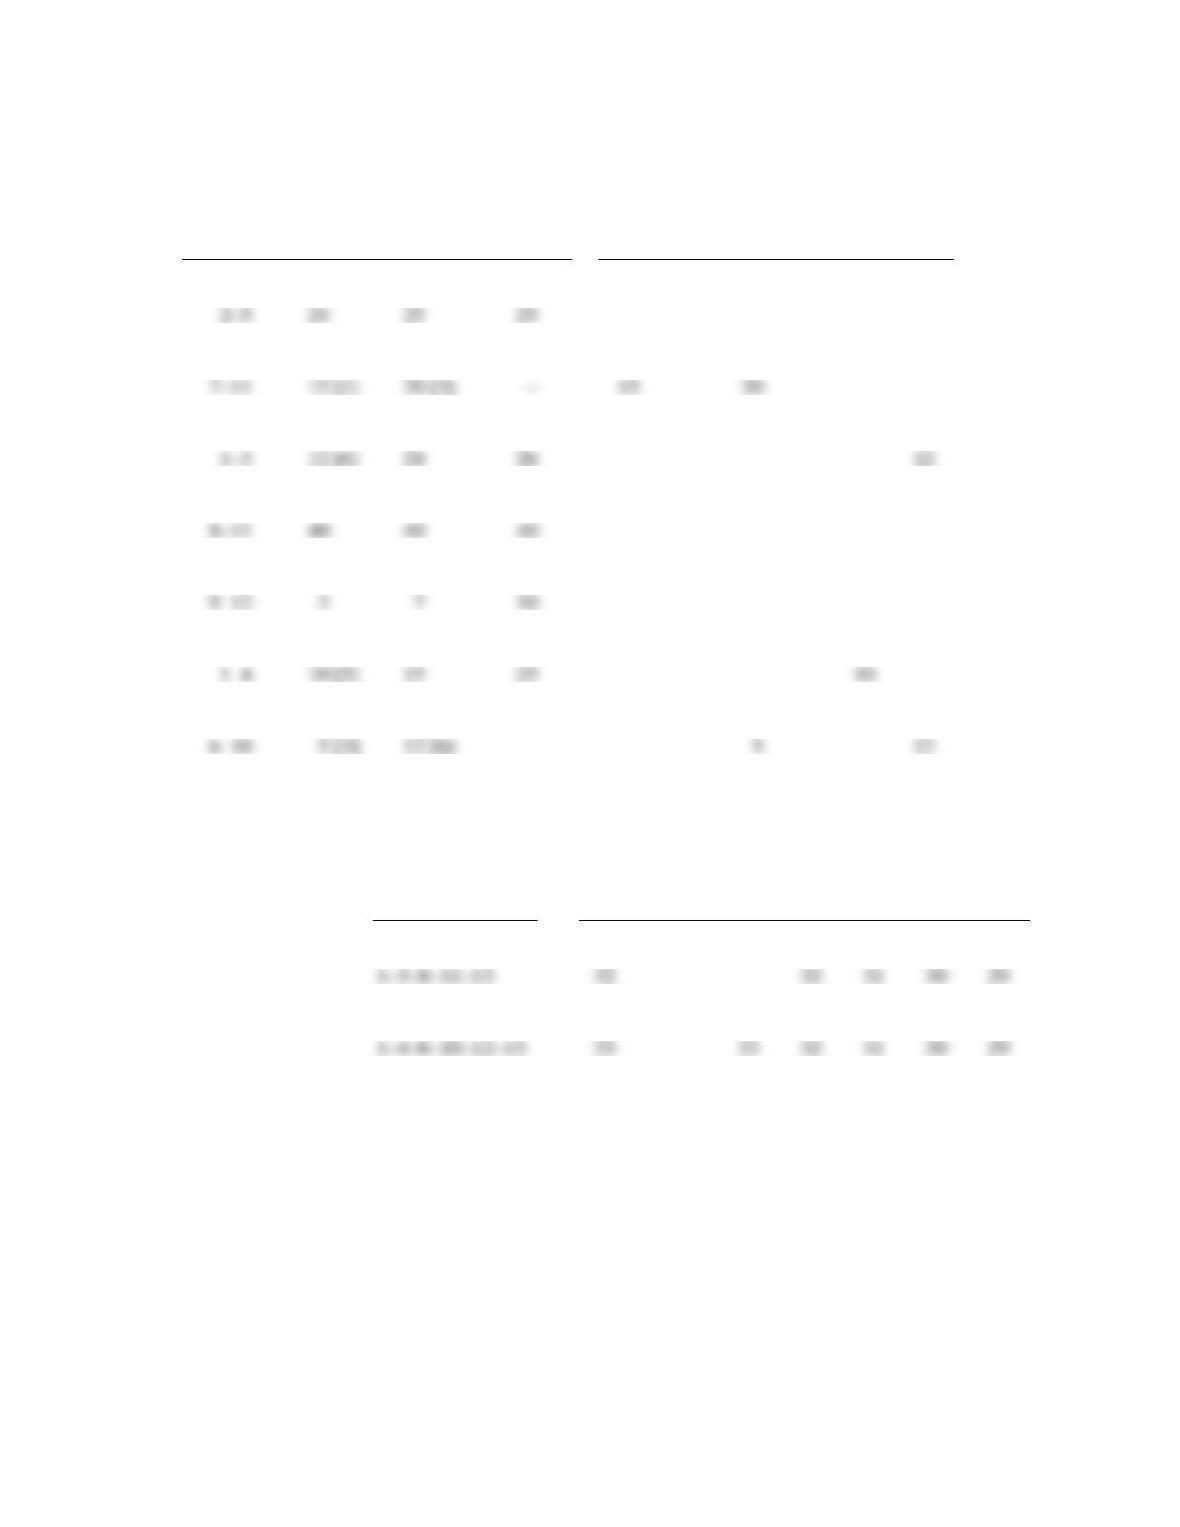
14.
G
15
3
N
11
12
Length after crashing N weeks
Path
N:
0
1
2
3
4
5
A–B–K
35
C–E–H–P
44
43
42
42
42
40
C–D–G–M
45
44
43
43
C–E–H–N
47
46
45
45
45
44
C–F–I–J–P
49
48
47
46
45
44
B
14
A
12
K
9
M
C
Start
End
1-5-6-7
Chapter 17 – Project Management
17–22
15.
Weeks Crashed
Activity
1st week
2nd week
3rd week
1
2
3
4
5
6
1–2
$18 [2]
$22 [6]
–
$18
$22
5–7
30
30
35
15 [1]
20 [3]
–
11–13
30 [4]
33 [5]
36
30
33
3–8
–
–
–
40
40
40
3–9
3
10
12
10
12–13
26
–
–
1–4
10 [5]
15
25
10
4–6
8 [4]
13
–
8
12 [6]
–
10–12
14
15
–
$15
$18
$25
$38
$43
$46
Weeks Crashed
Path
0
1
2
3
4
5
6
1–2–5–7–11–13
35 wk.
34
33
32
31
30
29
1–3–9–12–13
20
1–4–6–10–12–13
33
33
32
31
30
29
2–5
24
25
25
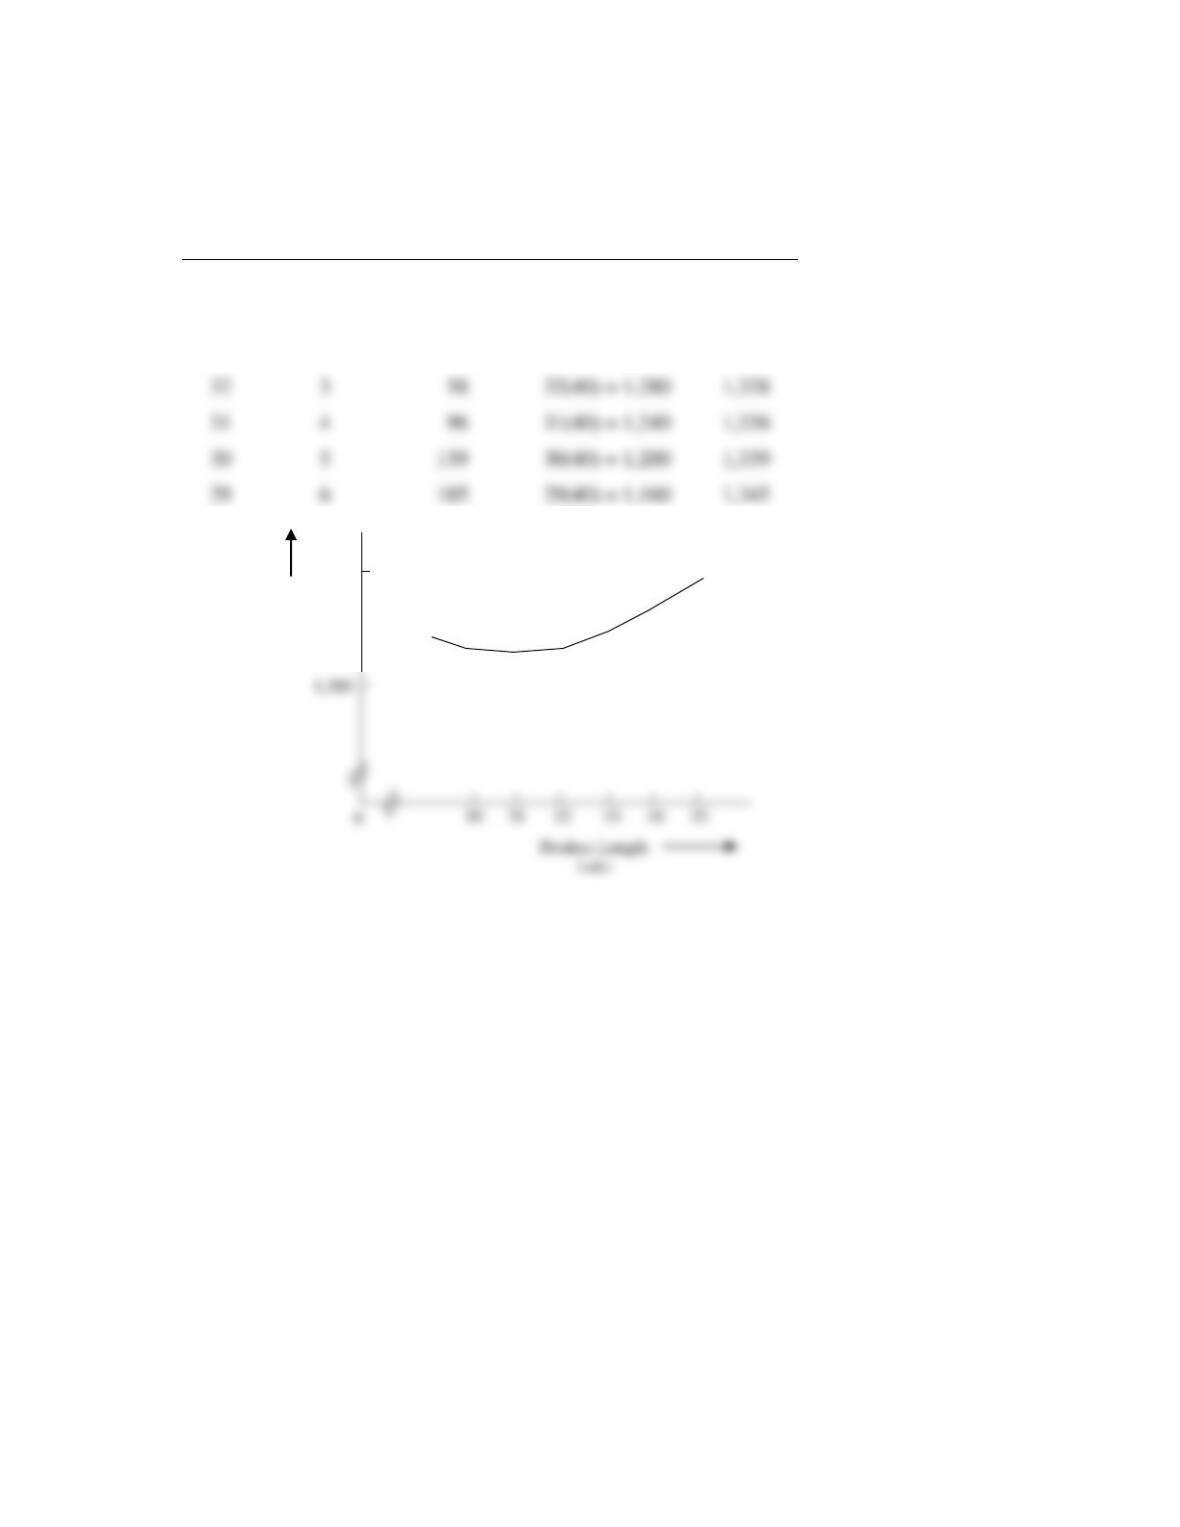
Chapter 17 – Project Management
17–23
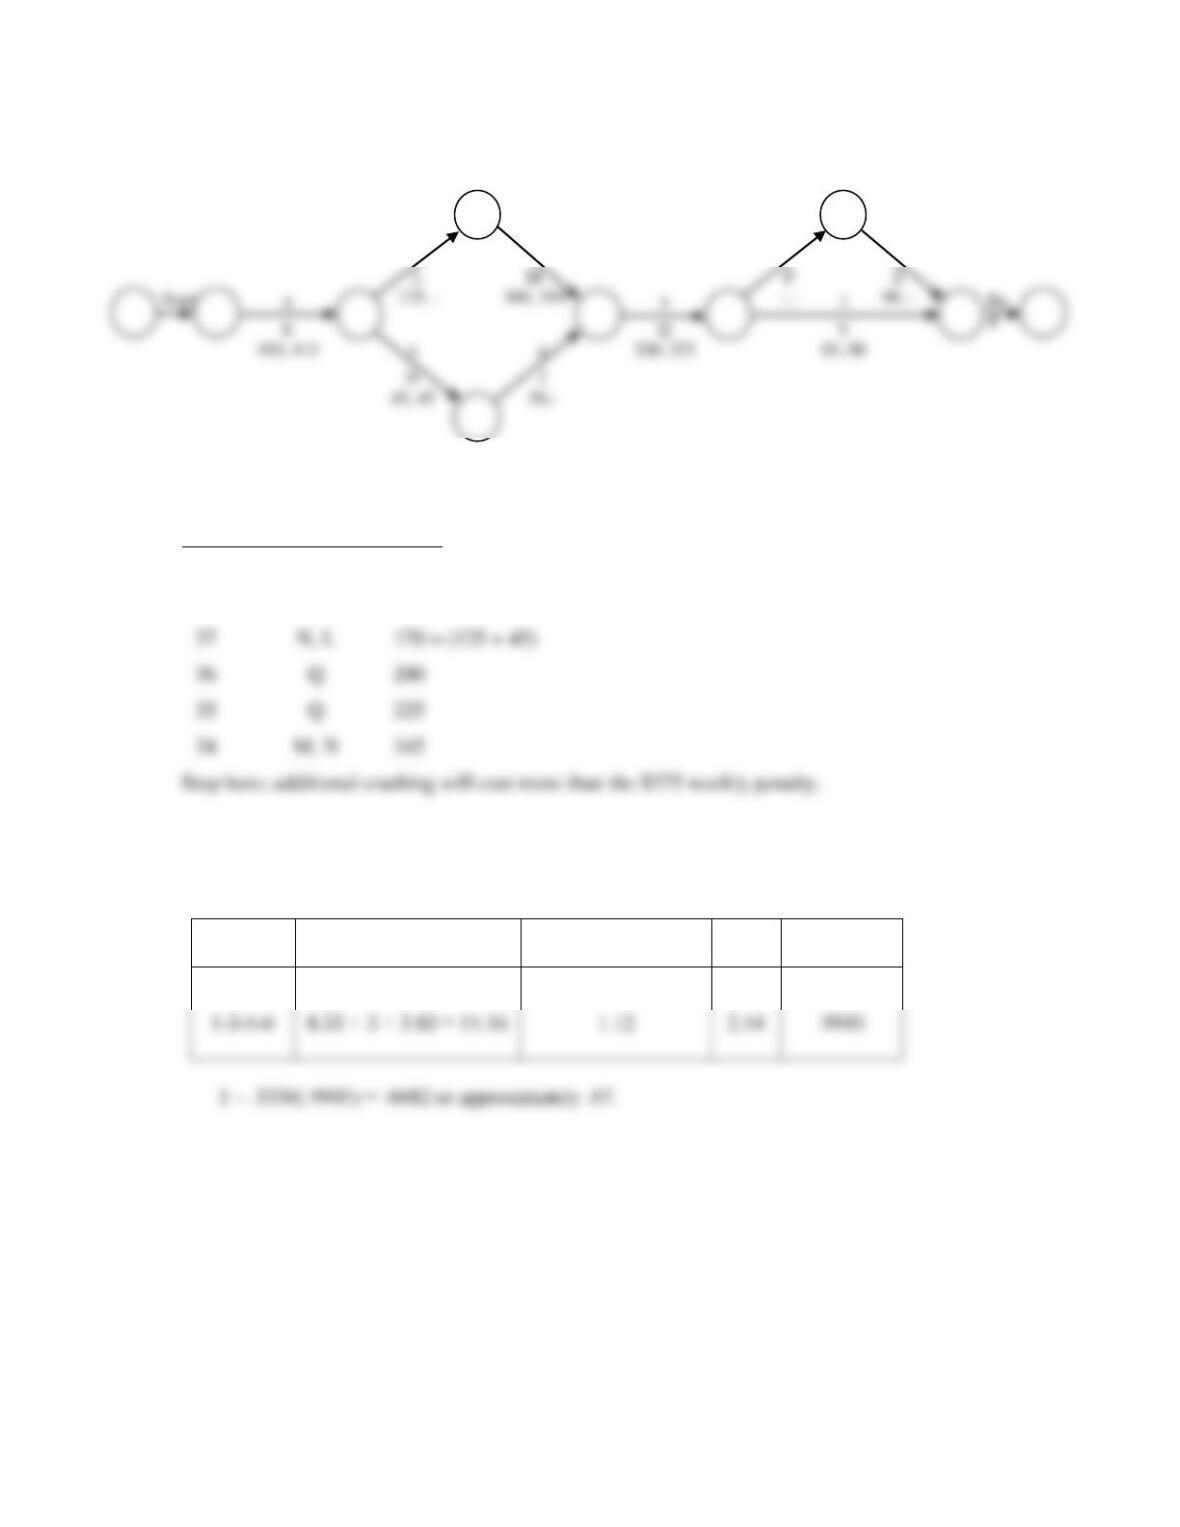
Summary:
Project
Length
Cum. wk.
Shortened
Cum. Crash
Costs ($0000)
Indirect Costs
($000)
Total Cost
($000)
35
0
0
35(40) = 1,400
1,400
34
1
15
34(40) = 1,360
1,375
33
2
33
33(40) = 1,320
1,353
1,300
Total
Cost
($000)
1,400
32
3
58
32(40) = 1,280
1,338
31
4
96
31(40) = 1,240
1,336
29
6
29(40) = 1,160
1,345
Chapter 17 – Project Management
17–24
16.
Project duration = 39 wk
Project
length
Shorten
activity
Crash
cost
39 wk
–
0
38
Z
90
37
36
35
34
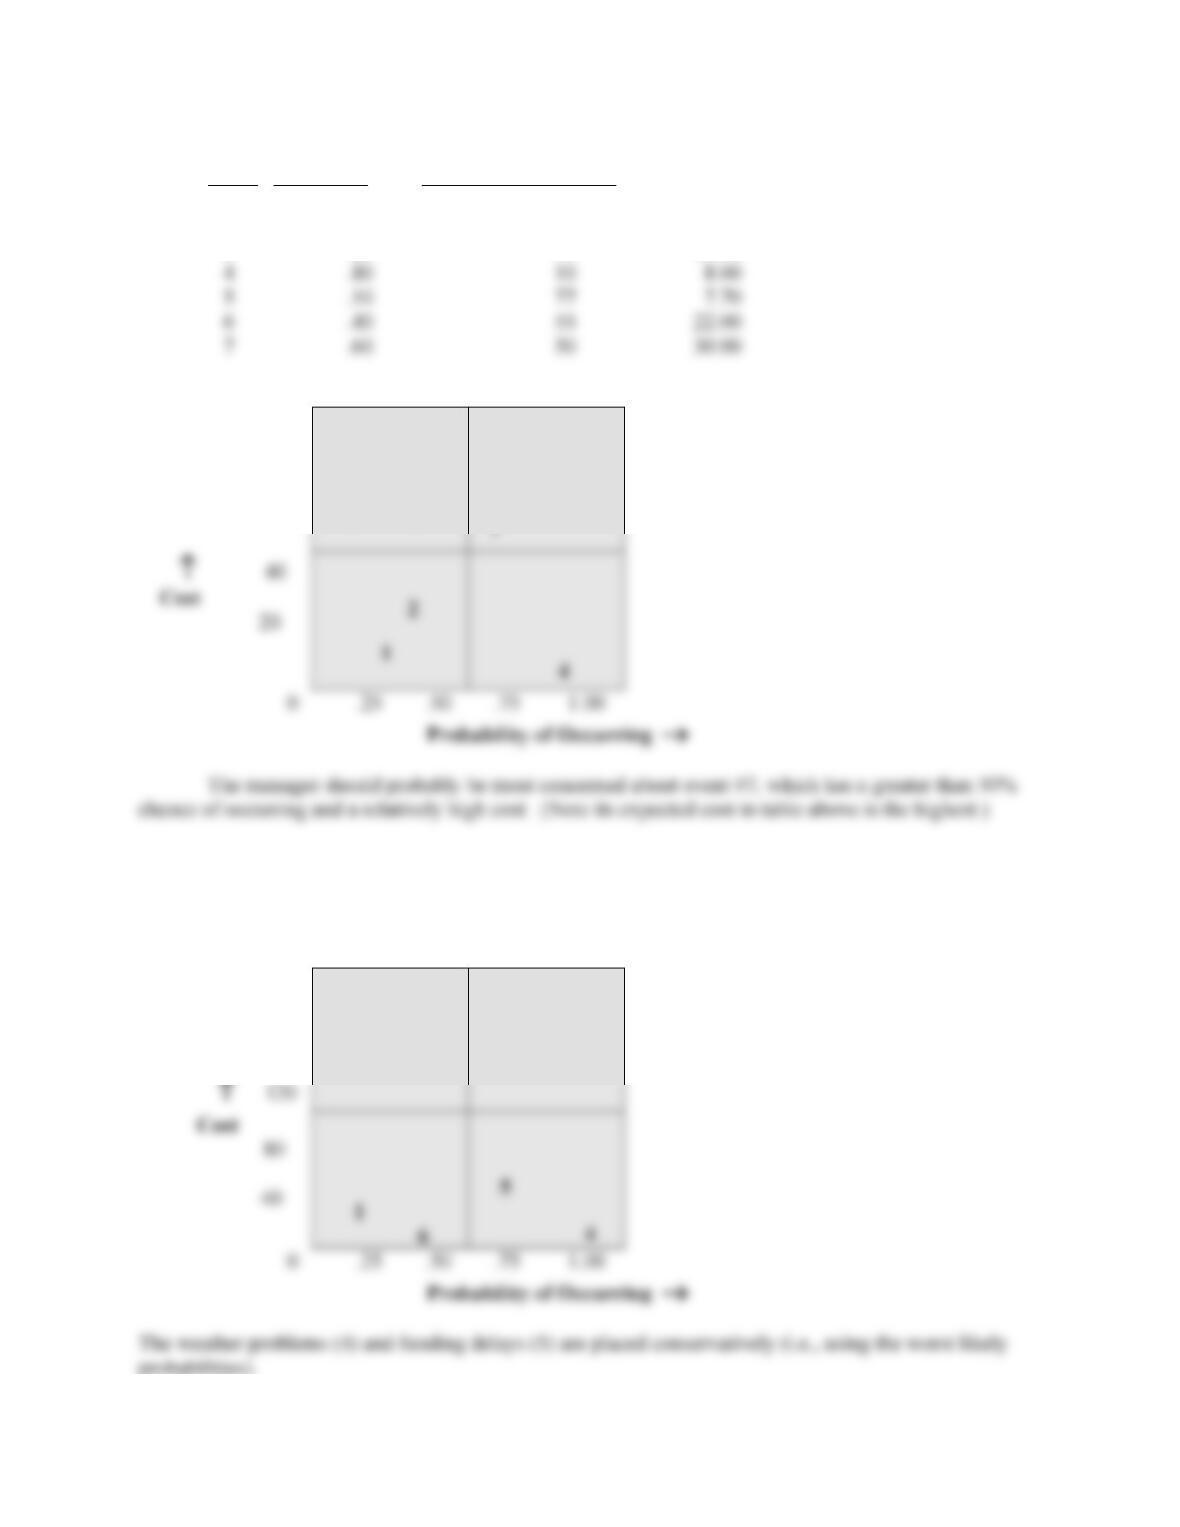
17. a. 18.5 (See table in part b.)
b.
Path
Expected Duration
Standard Deviation
Z17
Probability
1-2-4-6
5+8.17 +5.33 = 18.5
1.17
–.43
.3336
7
4
8
6
5
6
Chapter 17 – Project Management
17–25
18.
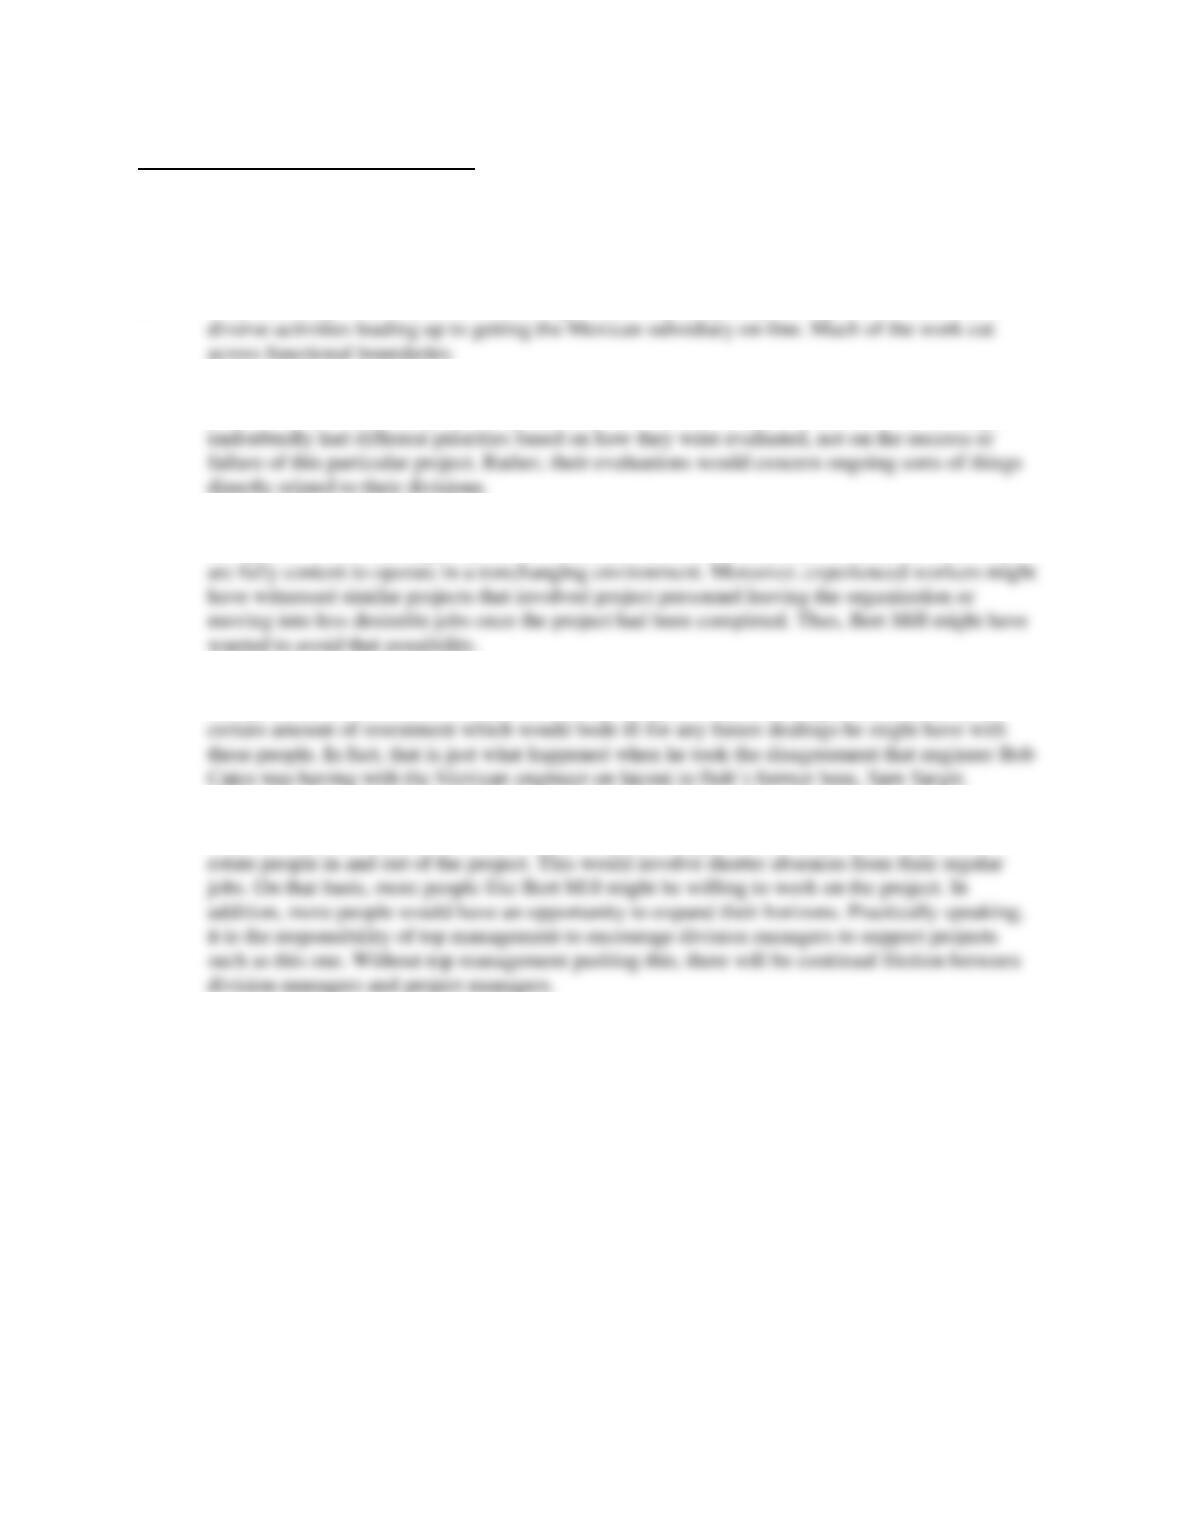
Event Probability Cost ($000) Exp. Cost
1 .25 15 3.75
2 .35 25 8.75
3 .20 55 11.00
80
60
5
3 6
19.
200
160
3
2
Chapter 17 – Project Management
17–26
Case: The Mexican Crazy Quilt
The case combines behavioral considerations in project management with development of a foreign
subsidiary. Although some students will have minor problems getting all the names straight, I think you
will find that the case produces good discussion as well as a realistic view of the sorts of difficulties often
encountered on projects.
1. Very definitely. This was a one-time, unique effort requiring the planning and coordination of
2. Naturally, the division managers would be opposed to releasing their best people to work on the
project. In fact, while the project might be important to top management, the division managers
3. Many people are quite content to work in a stable environment, where there is little chance of
unexpected events that might upset the established routine. These people are risk-adverse; they
4. Conway realized that he might “go to the well” once too often: not every argument would be
decided in his favor. Moreover, he undoubtedly recognized that these arguments stirred up a
5. To begin with, firms must recognize the potential problems, and then set up a mechanism to deal
with them before they are full-blossomed. One possible approach to the problem might be to
Chapter 17 – Project Management
17–27
Case: Time, Please
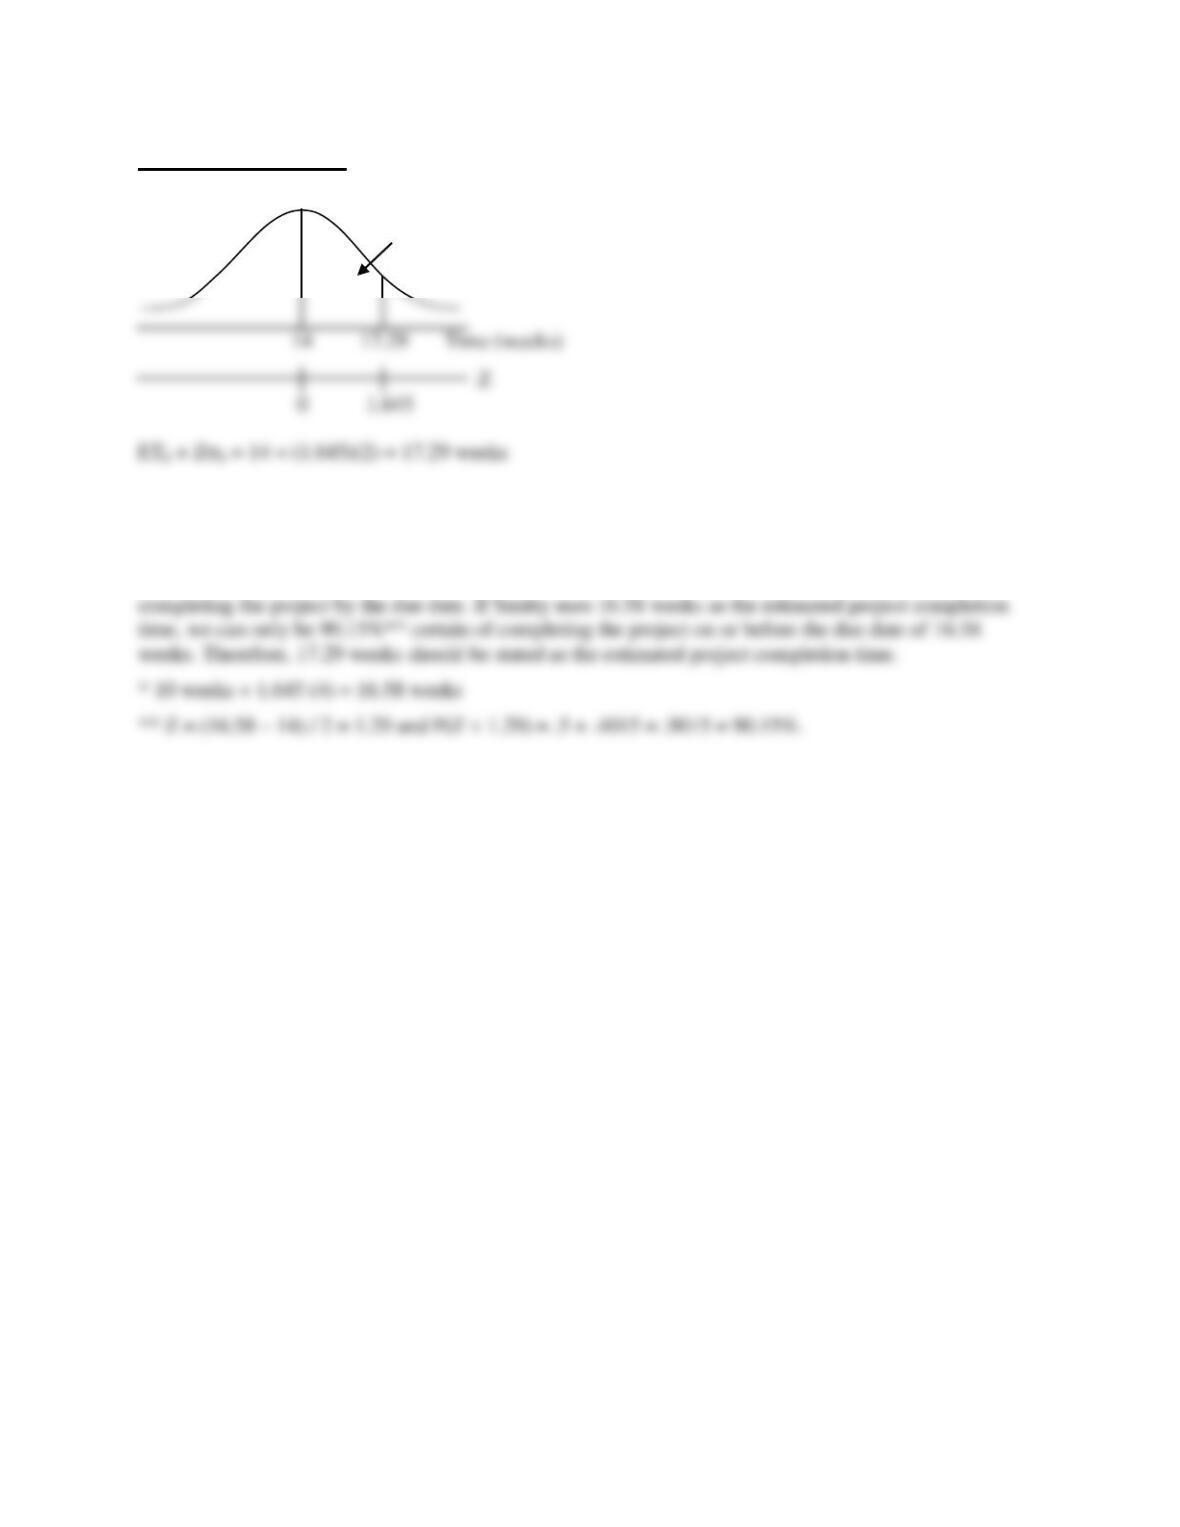
Critical path is the longest path, therefore expected completion time of the project is 14 weeks.
Justification:
Path A has a higher standard deviation then path B. If we base the project completion time on path A,
then the estimated completion time (due date) of 16.58* weeks will not result in a 95% chance of
.45
0 1.645
14 17.29 Time (weeks)
Z