
Chapter 16 – Scheduling
16–21
13.
Determine job times from the schedule table, and then use Johnson’s Rule to sequence the
jobs. The job times are:
Job
A
B
C
D
E
F
G
Cutting
2
4
5
4
2
3
1
Polishing
3
3
2
5
3
1
4
Using Johnson’s Rule, we obtain:
Cutting
Polishing
Job
Start
Finish
Start
Finish
G
0
1
1
5
14.
a.,b.
SPT
Grinding
Deburring
Job
Start
Finish
Start
Finish
C
0
1
1
6
B
1
3
6
10
A
3
6
10
16
D
6
10
16
19
F
93
B
9
13
16
19
C
13
18
19
21
F
18
20
21
22
Chapter 16 – Scheduling
16–22
c. Johnson’s Rule
Grinding
Deburring
Job
Start
Finish
Start
Finish
C
0
1
1
6
B
1
3
6
10
The Grinding flow time is 107 hours and Deburring flow time is 140 hours. The Total time is 35
hours.
d. The tradeoff is between shorter flow time in the Grinding and Deburring departments and shorter
15.
a.
FCFS:
SPT:
Job
Flow
Due
Days
Job
Flow
Due
Days
Job
time
time
date
tardy
Job
time
time
date
tardy
a
4.5
4.5
10
0
d
1.6
1.6
27
0
b
6.0
10.5
17
0
e
2.8
4.4
18
0
c
5.2
15.7
12
3.7
f
3.3
7.7
19
0
d
1.6
17.3
27
0
a
4.5
12.2
10
2.2
e
2.8
20.1
18
2.1
c
5.2
17.4
12
5.4
f
3.3
23.4
19
4.4
b
6.0
23.4
17
6.4
23.4
91.5
10.2
23.4
66.7
14.0
EDD:
CR:
Job
Flow
Due
Days
Job
Flow
Due
Days
Job
time
time
date
tardy
Job
time
time
date
tardy
a
4.5
4.5
10
0
a
4.5
4.5
10
0
c
5.2
9.7
12
0
c
5.2
9.7
12
0
b
6.0
15.7
17
0
b
6.0
15.7
17
0
e
2.8
18.5
18
.5
e
2.8
18.5
18
0.5
f
3.3
21.8
19
2.8
f
3.3
21.8
19
2.8
d
1.6
23.4
27
0
d
1.6
23.4
27
0
23.4
93.6
3.3
23.4
93.6
3.3
A
3
6
10
16
6
14
16
23
E
Chapter 16 – Scheduling
16–23
Critical Ratio
Job
Processing Time
(Days)
Due Date
Critical Ratio Calculation
B
6.0
17
(17 – 0) / 6.0 = 2.83
C
5.2
12
(12 – 0) / 5.2 = 2.31
D
1.6
27
(27 – 0) / 1.6 = 16.88
E
2.8
18
F
3.3
19
(19 – 0) / 3.3 = 5.76
Job A has the lowest critical ratio, therefore it is scheduled first and completed after 4.5 days. The
revised critical ratios are:
Job
Processing
Time (Hrs.)
Due Date
Critical Ratio Calculation
A
–
–
–
B
6.0
17
(17 – 4.5) / 6.0 = 2.08
C
5.2
12
(12 – 4.5) / 5.2 = 1.44
D
1.6
27
(27 – 4.5) / 1.6 = 14.06
E
2.8
18
(18 – 4.5) / 2.8 = 4.82
F
3.3
19
(19 – 4.5) / 3.3 = 4.39
Job C has the lowest critical ratio, therefore it is scheduled next and it is completed after 9.7 days
(4.5 + 5.2). After the completion of Job C, the revised critical ratios are:
Job
Processing
Time (Hrs.)
Due Date
Critical Ratio Calculation
A
–
–
–
B
6.0
17
(17 – 9.7) / 6.0 = 1.22
C
–
–
–
D
1.6
27
E
2.8
18
(18 – 9.7) / 2.8 = 2.96
F
3.3
19
(19 – 9.7) / 3.3 = 2.82
A
4.5
10
(10 – 0) / 4.5 = 2.22
Chapter 16 – Scheduling
16–24
Job B has the lowest critical ratio, therefore it is scheduled next and it is completed after 15.7
days (9.7 + 6). After the completion of Job B, the revised critical ratios are:
Job
Processing
Time (Hrs.)
Due Date
Critical Ratio Calculation
A
–
–
–
B
–
–
–
Job E has the lowest critical ratio, therefore it is scheduled next and it is completed after 18.5
days (15.7 + 2.8). After the completion of Job E, the revised critical ratios are:
Job
Processing
Time (Hrs.)
Due Date
Critical Ratio Calculation
A
–
–
–
B
–
–
–
C
–
–
–
D
E
–
–
–
Job F has the lowest critical ratio therefore it is scheduled next and it is completed after 21.8 days
(18.5 + 3.3). The final critical ratio sequence is A–C–B–E–F–D. Total completion of all six jobs
(makespan) is 23.4 days.
Critical
Ratio
sequence
Processing
Time (Days)
Flow time
Due Date
Lateness
Tardiness
A
4.5
4.5
10
–5.5
0
C
5.2
9.7
12
–2.3
0
B
6.0
15.7
17
–1.3
0
E
2.8
18.5
18
0.5
3.3
21.8
19
2.8
D
1.6
23.4
27
–3.6
0
C
–
–
–
D
E
Chapter 16 – Scheduling
16–25
Rule
Average
=
days late
Average flow
=
flow time
Average
=
flow time
tardiness
no. of jobs
time
no. of jobs
no. of jobs
job time
FCFS
10.2/6 =
1.7 days
91.5/6 =
15.25 days
91.5/23.4 =
3.91 jobs
b. There are several ways to show this. One is to calculate the ratio of average flow time to average
number of jobs for each rule and then observe that they are equal. Here the ratios are
approximately 3.90. [Slight differences in ratios may arise due to rounding.]
16.
Job
Remaining
processing
time
Due date
Slack
Remaining
number of
operations
Slack
Remaining
number of
operations
Rank
a
5
8
3
2
1.50
4
b
6
5
–1
4
–0.25
1
c
9
1
4
0.25
2
e
8
2
3
17.
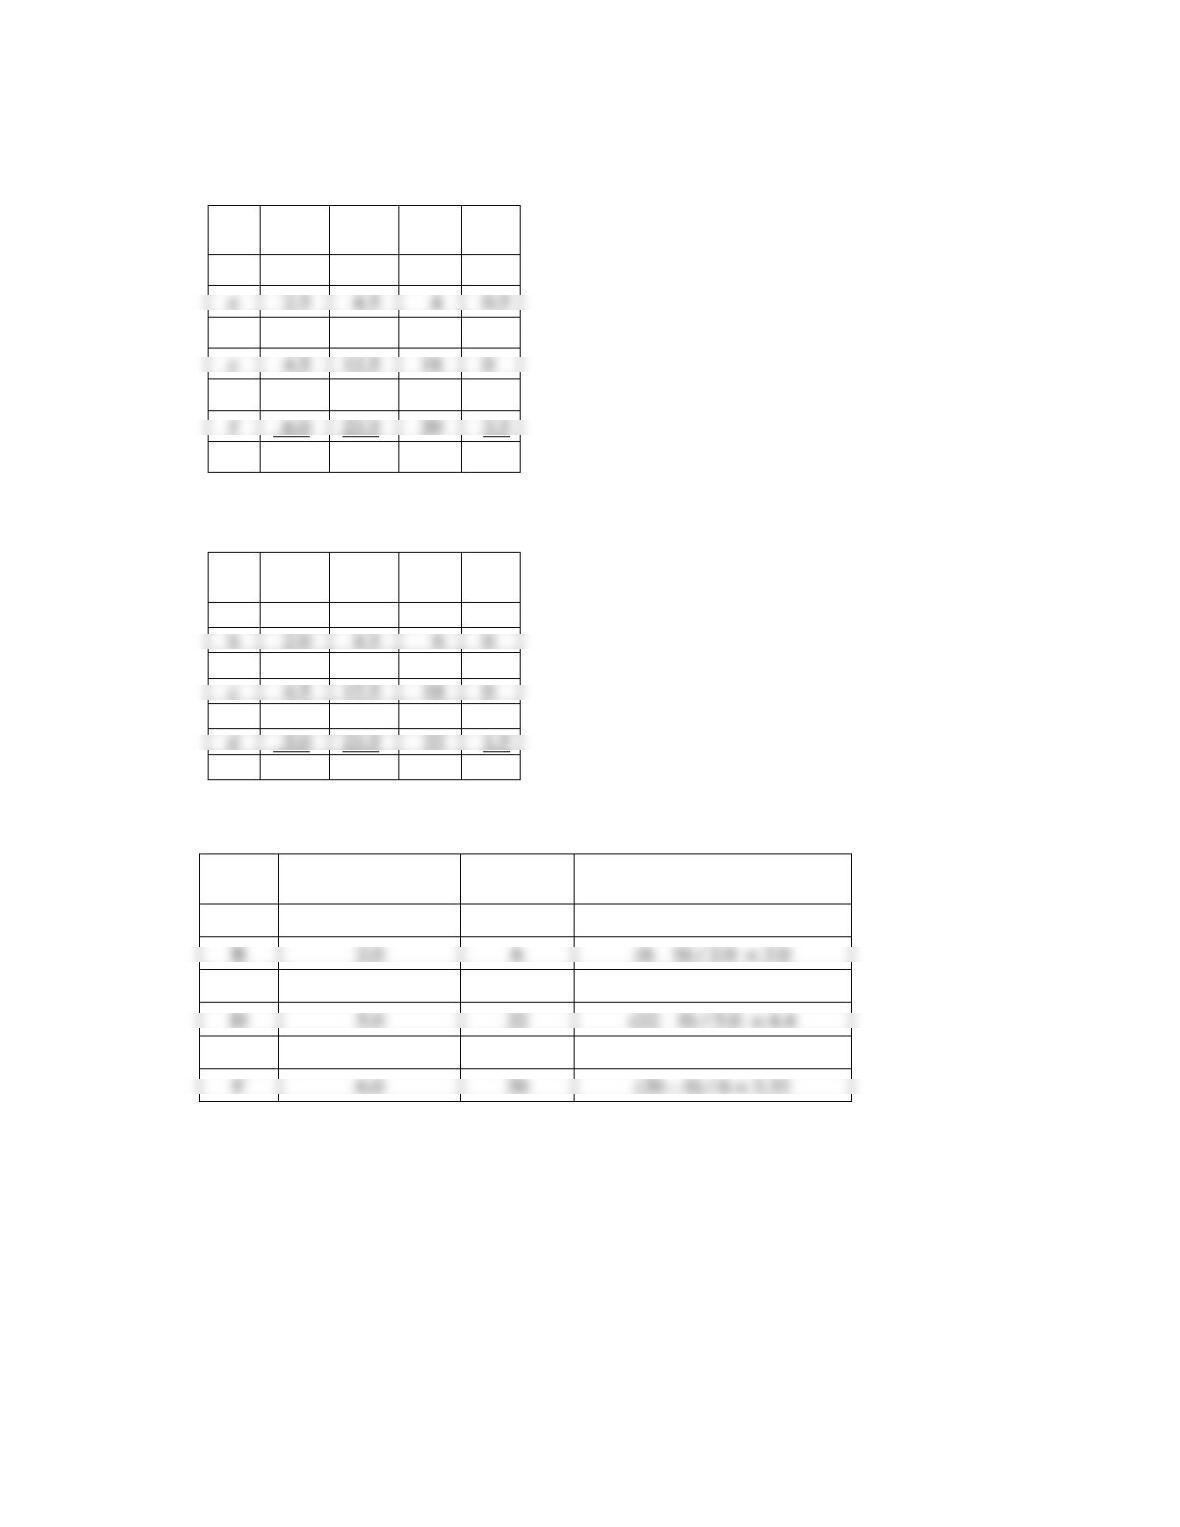
FCFS
Job time
Due date
Flow time
Tardy
Job
(hr.)
(hr.)
(hr.)
(hr.)
a
3.5
7
0
b
2.0
6
5.5
0
c
4.5
18
10.0
0
d
5.0
22
15.0
0
f
6.0
20
23.5
3.5
75.0
EDD
0.55 days.
93.6/6 =
15.60 days
93.6/23.4 =
4.00
.55 days
93.6/6 =
15.60 days
93.6/23.4 =
4.00
Chapter 16 – Scheduling
16–26
SPT
Job
Job
time
Flow
time
Due
date
Tardy
b
2.0
2.0
6
0
a
3.5
8.0
7
1
c
4.5
18
0
d
5.0
17.5
22
0
f
20
3.5
23.5
68.0
5.0
EDD
Job
Job
time
Flow
time
Due
date
Tardy
e
2.5
2.5
4
0
b
2.0
4.5
6
0
a
3.5
8.0
7
1
c
4.5
12.5
18
0
f
6.0
18.5
20
0
d
5.0
23.5
22
1.5
23.5
69.5
2.5
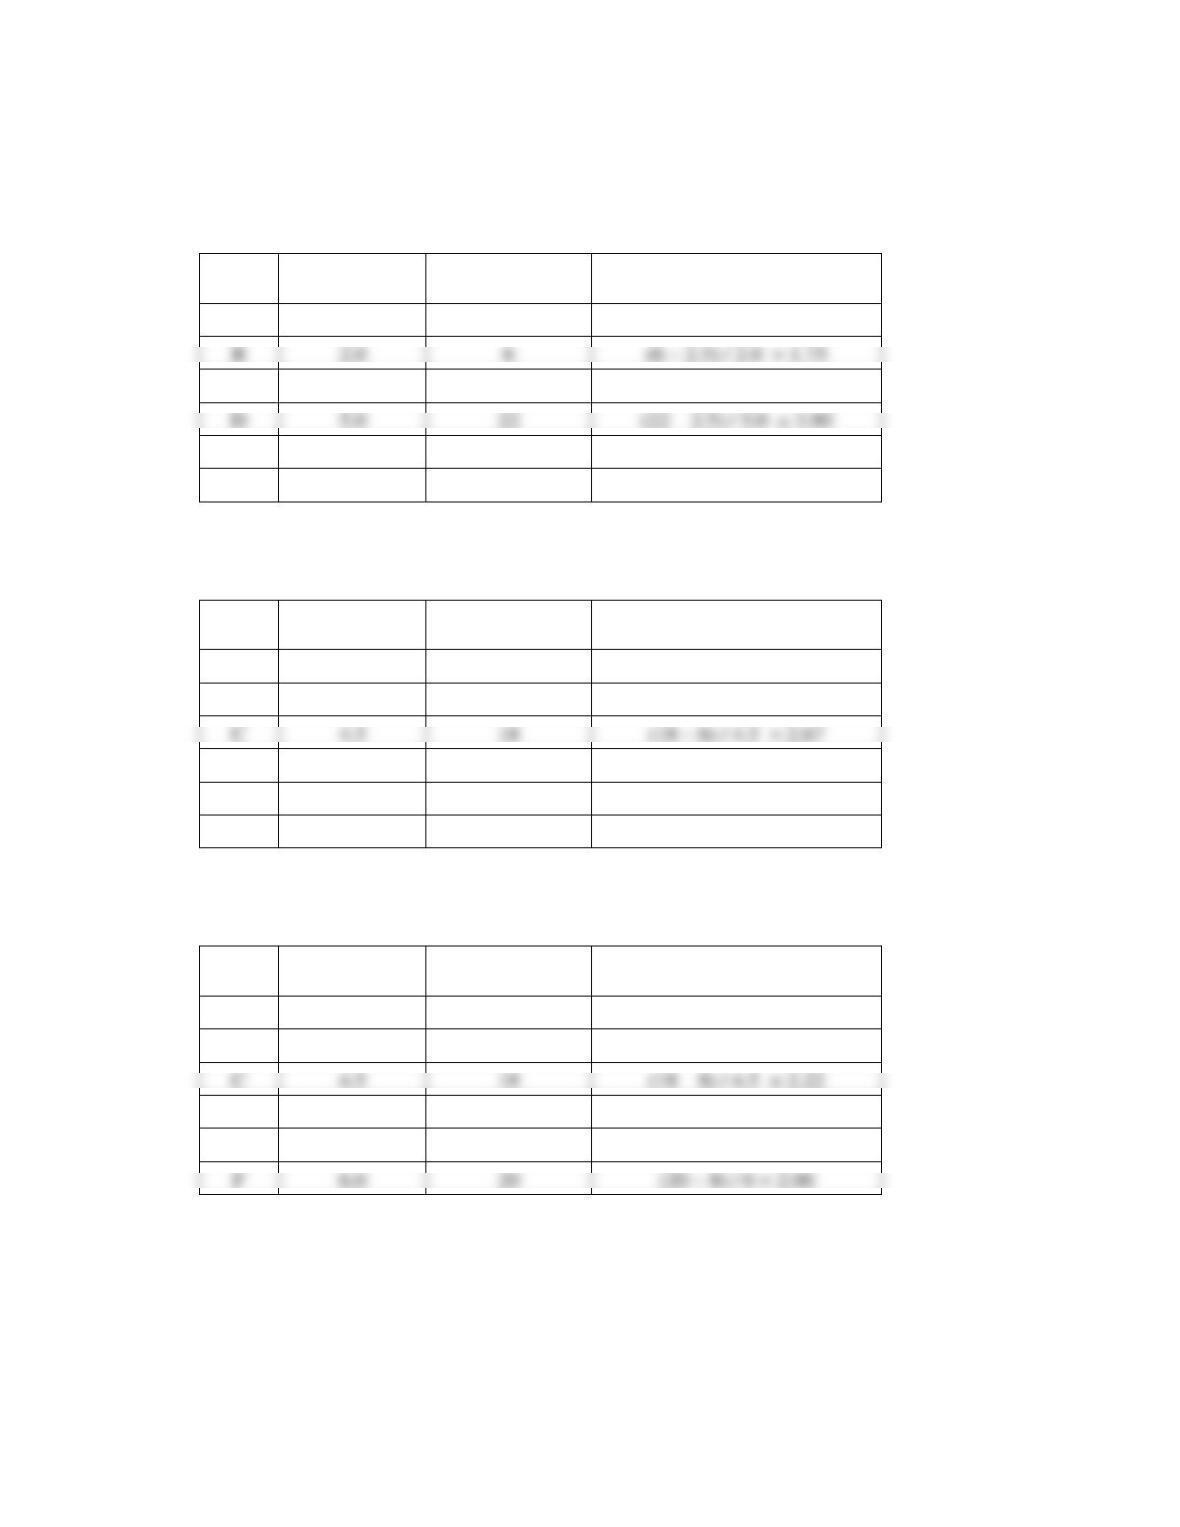
Critical Ratio
Job
Processing Time
(Days)
Due Date
Critical Ratio Calculation
A
3.5
7
(7 – 0) / 3.5 = 2.0
B
2.0
6
(6 – 0) / 2.0 = 3.0
C
4.5
18
(18 – 0) / 4.5 = 4.0
5.0
E
2.5
4
(4 – 0) / 2.5 = 1.6
6.0
e
2.5
4.5
4
0.5
Chapter 16 – Scheduling
16–27
Job E has the lowest critical ratio, therefore it is scheduled first and completed after 2.5 hours.
The revised critical ratios are:
Job
Processing
Time (Hrs.)
Due Date
Critical Ratio Calculation
A
3.5
7
(7 – 2.5) / 3.5 = 1.29
C
4.5
18
(18 – 2.5) / 4.5 = 3.44
D
5.0
22
(22 – 2.5) / 5.0 = 3.90
E
–
–
–
F
6.0
20
(20 – 2.5) / 6 = 2.92
Job A is scheduled next because Job A has the lowest critical ratio. Job A will be completed after
6 hours (2.5 + 3.5). After the completion of Job A, the revised critical ratios are:
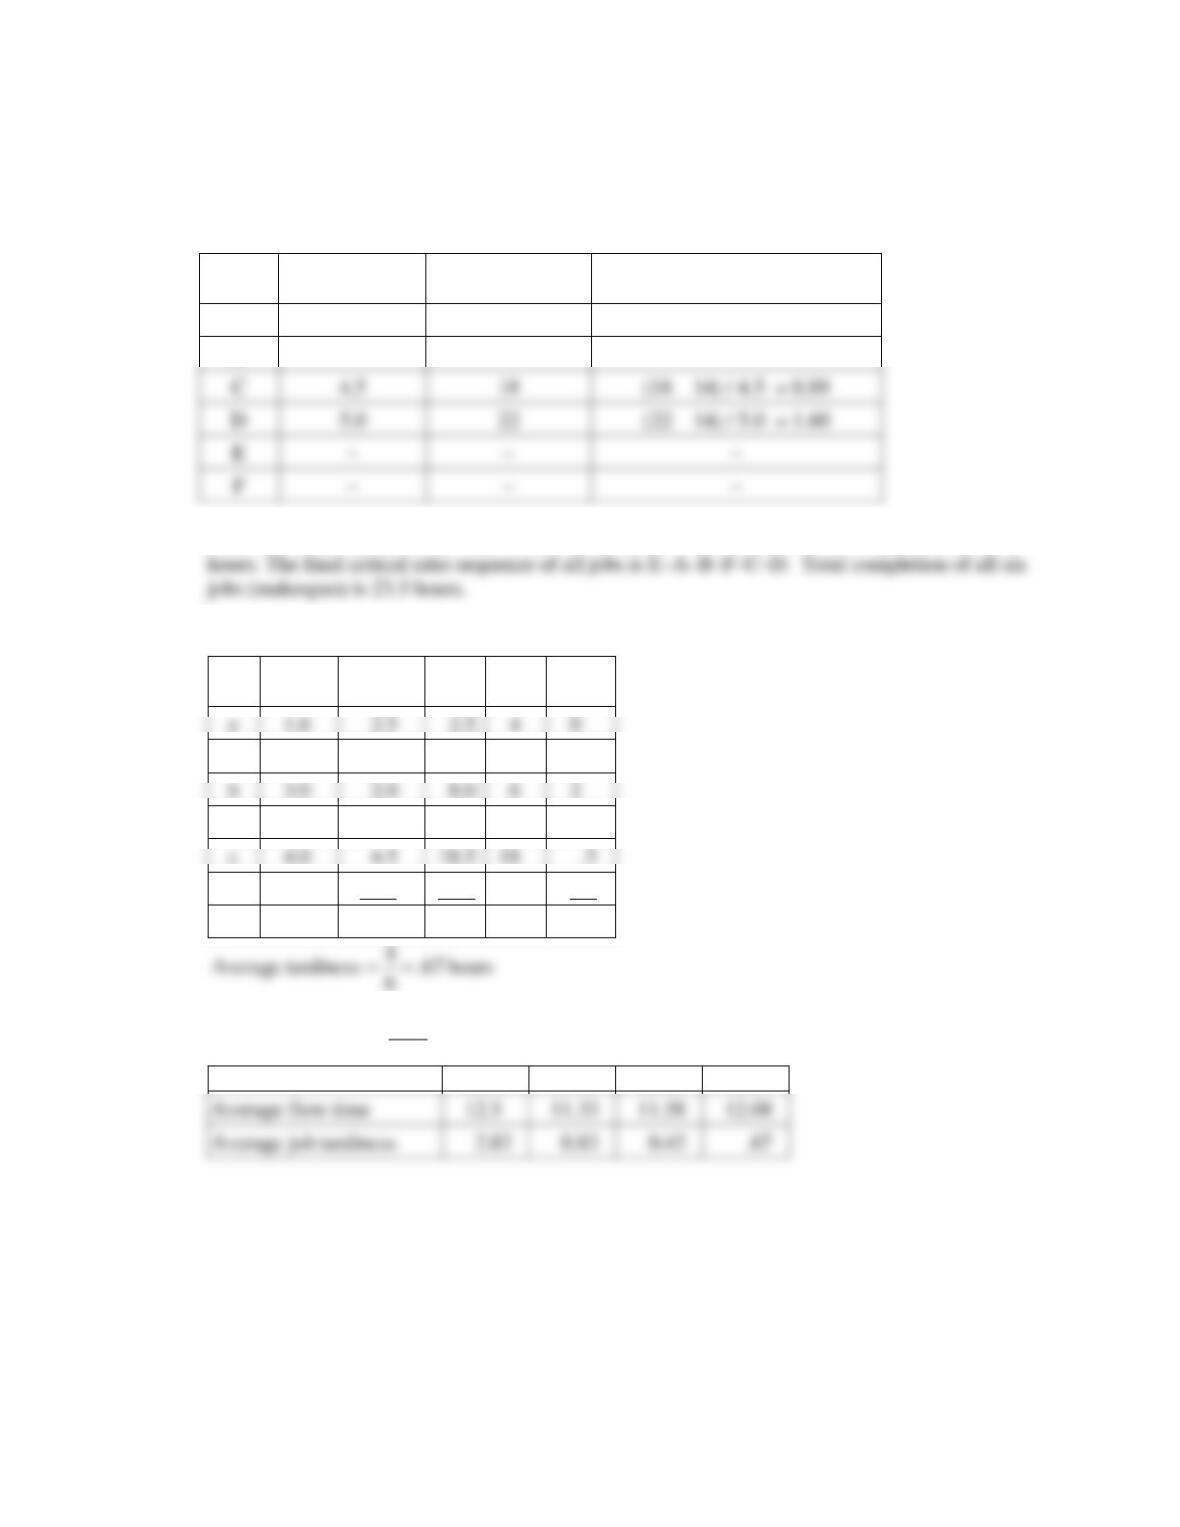
Job
Processing
Time (Hrs.)
Due Date
Critical Ratio Calculation
A
–
–
–
B
2.0
6
(6 – 6) / 2.0 = 0
C
4.5
18
(18 – 6) / 4.5 = 2.67
D
5.0
22
(22 – 6) / 5.0 = 3.20
E
–
–
–
F
6.0
20
(20 – 6) / 6 = 2.33
Since Job B has the lowest critical ratio, it is scheduled next and it is completed after 8 hours (6
+ 2). After the completion of Job B, the revised critical ratios are:
Job
Processing
Time (Hrs.)
Due Date
Critical Ratio Calculation
A
–
–
–
B
–
–
–
C
4.5
18
(18 – 8) / 4.5 = 2.22
D
5.0
22
(22 – 8) / 5.0 = 2.80
E
–
–
–
F
6.0
20
B
2.0
Chapter 16 – Scheduling
16–28
Since Job F has the lowest critical ratio, it is scheduled next and it will be completed after 14
hours (8 + 6). After the completion of Job F, the revised critical ratios are:
Job
Processing
Time (Hrs.)
Due Date
Critical Ratio Calculation
A
–
–
–
B
–
–
–
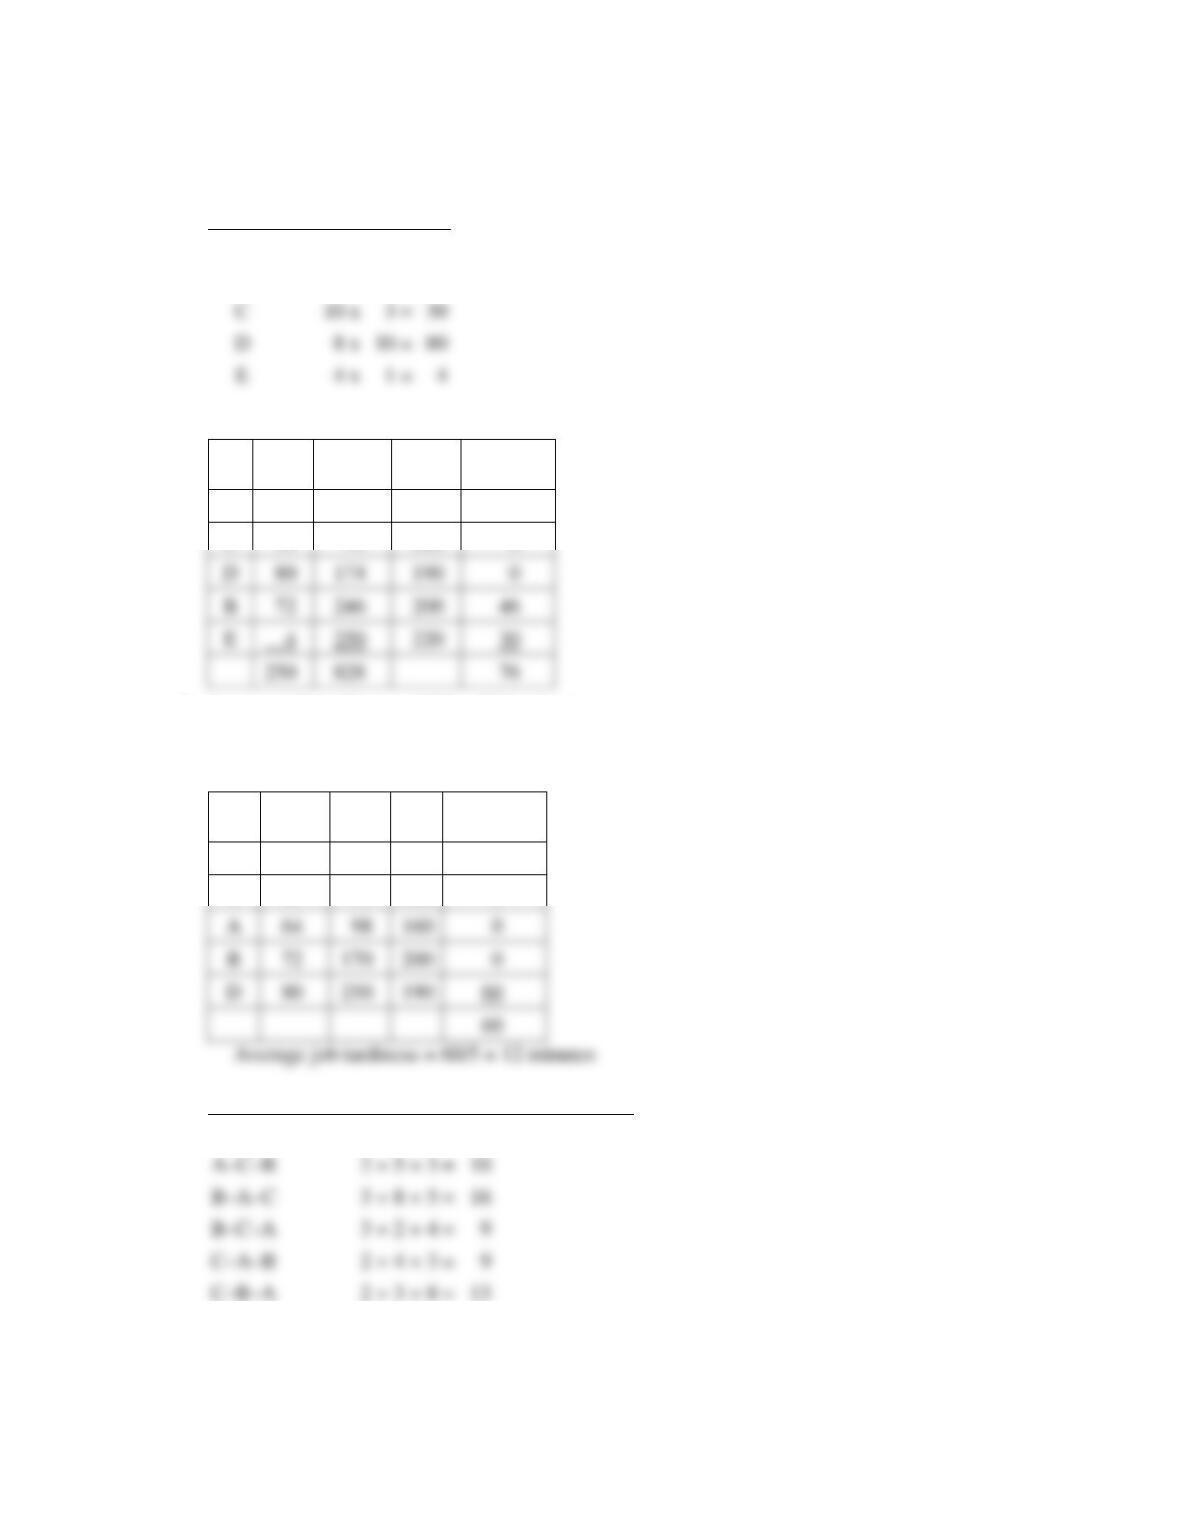
Since Job C has the lowest critical ratio, it is scheduled next. Job C will be completed after 18.5
Job
Critical
ratio
Job
time
Flow
time
Due
date
Tardy
e
1.6
2.5
2.5
4
0
a
2.0
3.5
6.0
7
0
b
3.0
2.0
8.0
6
2
f
3.3
6.0
14.0
20
0
c
4.0
4.5
18.5
18
d
4.4
5.0
23.5
22
1.5
23.5
72.5
4.0
hours 08.12
6
5.72
time flow Average
==
FCFS
SPT
EDD
CR
Average job tardiness
2.83
0.83
0.42
C
E
–
–
–
–
–
–
Chapter 16 – Scheduling
16–29
18.
a.
Order
Job time
A
16 x
4 =
64
B
6 x
12 =
72
DD
Job
Job
time
Flow
time
Due
date
Tardiness
A
64
64
160
0
C
30
94
180
0
D
80
174
190
0
B
72
246
200
b. Average job tardiness = 76/5 = 15.2 minutes
c. Average number of jobs in the system = 828/250 = 3.31
d.
SPT
Job
Job
time
Flow
time
Due
date
Tardiness
E
4
4
220
0
C
30
34
180
0
A
64
98
160
0
B
72
170
200
0
D
80
250
190
19.
Sequence
Setup times
Total
A–B–C
2 + 3 + 2 =
7 (best)
A–C–B
2 + 5 + 3 =
B–C–A
3 + 2 + 4 =
9
C–A–B
2 + 4 + 3 =
9
C
10 x
3 =
30
4 x
1 =
4
Chapter 16 – Scheduling
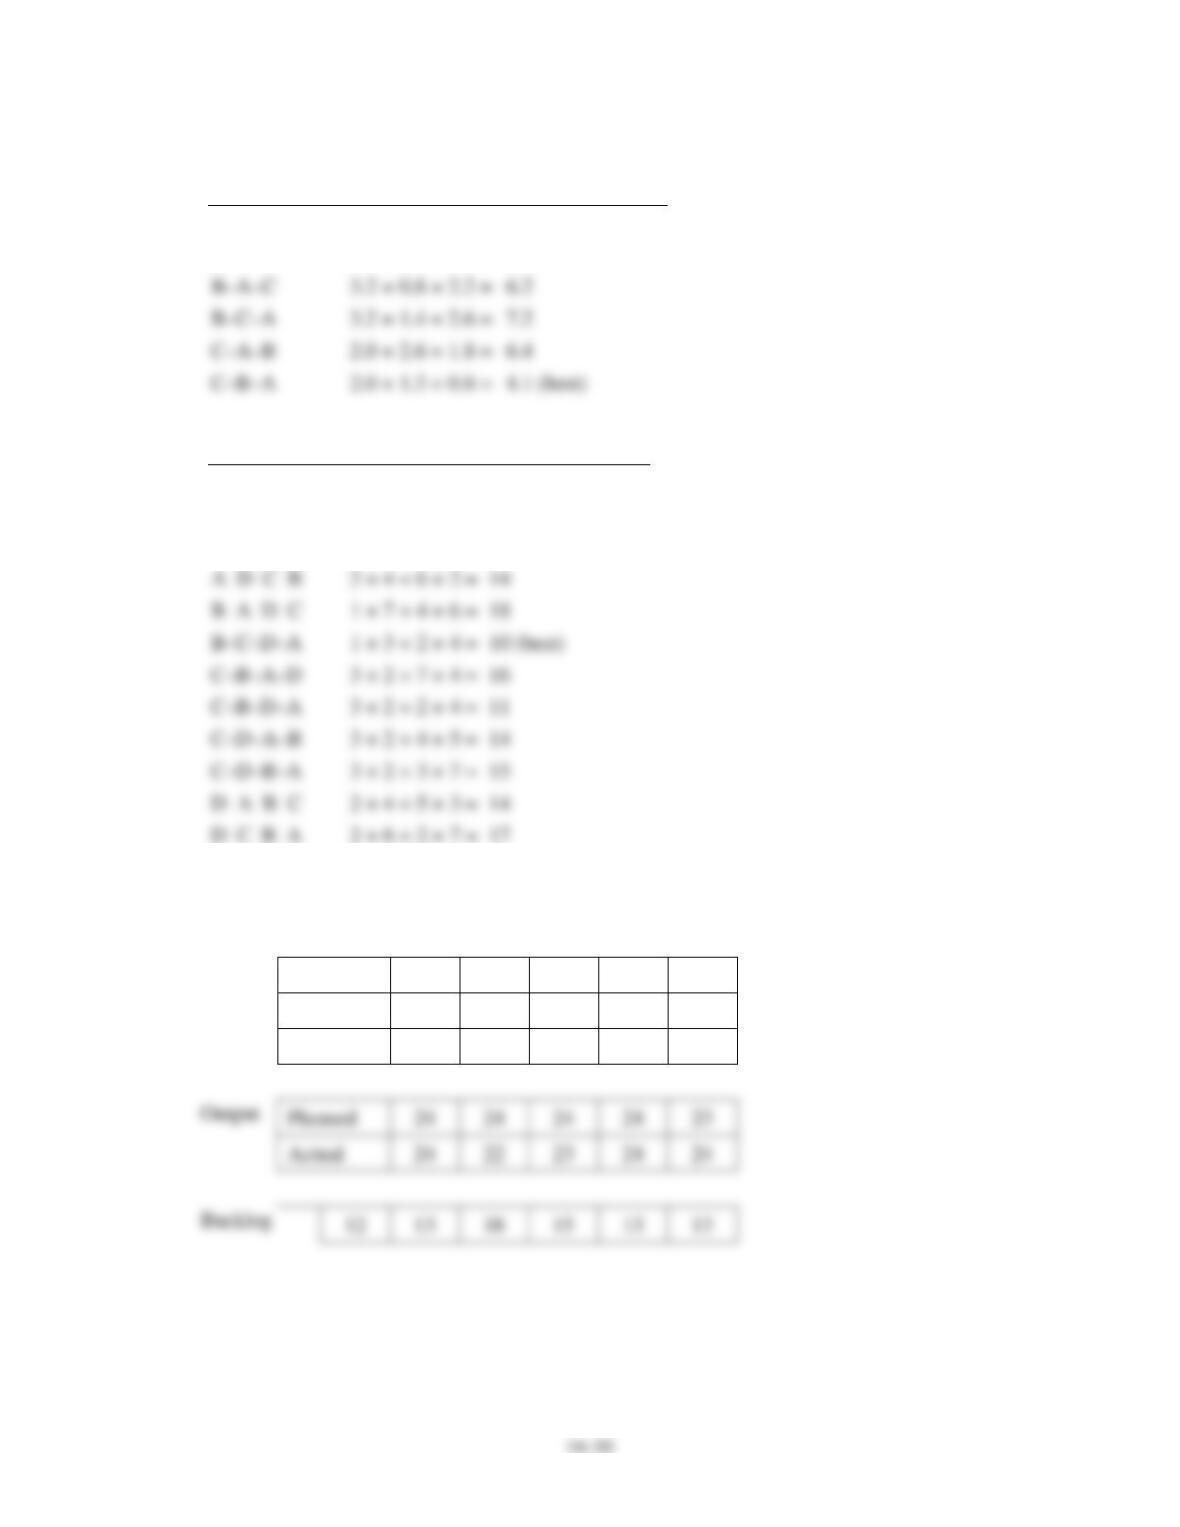
20.
Sequence
Setup times
Total
A–B–C
2.4 + 1.8 + 1.4 =
5.6
A–C–B
2.4 + 2.2 + 1.3 =
5.9
B–A–C
3.2 + 0.8 + 2.2 =
6.2
B–C–A
3.2 + 1.4 + 2.6 =
7.2
C–A–B
2.0 + 2.6 + 1.8 =
6.4
C–B–A
2.0 + 1.3 + 0.8 =
4.1 (best)
21.
Sequence
Setup times
Total
A–B–C–D
2 + 5 + 3 + 2 =
12
A–B–D–C
2 + 5 + 2 + 6 =
15
A–D–B–C
2 + 4 + 3 + 3 =
12
A–D–C–B
2 + 4 + 6 + 2 =
14
B–A–D–C
1 + 7 + 4 + 6 =
18
B–C–D–A
1 + 3 + 2 + 4 =
10 (best)
C–B–A–D
3 + 2 + 7 + 4 =
16
C–B–D–A
3 + 2 + 2 + 4 =
11
C–D–A–B
3 + 2 + 4 + 5 =
14
C–D–B–A
3 + 2 + 3 + 7 =
15
D–A–B–C
2 + 4 + 5 + 3 =
14
D–C–B–A
2 + 6 + 2 + 7 =
17
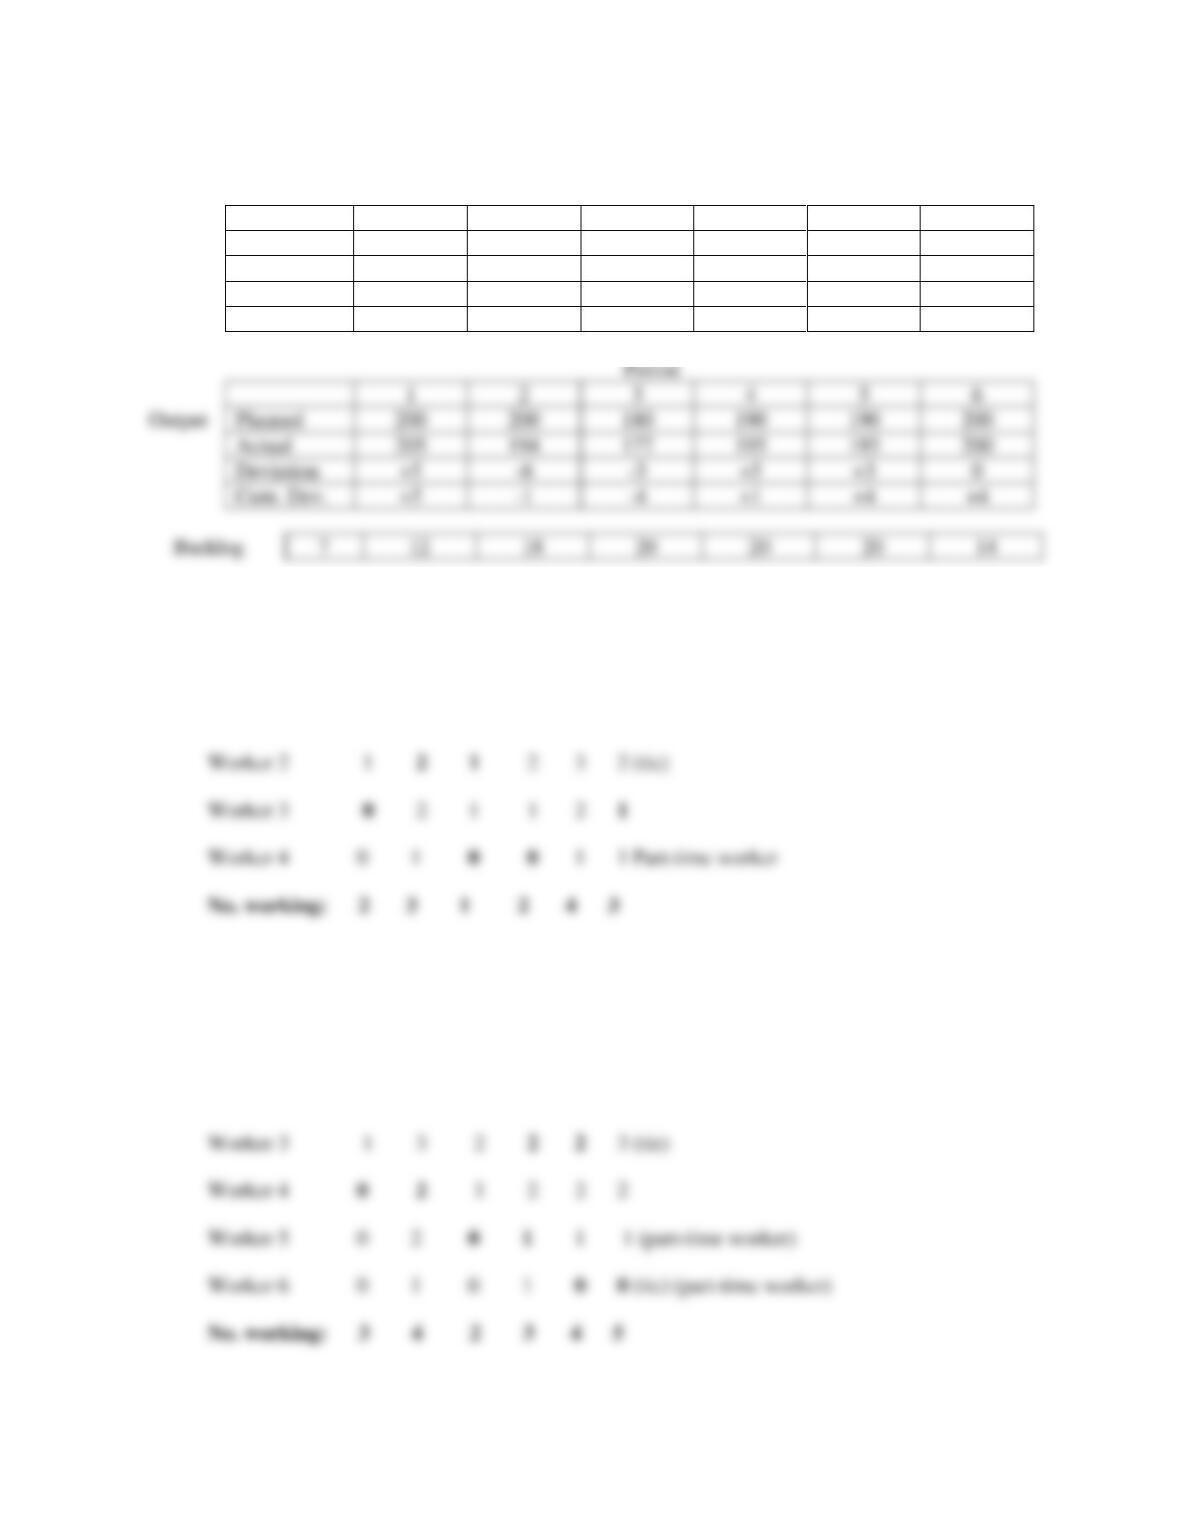
22. Each period’s backlog is equal to actual input – actual output. That amount is added to (or
subtracted from) the previous backlog to obtain the current (shown) backlog for the period.
Period
Input
1
2
3
4
5
Planned
24
24
24
24
20
Actual
25
27
20
22
24
Planned
24
24
24
24
23
Actual
24
22
23
24
24
Backlog
12
13
18
15
13
13
Chapter 16 – Scheduling
16–31
23. Period
1
2
3
4
5
6
Input
Planned
200
200
180
190
190
200
Actual
210
200
179
195
193
194
Deviation
+10
0
-1
+5
+3
-6
Cum. Dev.
+10
+10
+9
+14
+17
+11
24. Day Mon Tue Wed Thu Fri Sat
Staff needed 2 3 1 2 4 3
Worker 1 2 3 1 2 4 3
25. Day Mon Tue Wed Thu Fri Sat
Staff needed 3 4 2 3 4 5
Worker 1 3 4 2 3 4 5
Worker 2 2 3 2 3 3 4 (tie)
1
2
3
4
5
6
Output
Planned
200
200
180
190
190
200
Actual
205
194
177
195
193
200
Deviation
-3
+5
+3
0
Cum. Dev.
+1
+4
+4
Backlog