16 –
1
Chapter 16
Simulation
Case Problem: Four Corners
1. Using Goal Seek, we determine that a 9.13% annual investment rate will result in $1,000,000 in 20 years.
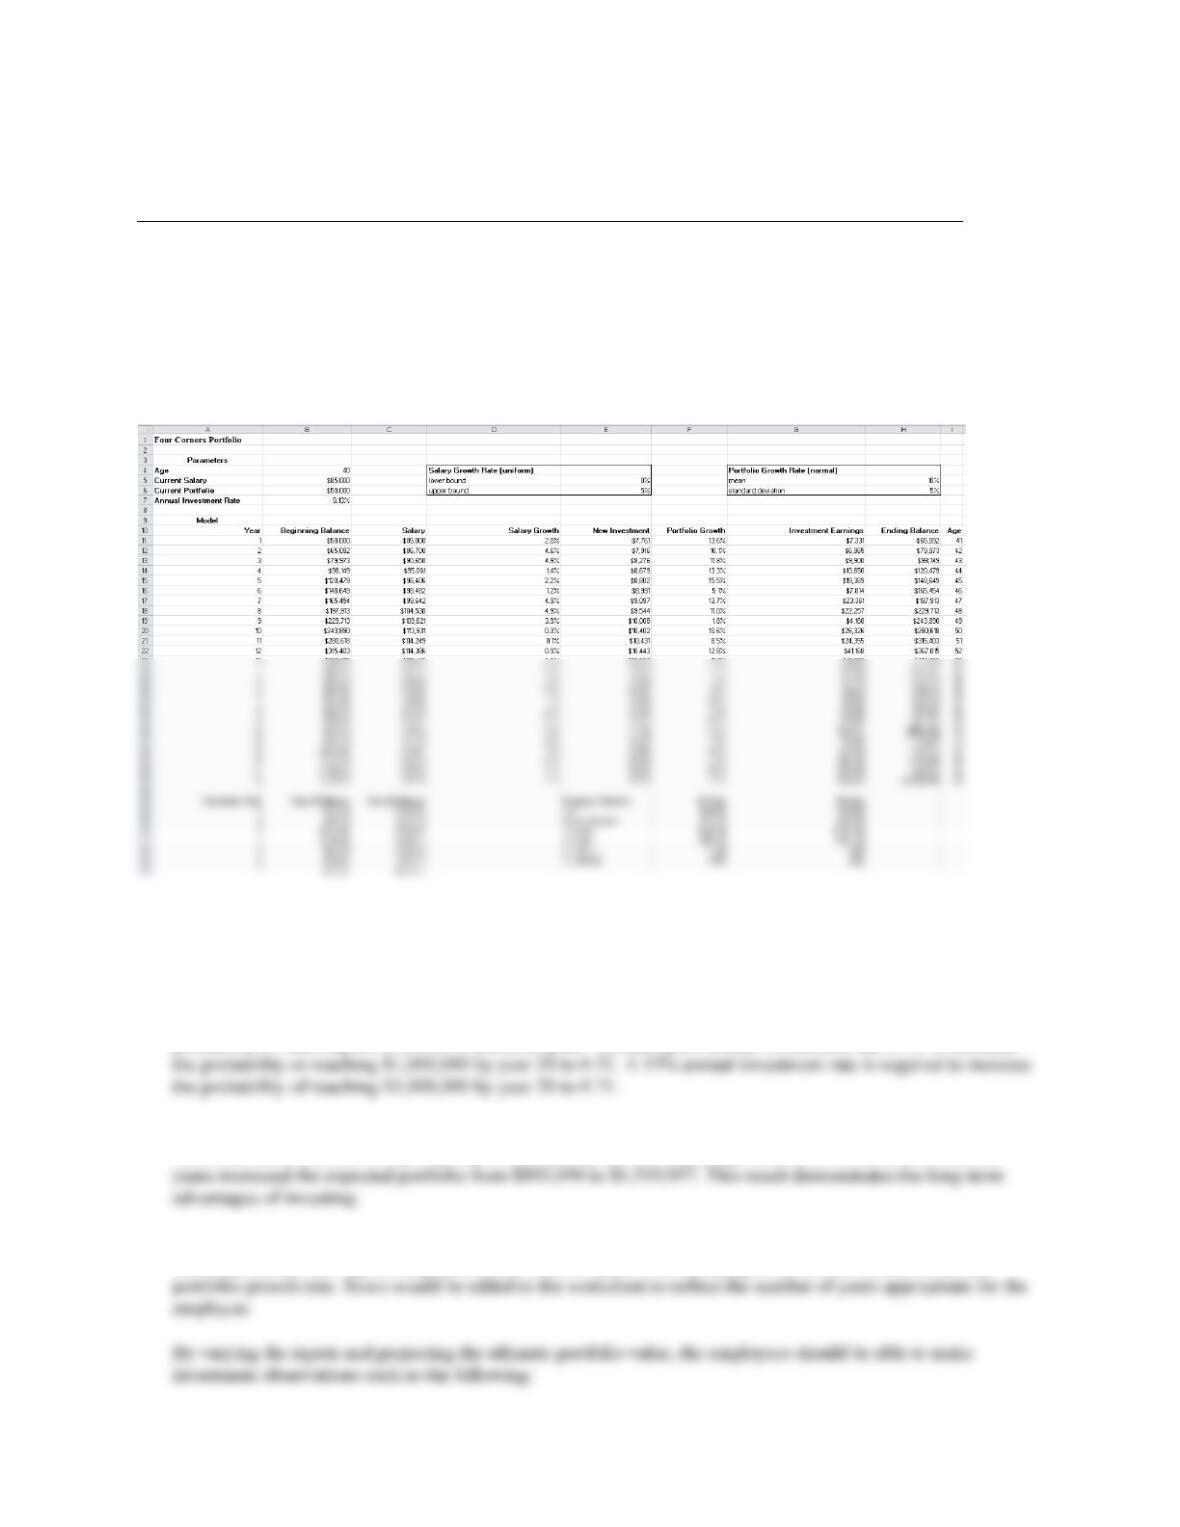
2. The spreadsheet needs to be redesigned so that the salary growth rate and portfolio growth rate can vary from
year to year:
Estimates of output measures vary from simulation to simulation. We report typical results. The 20-year
portfolio had a mean value of $893,694. There is a 22% chance of having $1,000,000 or more by year 20. The
20-year portfolio varied across a wide range (approximately $509,199 to $1,496,100). There was about a 56%
chance that the portfolio does not reach $900,000.
3. The simulation model suggests additional strategies should be considered to obtain a reasonably high
4. The longer 25-year period is definitely a good idea. Expanding the simulation spreadsheet by five years will
show that there is about 0.99 probability of a 25-year portfolio exceeding $1,000,000. In fact, the extra five
5. The simulation worksheet can be used for any employee. The employee may enter his/her age, current salary,
current portfolio, and any assumptions he/she cares to make about salary growth rate, investment rate, and
Chapter 16
16 –
2
• Begin early with an investment program. The more years the better the ending portfolio value.
• Make new contributions to an investment program at the highest possible rate. Increasing the rate 1% or
2% will have a significant impact on the long-term portfolio.
Case Problem 2: Harbor Dunes Golf Course
We present a solution using Analytic Solver Platform with the Sim. Random Seed set to 1994 in the Options dialog
box.
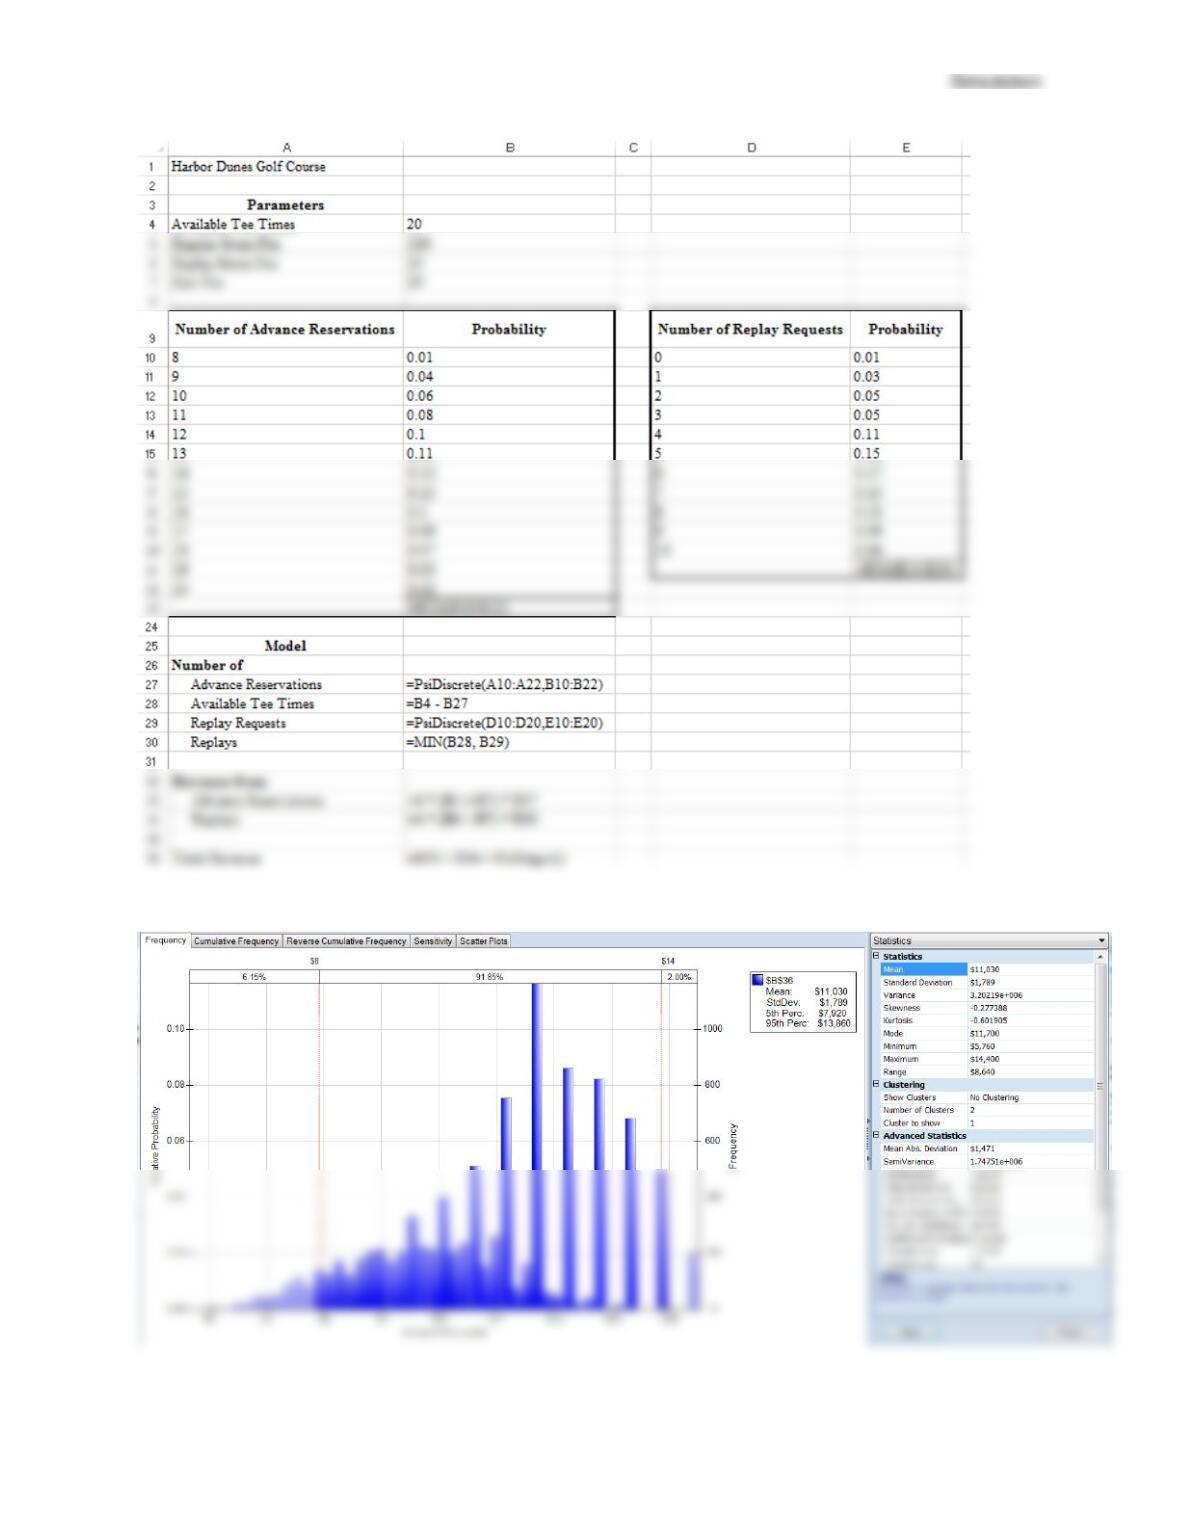
The formula view of the Analytic Solver Platform simulation worksheet is:
16 –
3
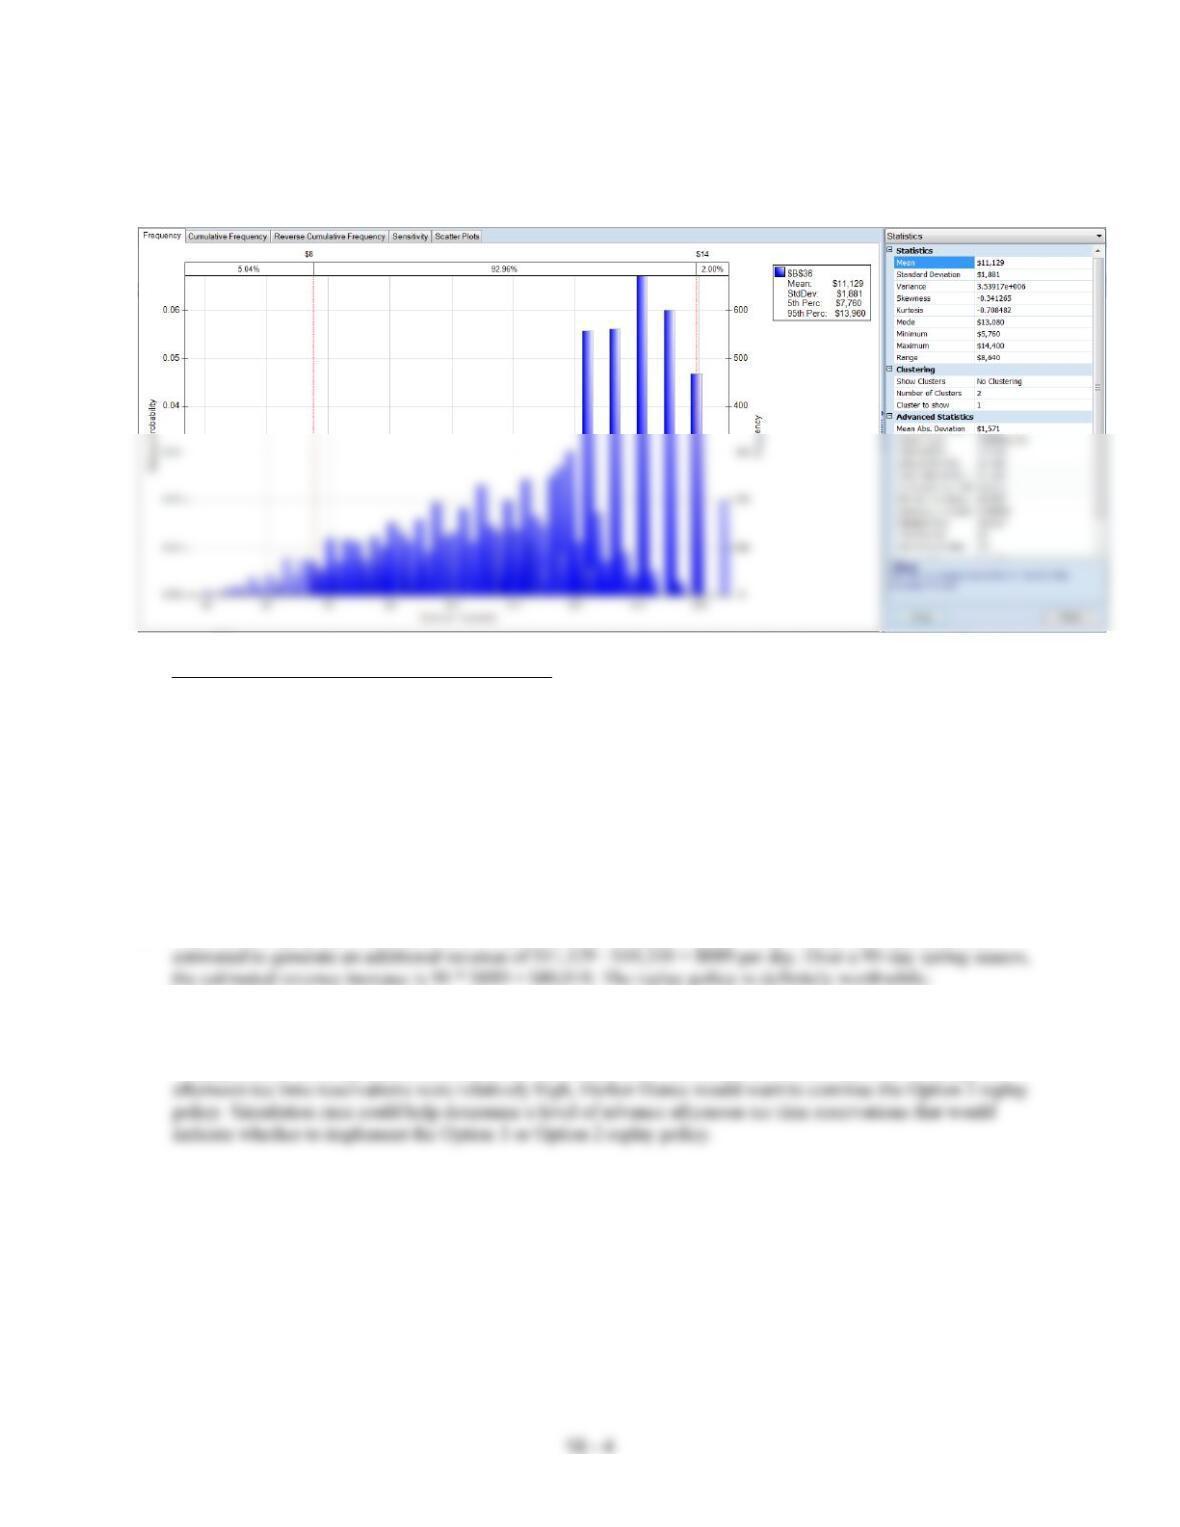
1. Total Revenue for Option 1:
Chapter 16
Total Revenue for Option 2:
Statistics
Option 1
Option 2
Mean
$11,030
$11,129
Mode
$11,700
$13,080
Standard Deviation
$ 1,789
$ 1,881
Minimum
$ 5,760
$ 5,760
Maximum
$14,400
$14,400
Based on the mean, Option 2 is preferred with a daily revenue advantage of $11,129 – $11,030 = $99.
Comparing the modes, the revenue in Option 2’s most likely case is $13,080 – $11,700 = $1380 larger.
2. Go with Option 2: The $50 per replay option.
3. Without the replay option, Harbor Dunes reported $10,240 daily revenue. Thus the Option 2 replay policy is
4. One suggestion is that Harbor Dunes wait until mid-morning to determine the afternoon replay option. If by
mid-morning, the afternoon tee time reservations are relatively low, Harbor Dunes may want to offer the Option
1 replay policy which generates more demand for the afternoon tee times. However, if by mid-morning, the
16 –
5
Case Problem 3: County Beverage Drive-Thru
1. Excel worksheets patterned after those used for the Black Sheep Scarves one- and two-server simulations. We
recommend using a separate workbook each of the following Drive-Thru designs: single-server with one clerk,
single-server with two clerks, and two-server with 2 clerks. One difference between the Black Sheep Scarves
simulation and the County Beverage Drive-Thru simulation is the treatment of the transient case. In the
statistical summary, Black Sheep Scarves excluded the first 100 customers since the simulation was intended to
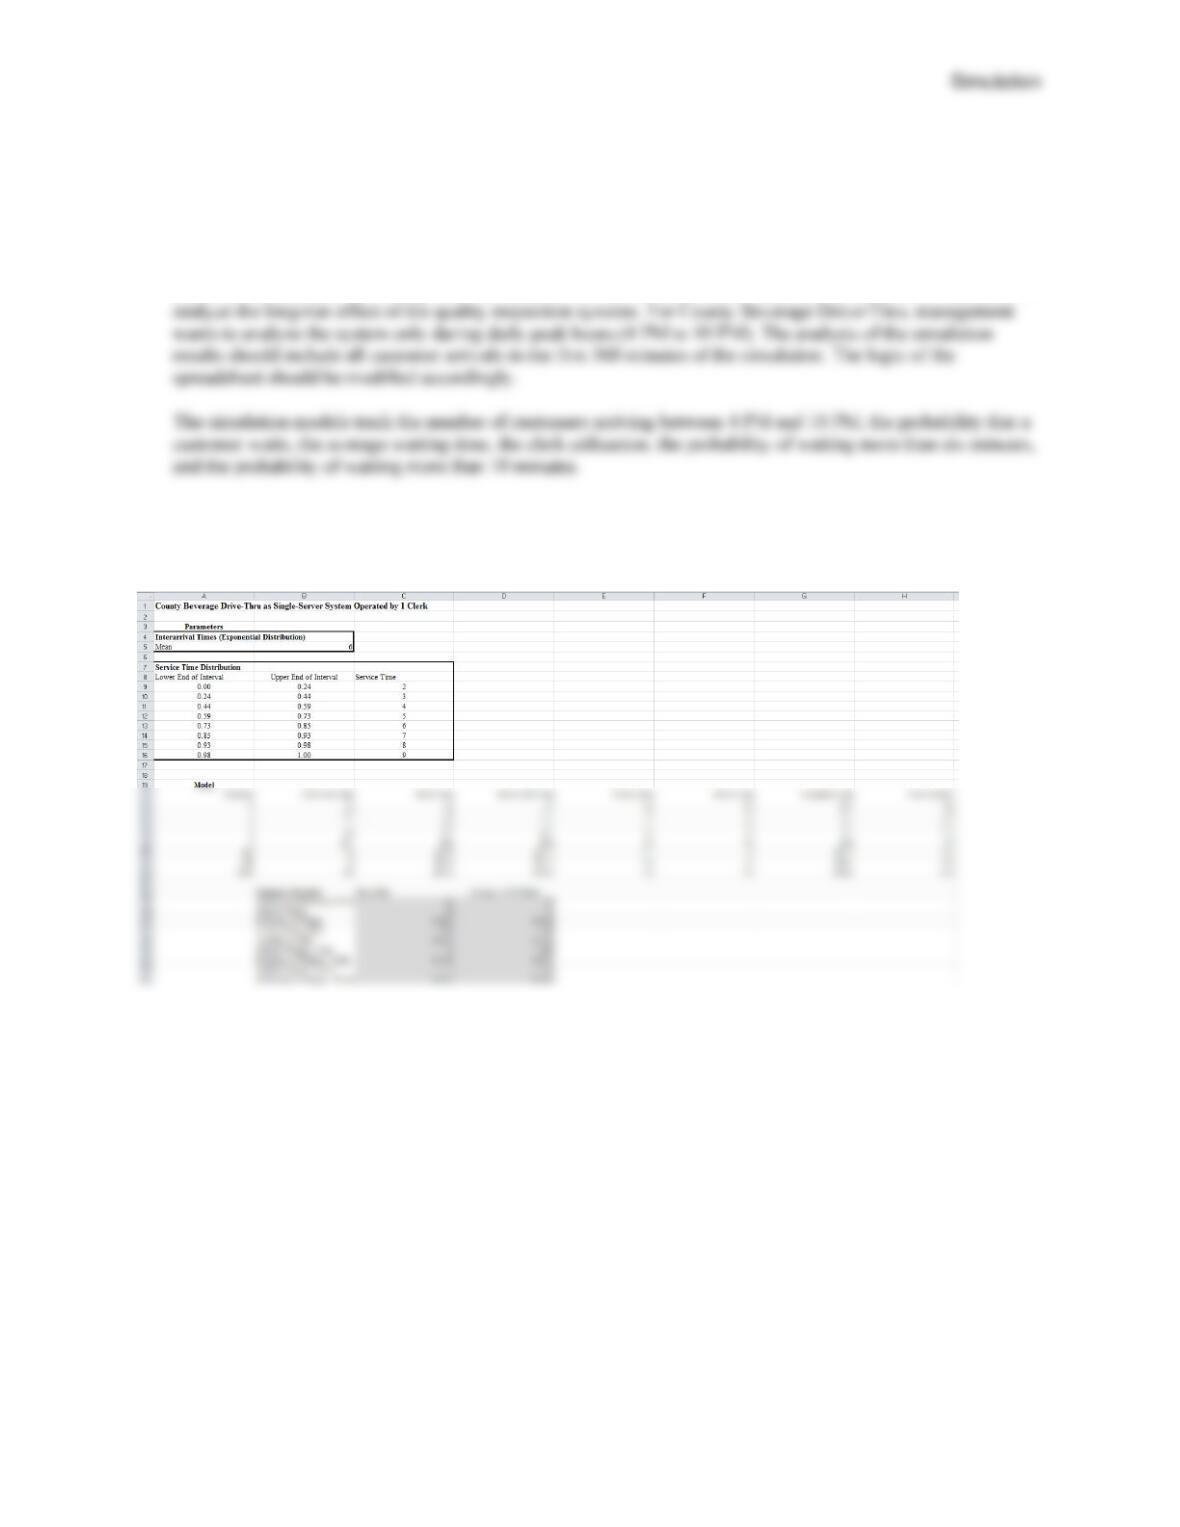
Single-Server System Operated by 1 Clerk
Note that in the computation of the single-run summary statistics, only the customers that arrive within the first 360
minutes of the simulation are included (as these are the ones arriving between 4 PM and 10 PM).
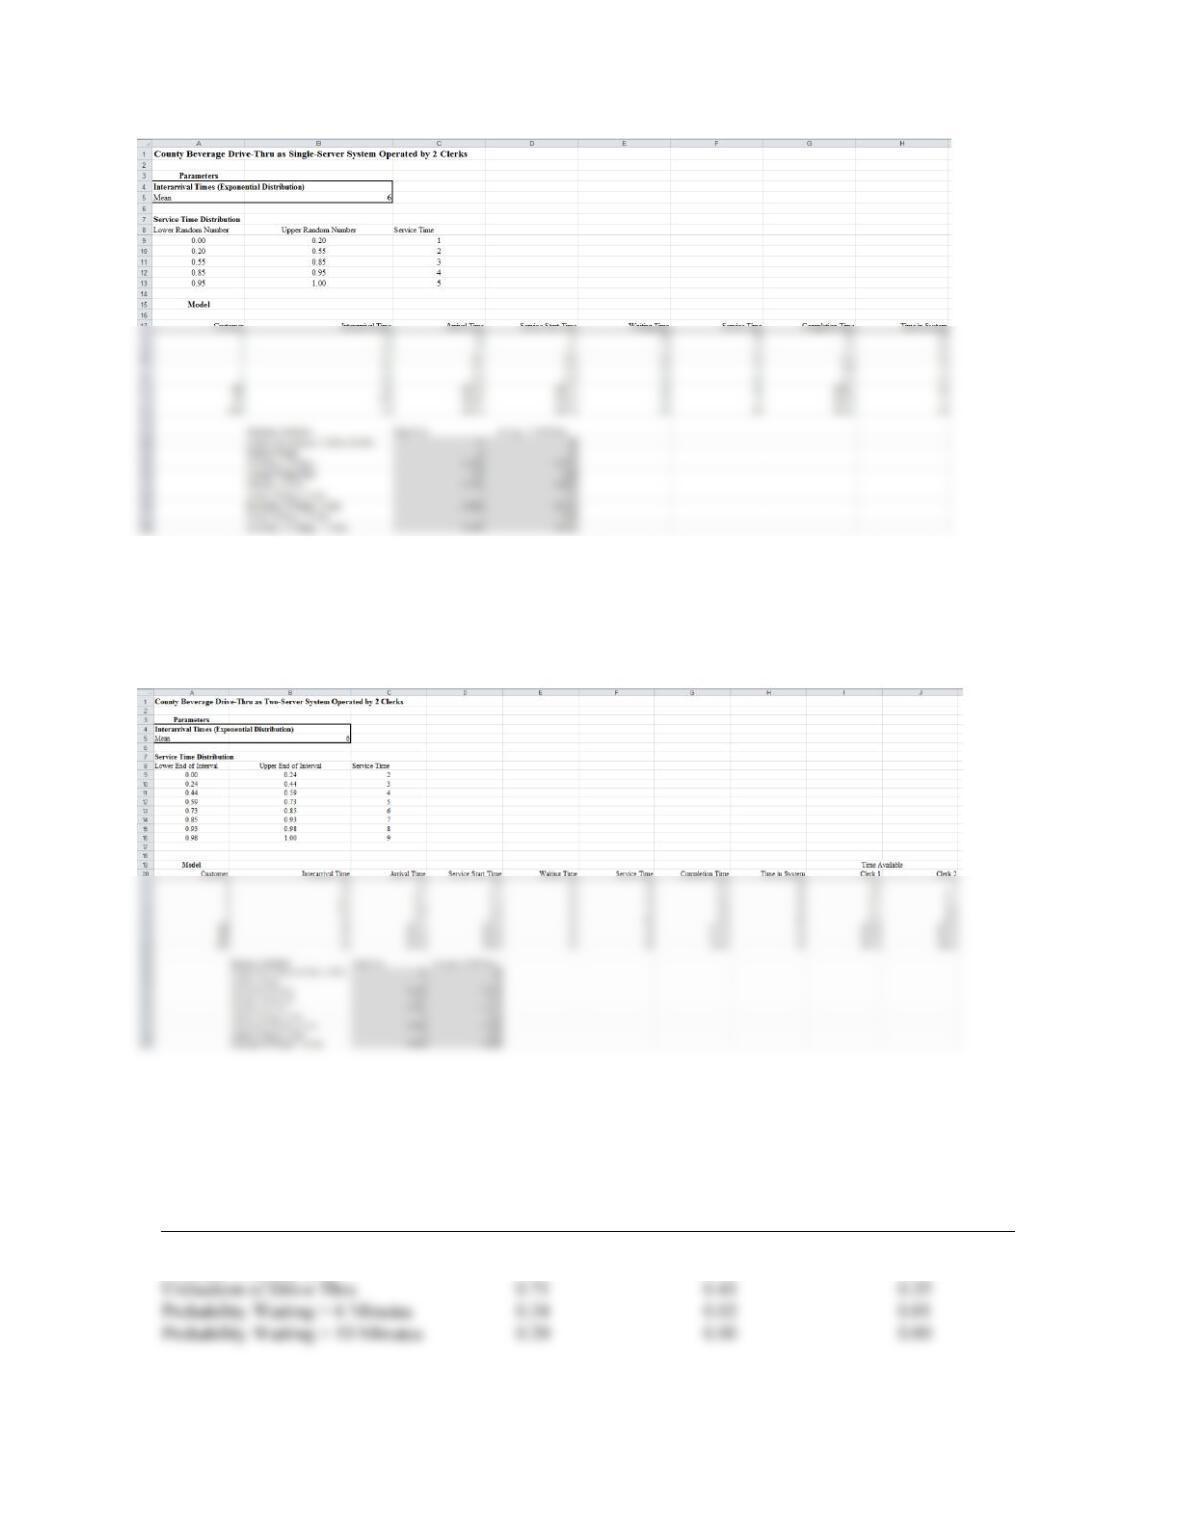
Single-Server System Operated by 2 Clerks
Similar to the single-server system with one clerk, we use the format of the BlackSheep1Inspector simulation model
(only the service time distribution differs from the single-server with one clerk case).
Chapter 16
16 –
6
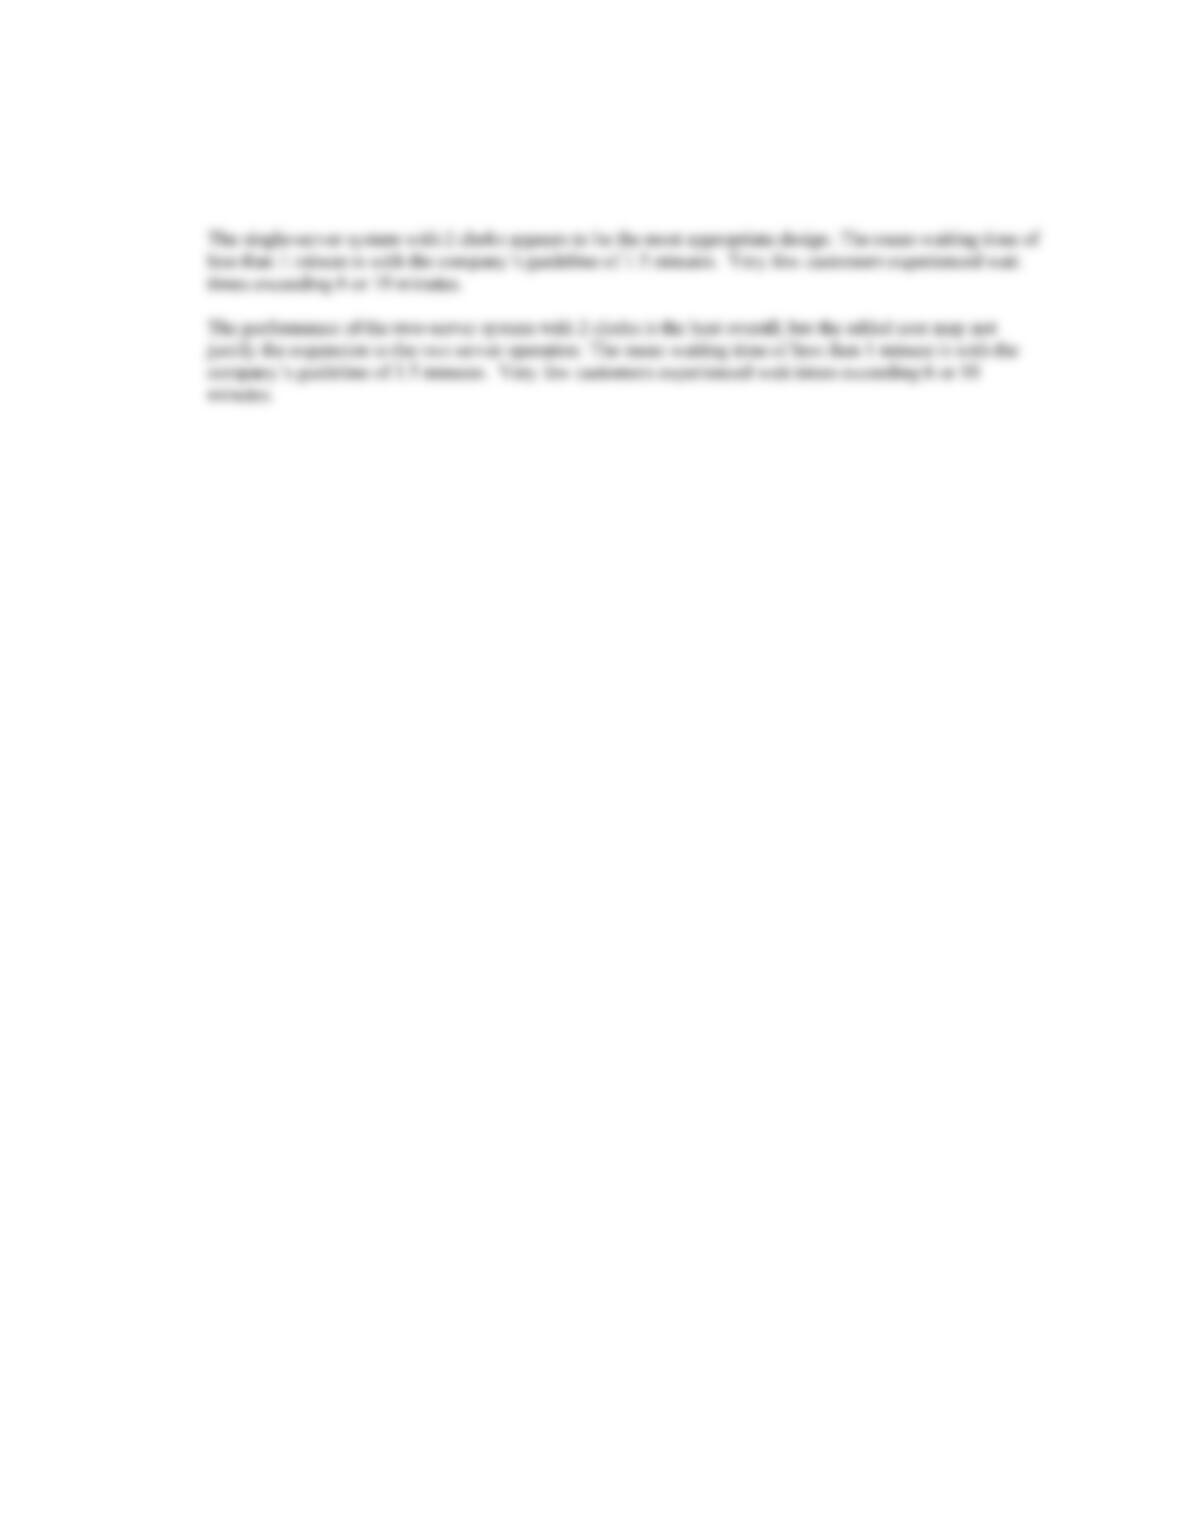
Two-Server System Operated by 2 Clerks
We use the format of the BlackSheep2Inspector simulation model. Customer interarrival times and service times are
the same as shown for the single-server operated by one clerk design.
2. A quick way to generate multiple runs of each of these waiting line simulations is to use a data table and track
the corresponding summary statistics across each replication. Simulation results will vary but one set of results
over 1000 runs are as follows:
Summary Statistic
Single-Server
System,
1 Clerk
Single-Server System,
2 Clerks
Two-Server System,
Two Clerks
Probability of Waiting
0.68
0.40
0.17
Average Waiting Time
5.47
0.96
0.36
Utilization of Drive Thru
0.71
0.41
0.35
Probability Waiting > 6 Minutes
0.34
0.02
0.01
Probability Waiting > 10 Minutes
0.20
0.00
0.00
Simulation
16 –
7
The single-server system with 1 clerk system appears unacceptable. The mean waited time is over 5
minutes which exceeds the company guideline of 1.5 minutes. In addition, 33% of customers waited over 6
minutes and 19% waited over 10 minutes.