35
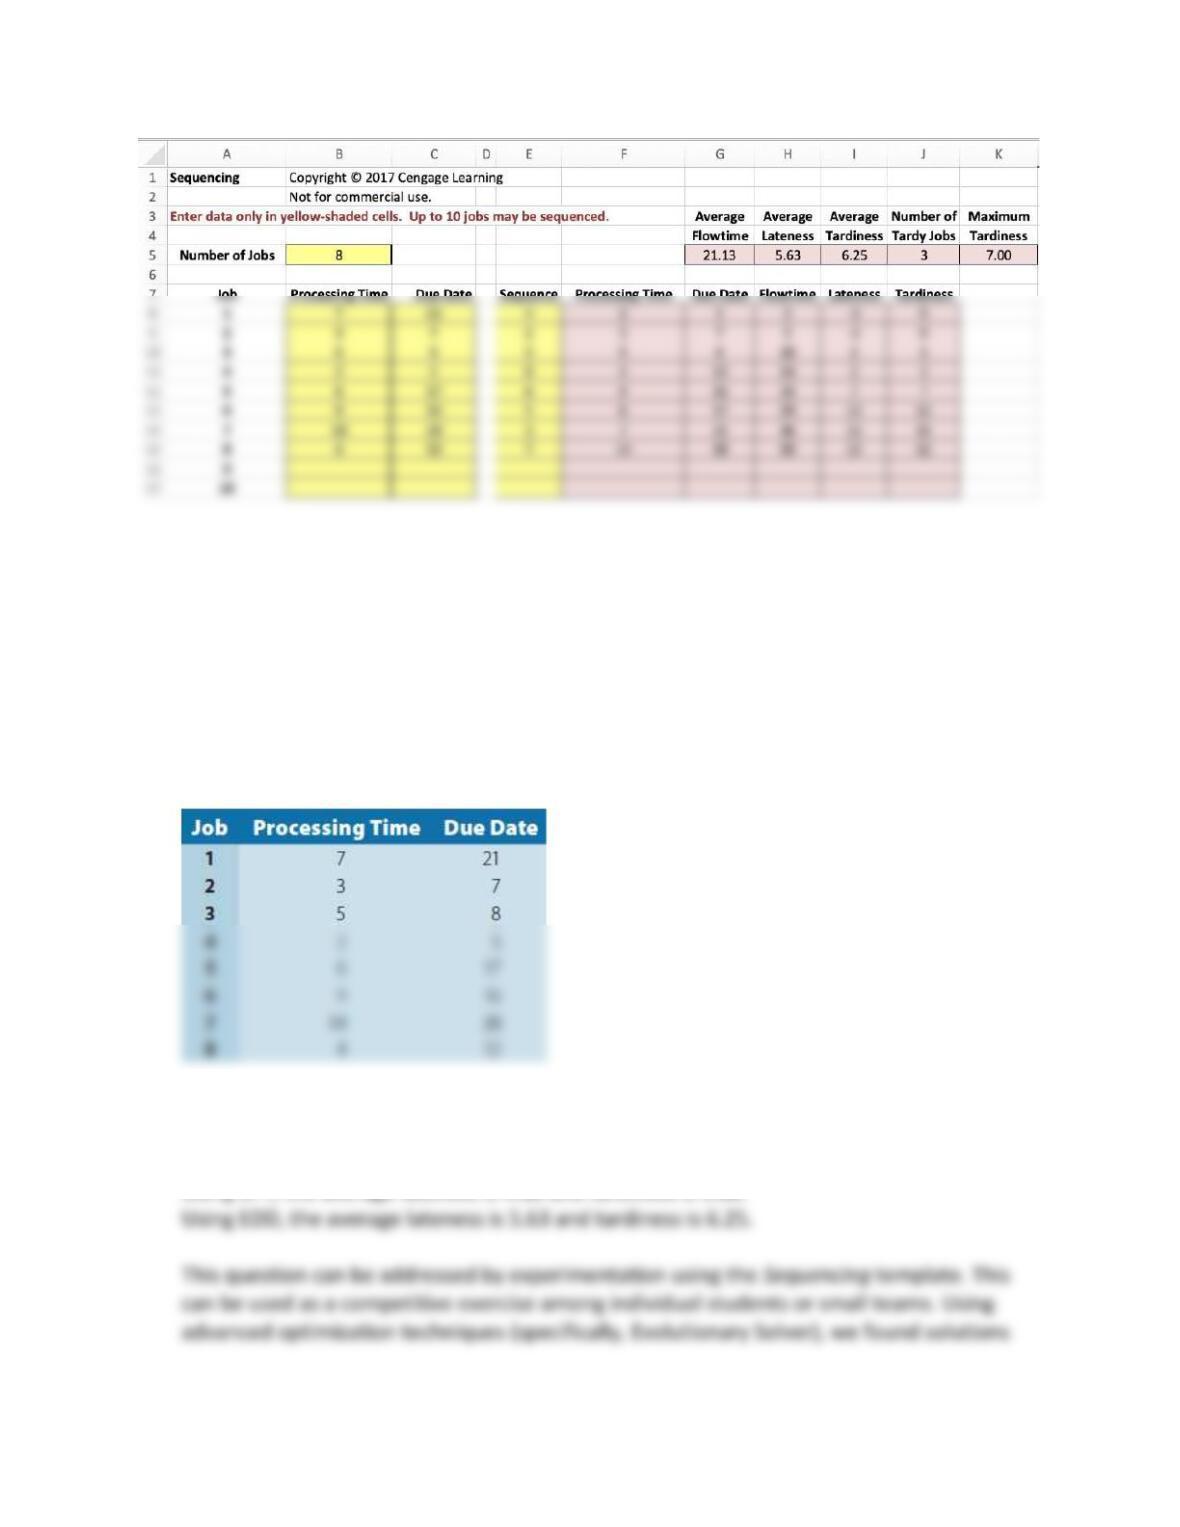
47. In this chapter, we noted that the EDD rule minimizes the maximum job tardiness and
maximum lateness while the SPT rule minimizes the average flowtime. However, neither
of these rules minimize the average lateness or average tardiness. Use the Excel
Sequencing template to answer the following using the data below:
a. Try to find a sequence that minimizes the average lateness.
b. Try to find a sequence that minimizes the average tardiness.
c. Can you generalize your logic into a rule or procedure that will accomplish these
objectives most of the time?
This is an advanced problem for teams or advanced students.
For the sequence 1 to 8, the average lateness is 9.5 and tardiness is 11.25.
36
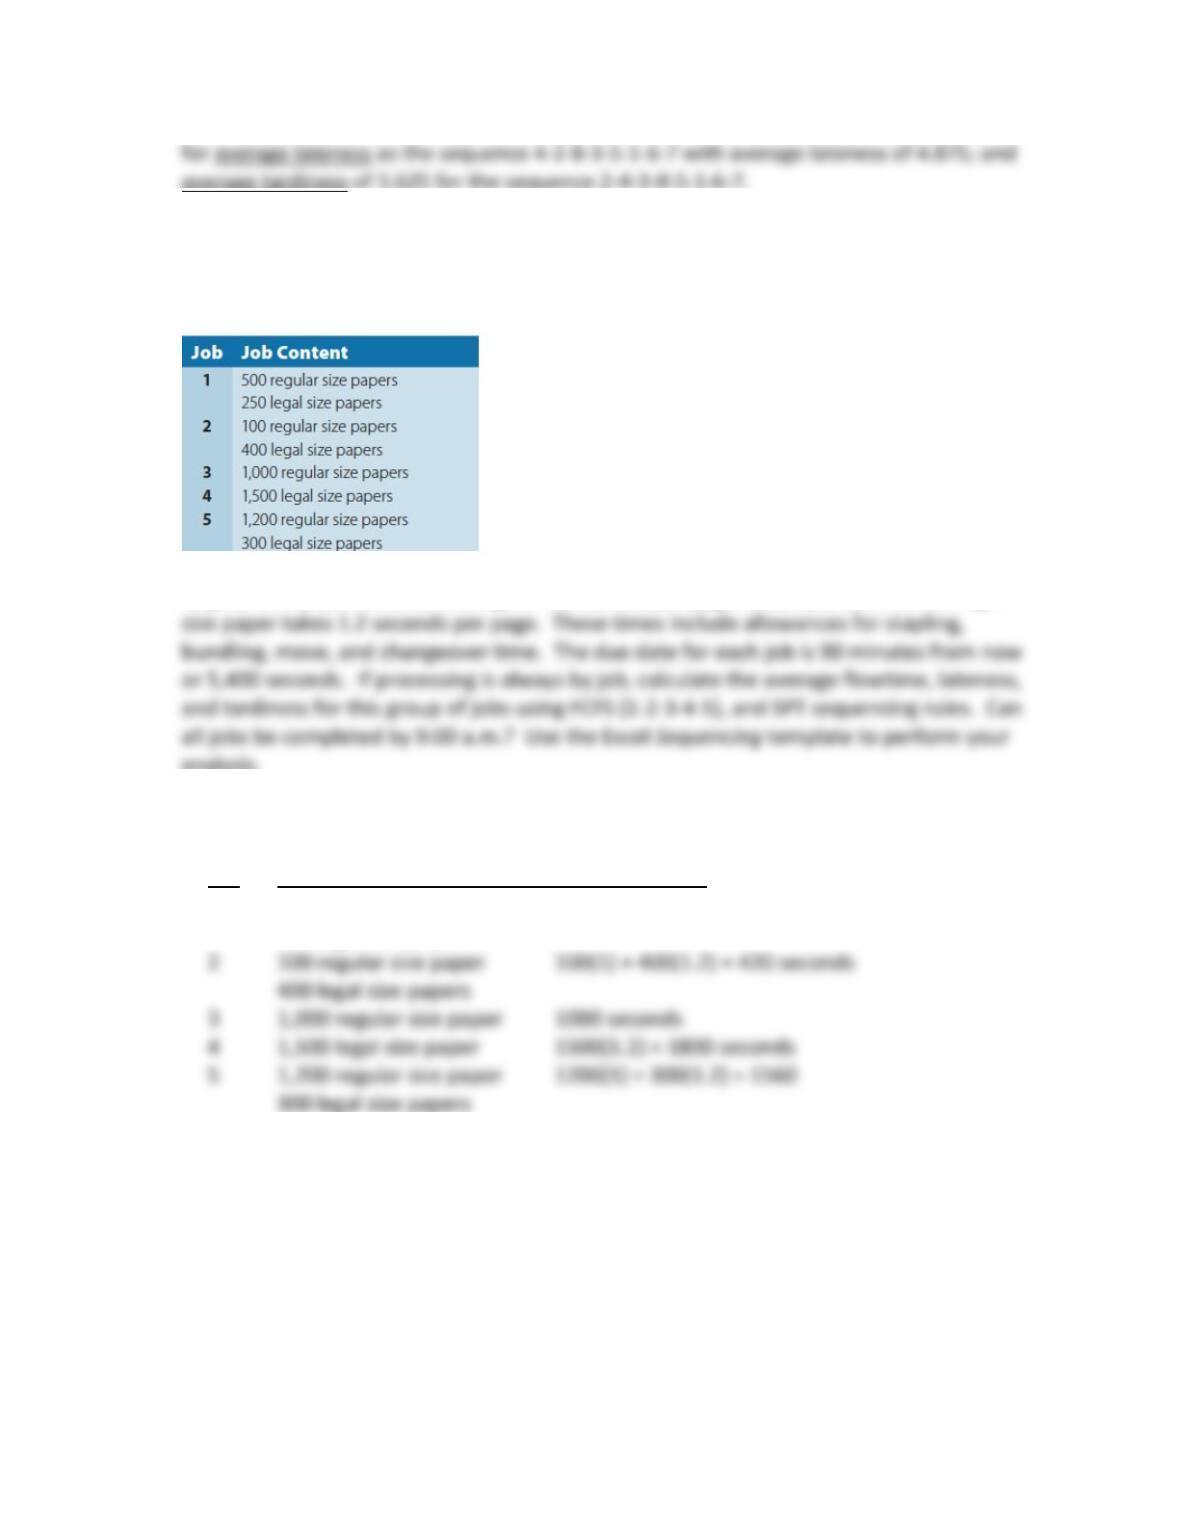
48. An attorney’s office operates with a single copier. At the beginning of a particular day the
following jobs are waiting for processing. All jobs must be distributed to clients or in court
by 9:00 a.m., and it is now 7:30 a.m.
Regular size paper takes an average of 1.0 second per page to complete, while the legal-
analysis.
First, compute the processing times for each job:
Job Job Content Processing Time
1 500 regular size paper 500(1) + 250(1.2) = 800 seconds
250 legal size papers
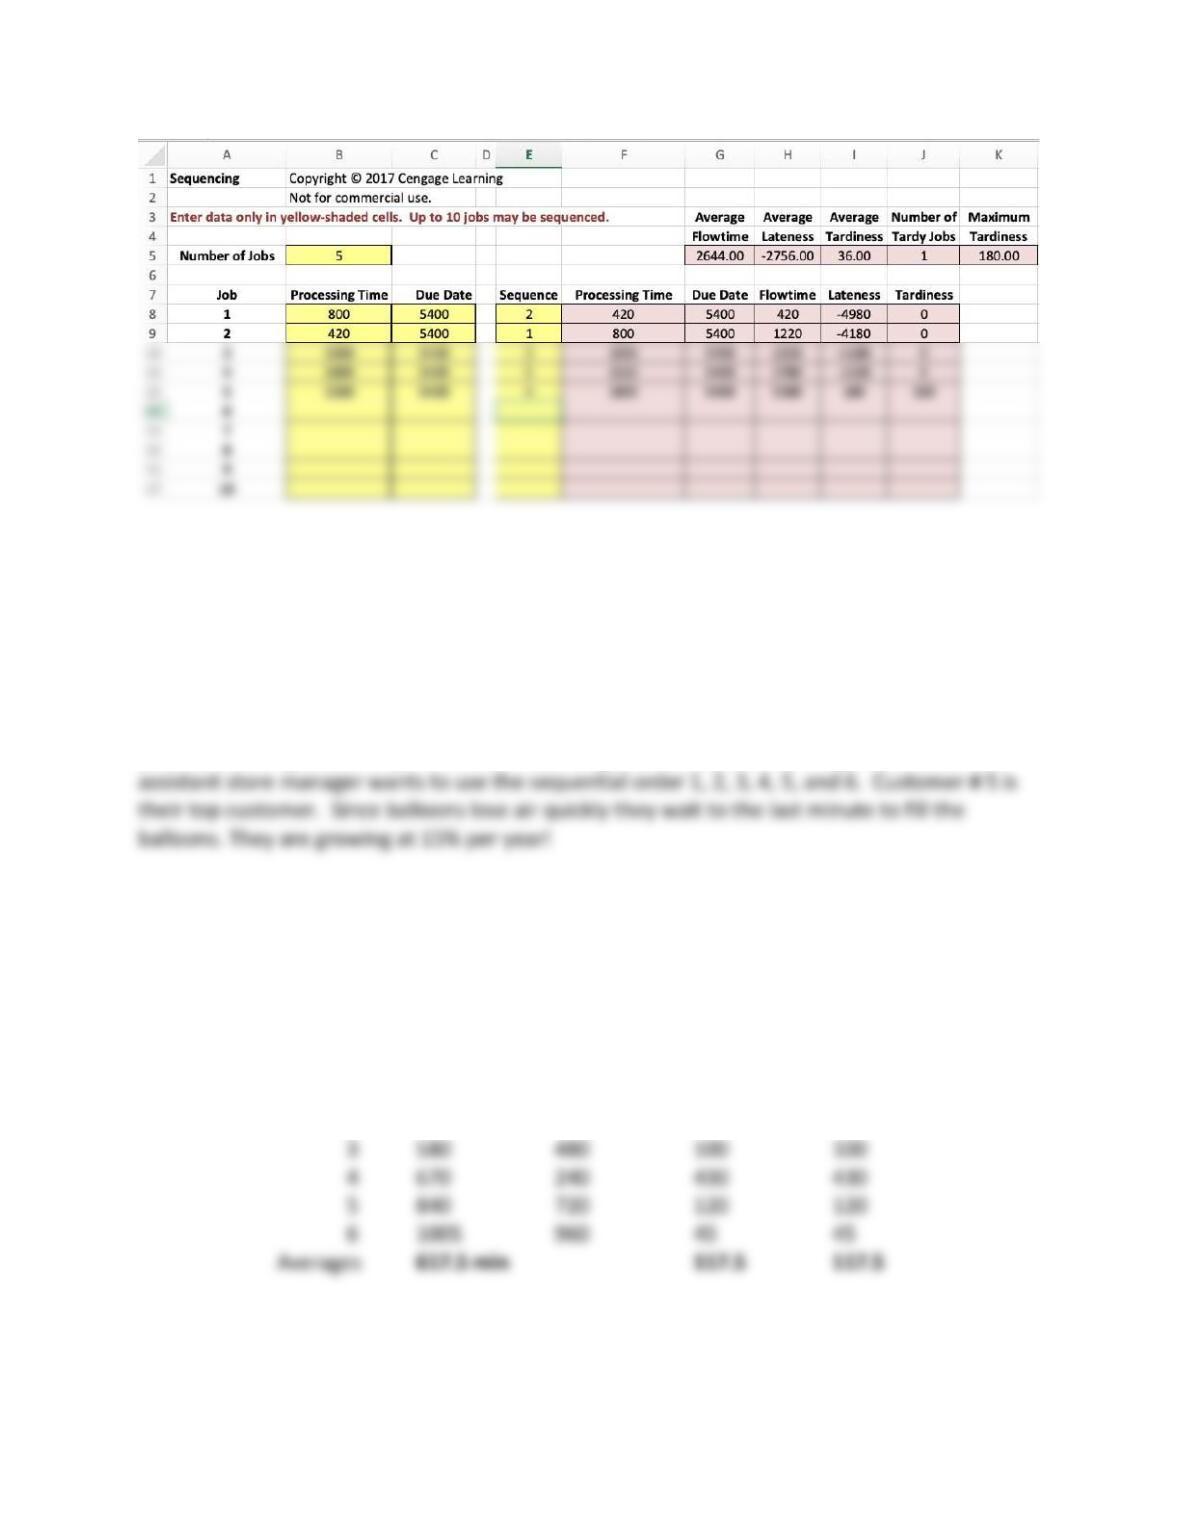
Since all due dates are the same, the EDD rule is not useful. The SPT sequence yields:
37
One job is late. Note however, that the total processing time (5580) exceeds the due date, so it is
impossible to complete all jobs on time.
Teaching Note: Luke’s Balloon Shop
Overview
A small business must sequence jobs using a single resource helium tank to fill balloons used in
parties, wedding, bachelor parties, etc. Processing and due date times are given and the
Case Questions for Discussion:
1. Compute the average flowtime, lateness, and tardiness for this group of jobs using Mr.
Sailboat’s sequential order of 1 (first), 2, 3, 4, 5, and 6 (last).
Job Flow time Due Dates Lateness Tardiness
—– ———— — —————– ————– ———–—
1 240 240 0 0
2 370 360 10 10
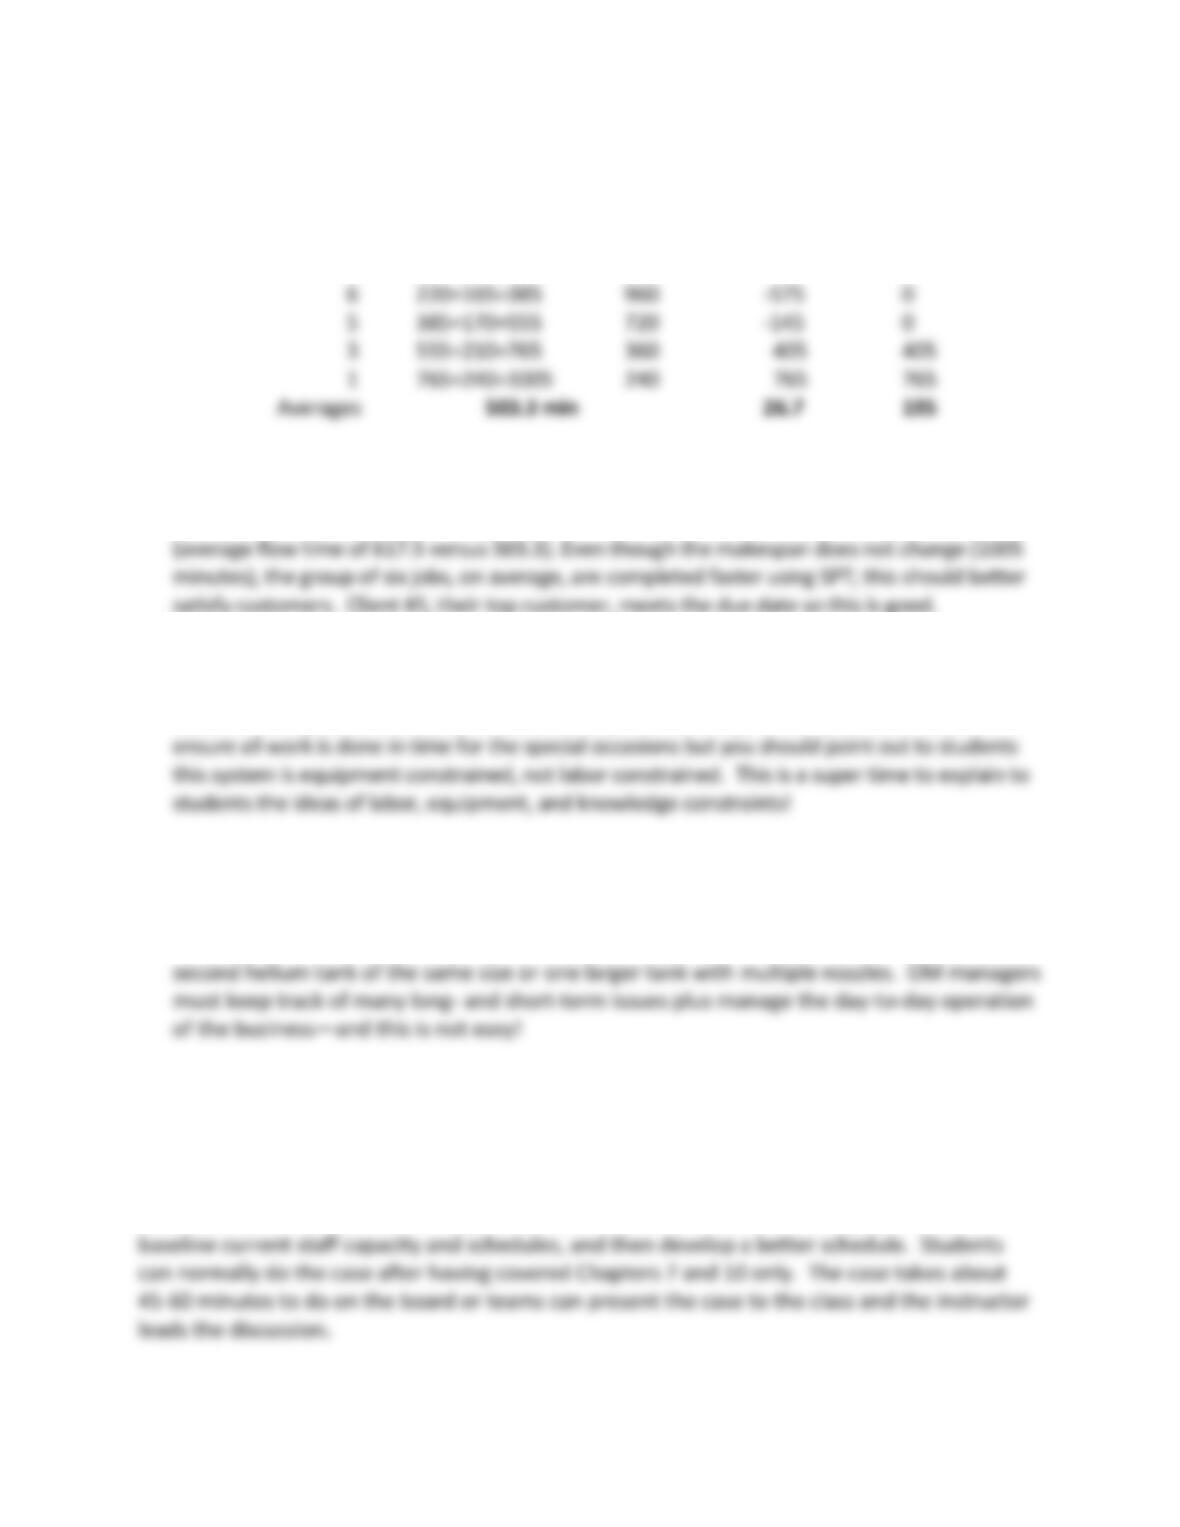
2. In what order would the jobs be processed using the SPT rule? Compute the average
flowtime, lateness, and tardiness for this group of jobs.
38
Job Flow time Due Dates Lateness Tardiness
— ———— — —————– ————– —-——–
4 90 240 -150 0
2 90+130=220 360 -140 0
3. Compare the answers in Questions 1 and 2.
SPT minimizes the average time a job spends in the shop either waiting or being processed
4. What are your short-term recommendations for this set of six jobs? Explain your reasoning.
Use SPT to sequence these jobs. Ms. Davis may want to bring in some part-time help to
5. What are your long-term recommendations with respect to sequencing jobs at Luke’s store?
Explain your reasoning.
They need to evaluate equipment capacity and determine “when” they need to install a
Teaching Note: Midwest Frequent Flyer Call Center
Overview
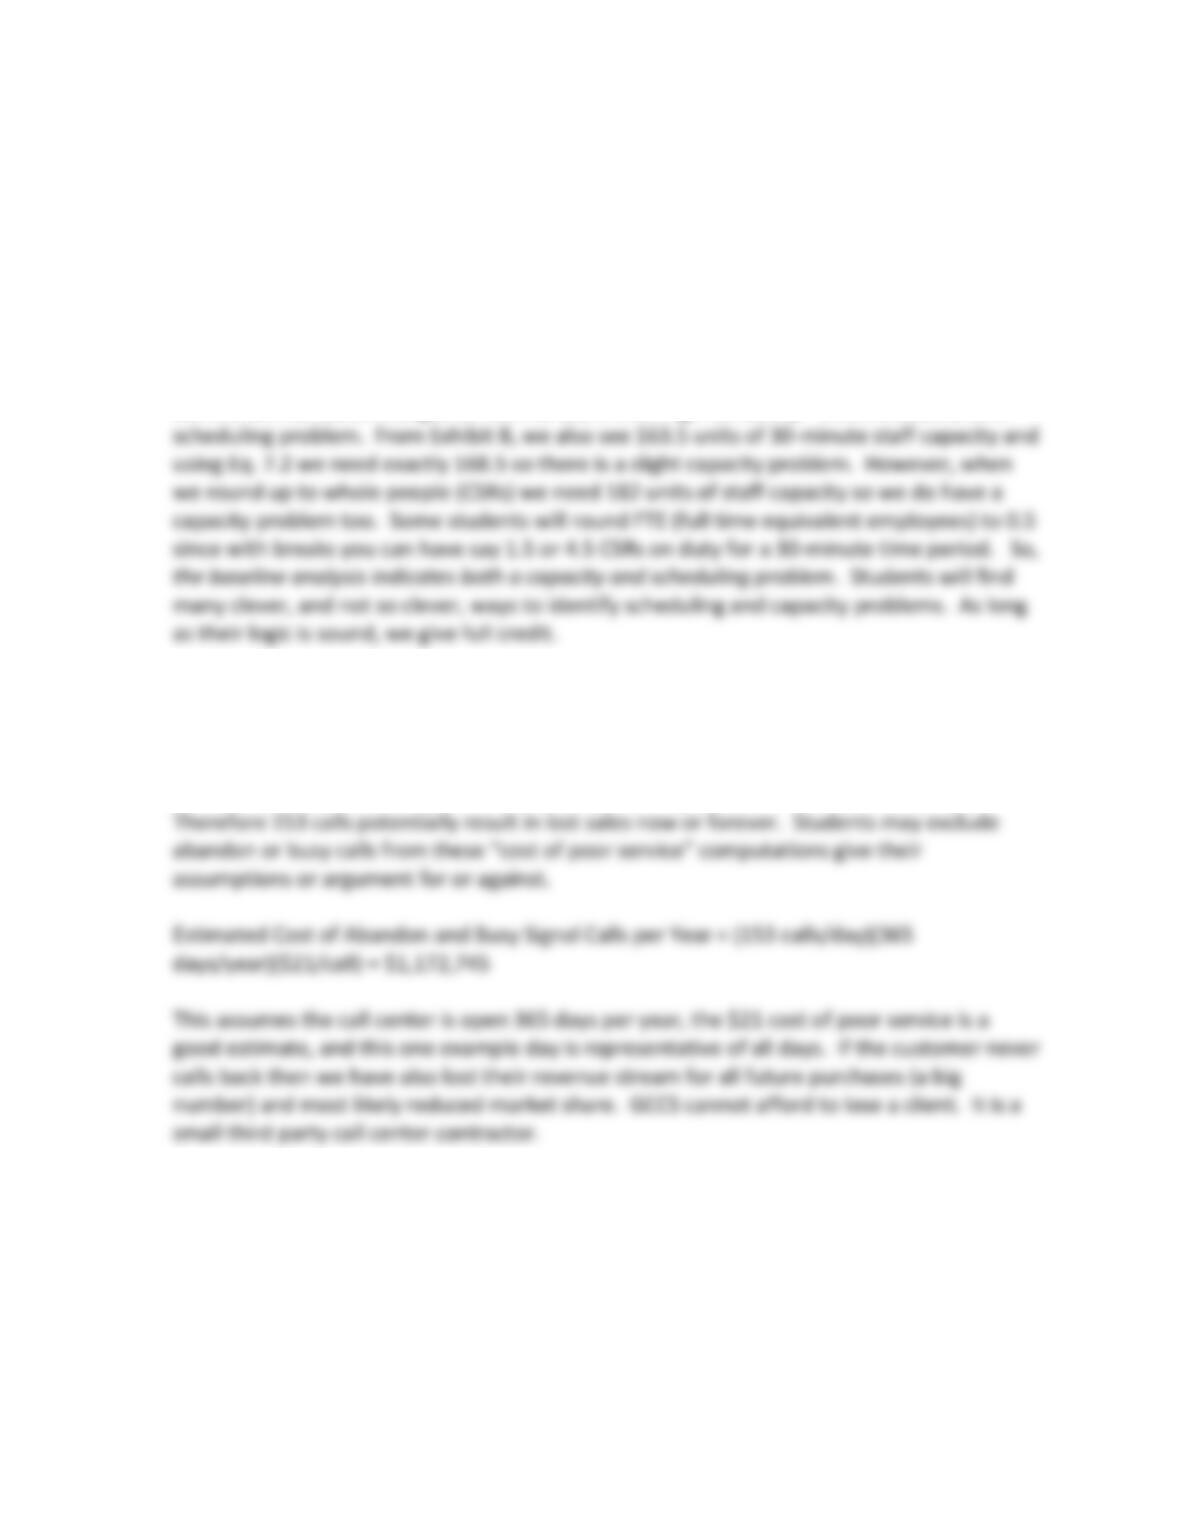
Students must follow the four-step process described in the case and use Equation 7.2 to
39
Case Questions for Discussion:
1. Analyze the case data and current schedule, and answer the following “baseline”
questions. What’s labor utilization for each 30-minute period given the current staffing
plan? Is the main problem lack of staff capacity or poor scheduling, or both? Can you
support your answer with numerical analysis?
See TN Exhibits A, B &C to answer issues in case question (1). From Exhibit B we see that
current CSR utilization ranges for 38% to 160% with high variability—this is evidence of a
2. What is the cost of abandoned and busy signal calls for a typical Monday? Annually?
(Make and state assumptions as needed).
Given the data in the case, 5.4% (103/1,897) of total calls are abandoned and 2.6%
(50/1,897) of customers receive a busy signal and hang up for this example one day.
3. Develop a better CSR staff schedule (see Excel posted current staff schedule) if needed
and decide whether they should hire more CSRs or layoff a few. Will you use part-time
employees? If so, explain why and justify your reasoning.
See the TN Staff schedule discussion and schedules.
40
TN Exhibit B CSR Demand – Capacity Analysis
Time
Period
Number
of
Number
of
Number
of
Total
Calls
Current
Equation
7.2
Equation 7.2
Rounded
Calls
Taken
Abandon
Busy
Signal
Number
of
Current
Target
to Next
Calls by
Calls
CSRs
CSR
Number of
Highest
Customer
Not Taken
On-Duty
Utils (%)
CSRs@90% +
Number
6:30
15
0
0
15
2
0.60
1.3
2.0
7:00
16
0
0
16
2
0.64
1.4
2.0
7:30
45
4
0
49
3
1.31
4.4
5.0
8:00
60
5
0
65
5
1.04
5.8
6.0
8:30
62
6
2
70
5
1.12
6.2
7.0
9:00
71
4
1
76
5
1.22
6.8
7.0
9:30
77
5
0
82
5
1.31
7.3
8.0
10:00
84
4
99
6
1.32
8.8
9.0
10:30
75
8
3
86
7
0.98
7.6
8.0
11:00
81
4
3
88
7
1.01
7.8
8.0
12:00
79
2
0
81
6
1.08
7.2
8.0
12:30
66
3
2
71
6
0.95
6.3
7.0
1:00
80
4
3
87
5
1.39
7.7
8.0
1:30
76
8
6
90
4.5
1.60
8.0
8.0
2:00
92
6
7
6
1.40
9.3
10.0
2:30
85
7
5
97
0.74
8.6
9.0
41
4:00
67
4
4
75
7
0.86
6.7
7.0
4:30
62
2
0
64
7
0.73
5.7
6.0
5:00
54
1
0
55
4.5
0.98
4.9
5.0
5:30
51
1
1
53
5
0.85
4.7
5.0
6:00
37
0
0
37
5
0.59
3.3
4.0
6:30
48
3
2
53
4
1.06
4.7
5.0
7:00
42
0
0
42
4
0.84
3.7
4.0
8:00
26
2
0
28
4
0.56
2.5
3.0
8:30
22
1
0
23
4
0.46
2.0
3.0
9:00
19
0
0
19
4
0.38
1.7
2.0
Totals
1744
103
50
1897
163.5
28.10
168.51
182.00
Average
58.1
3.4
1.7
63.2
5.5
0.94
5.62
6.07
22.9
2.8
2.0
26.6
2.2
0.31
2.36
2.33
19
0
0
19
4
0.38
1.69
2.00
Maximum
92
7
105
1.60
9.33
10.00
Note (+): Standard time of 12.51 calls/CSR/30 minutes. We rounded here to integers but some students will
round to one-half FTEs since with breaks you can have say 1.5 or 4.5 FTEs per 30-minute time period. .
42
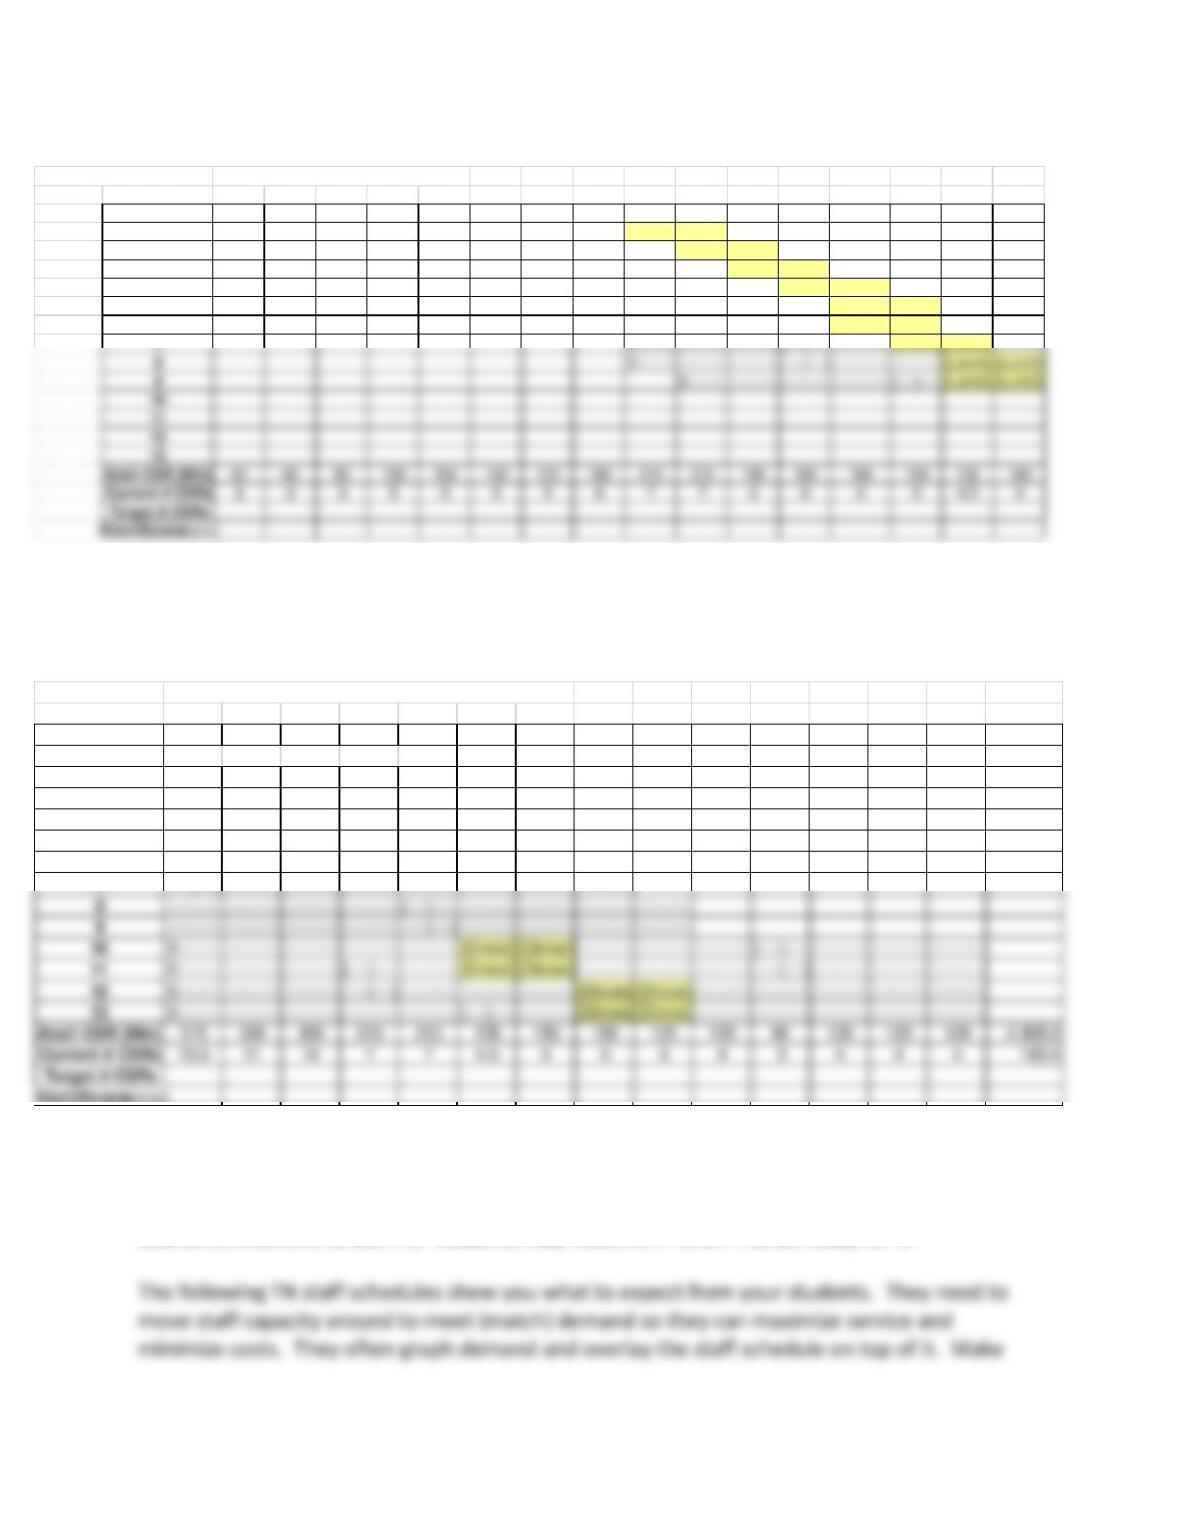
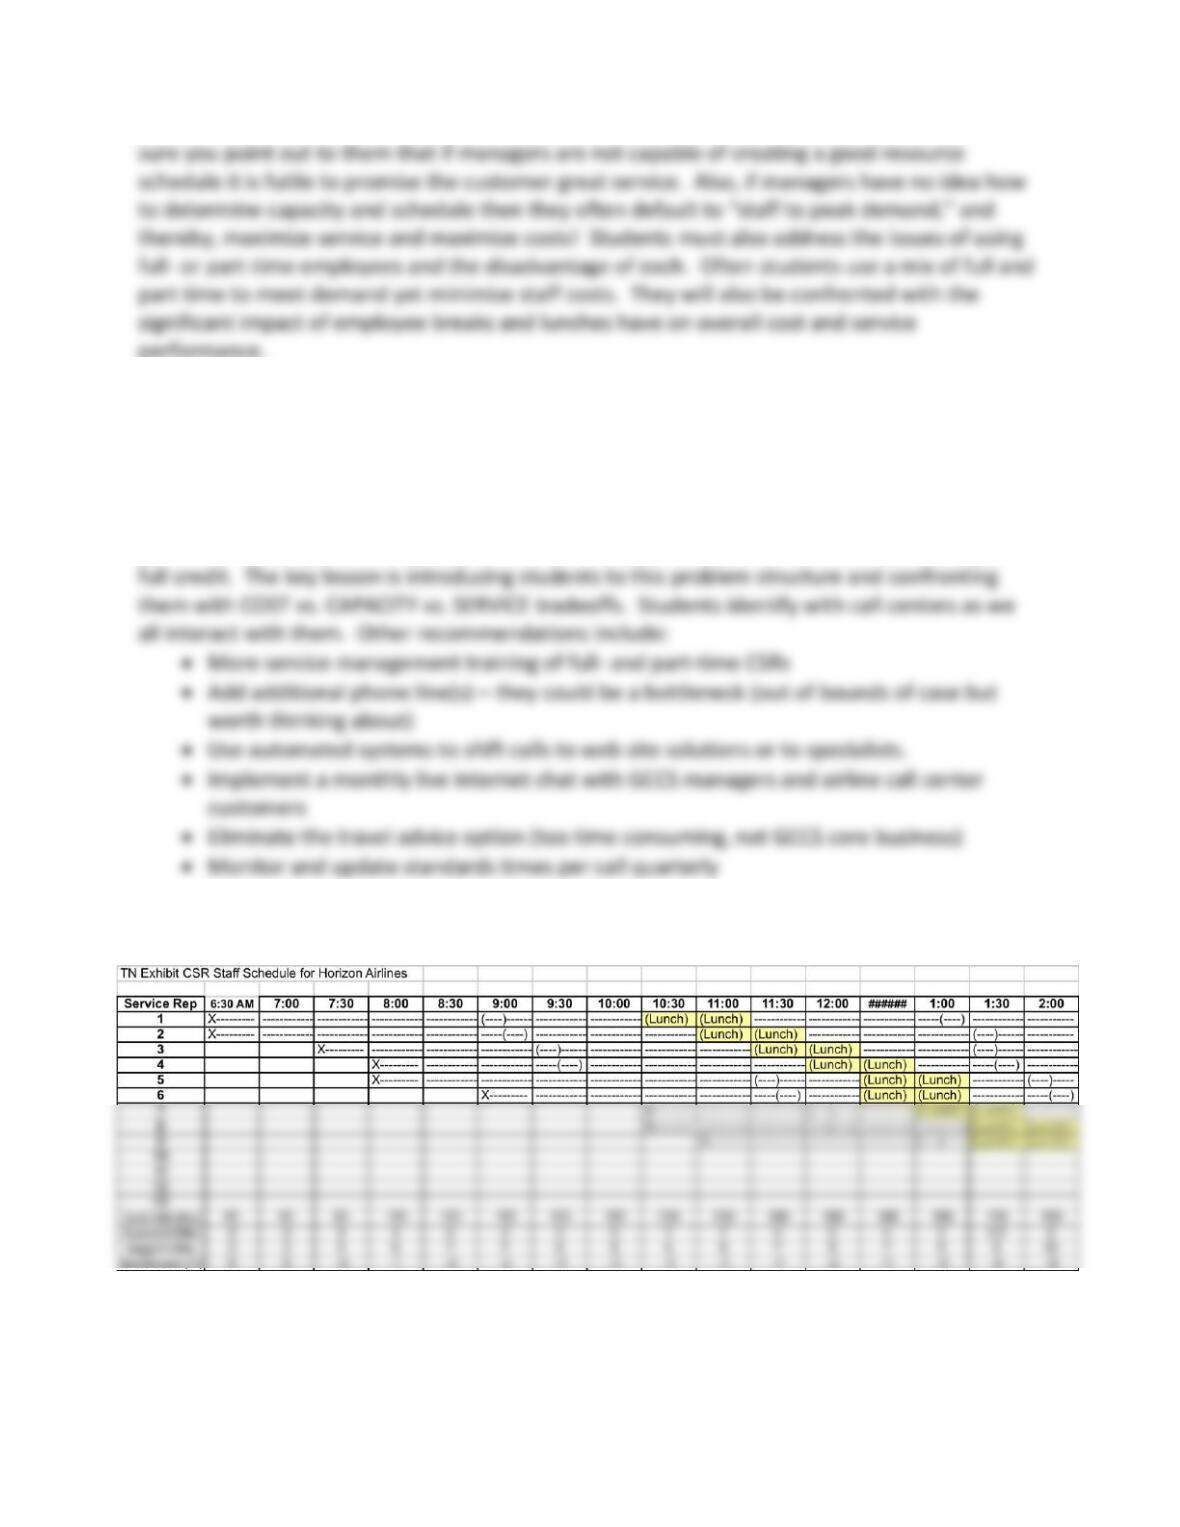
CURRENT and BLANK STAFF SCHEDULE WORKSHEETS (6:30 am to 2:00 pm)
CURRENT and BLANK STAFF SCHEDULE WORKSHEETS (2:30 PM TO 9:00 PM)
The current staff schedule is 13 employees with 9 full time (FTE greater than 7 hours plus 1
hour lunch + at least one 15-minute break) and 4 part-time (defined as anything other than full-
time). Using part time employees reduces total labor costs including benefits (i.e., the
Exhibit 13.20 Greyhound
CSR Staff Schedule for Horizon Airlines
Service Rep 6:30 7:00 7:30 8:00 8:30 9:00 9:30 10:00 10:30 11:00 11:30 12:00 ####### 1:00 1:30 2:00
1X————
—————
—————
—————
—————–
(—-)——-
—————
—————
(Lunch) (Lunch)
—————
—————
—————
—–(—-)
—————
———–
2X————
—————
—————
—————
—————–
—–(—-)
—————
—————
—————
(Lunch) (Lunch)
—————
—————
—————
(—-)——-
———–
3X————
—————
—————–
—————
(—-)——-
—————
—————
—————
(Lunch) (Lunch)
—————
—————
(—-)——-
—————
4X————
—————–
—————
—–(—-)
—————
—————
—————
—————
(Lunch) (Lunch)
—————
—–(—-)
—————
5X————
—————–
—————
—————
—————
—————
—————
(—-)——-
—————
(Lunch) (Lunch)
—————
(—-)—–
6X————
—————
—————
—————
—————
—–(—-)
—————
(Lunch) (Lunch)
—————
—–(—-)
Exhibit 3 Current
CSR Staff Schedule for Horizon Airlines (continued)
Service Rep 2:30 3:00 3:30 4:00 4:30 5:00 5:30 6:00 6:30 7:00 7:30 8:00 8:30 9:00 Totals
1
2
3———– ———–
4
—————
———– ———–
5
—————
—————
———–
6
—————
—————
—————
—————
———–
—————
—————
—————
—————
—————
—————
—————
—————
(—-)——-
—————
—————
—————
(—-)——-
Short/Excess (-/+)
—————
—————
(—-)——-
—————
—————
—————
—————
—————
—————
—————
—————
—————
43
4. What are your final recommendations?
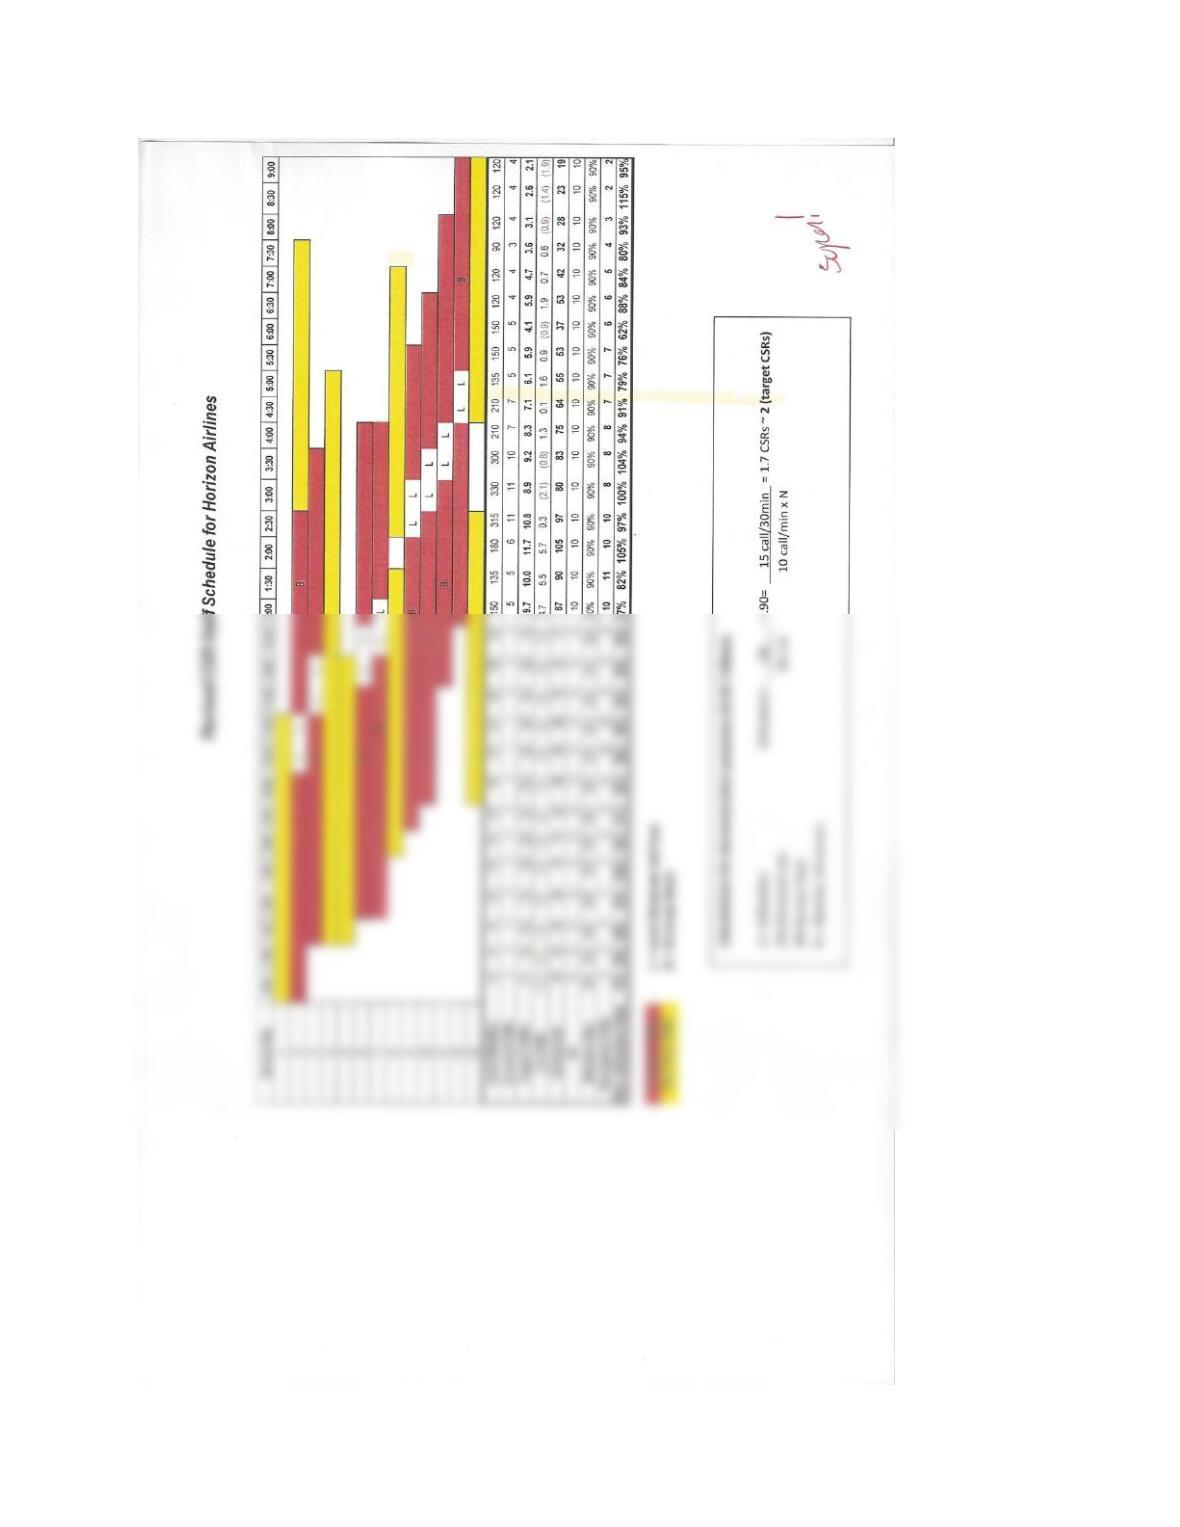
Students will make a wide variety of recommendations. Typical staffing plans depending on
assumptions range from (a) fifty percent full-time and fifty percent part-time employees to
meet call center demand, (b) 100% full time, and (c) some mix such as 75% full time and 25%
part-time. As long as their logic, presentations, clarity, and so on are sound we normally give
You will find student charts of demand and capacity to be very well done and colorful.
Teaching Approach
You might begin class by asking the students if they have experienced service upsets and long
waits due to poor capacity or staffing decisions. Let them tell their stories and then ask them
“Any idea if the root cause was a capacity or scheduling problem or both? Also, Exhibit 13.2
45
46
Integrative Case: Hudson Jewelers
Chapter 15 Case Questions for Discussion:
1. Develop a staff schedule between the hours of 9 a.m. and 8 p.m. for week 8, which had
587 visits (see the worksheet Hudson Jeweler Demand Case Data in MindTap). Assume
the maximum service rate is ten customers per hour per store employee. You will have to
allocate the demand over the day and time periods. You may use the Excel Hudson
Jeweler Staffing Schedule Worksheet that is available in MindTap or create your own.
Note: Please note that for service businesses such as Hudson Jewelers, Exhibit 14.2 applies, and
therefore, intermediate (Level 2) planning is not necessary for service businesses. That is,
aggregate plans are immediately disaggregated to detailed frontline resource (capacity)
planning and scheduling decisions.
• Peak demand in Hudson Jeweler Demand Case Data worksheet occurs in week 8 at 587
customer visits per week.
• The store is open 10 am to 5 pm Monday, Wednesday, Thursday, and Saturday or 7
Next is a typical student staff schedule and answer.
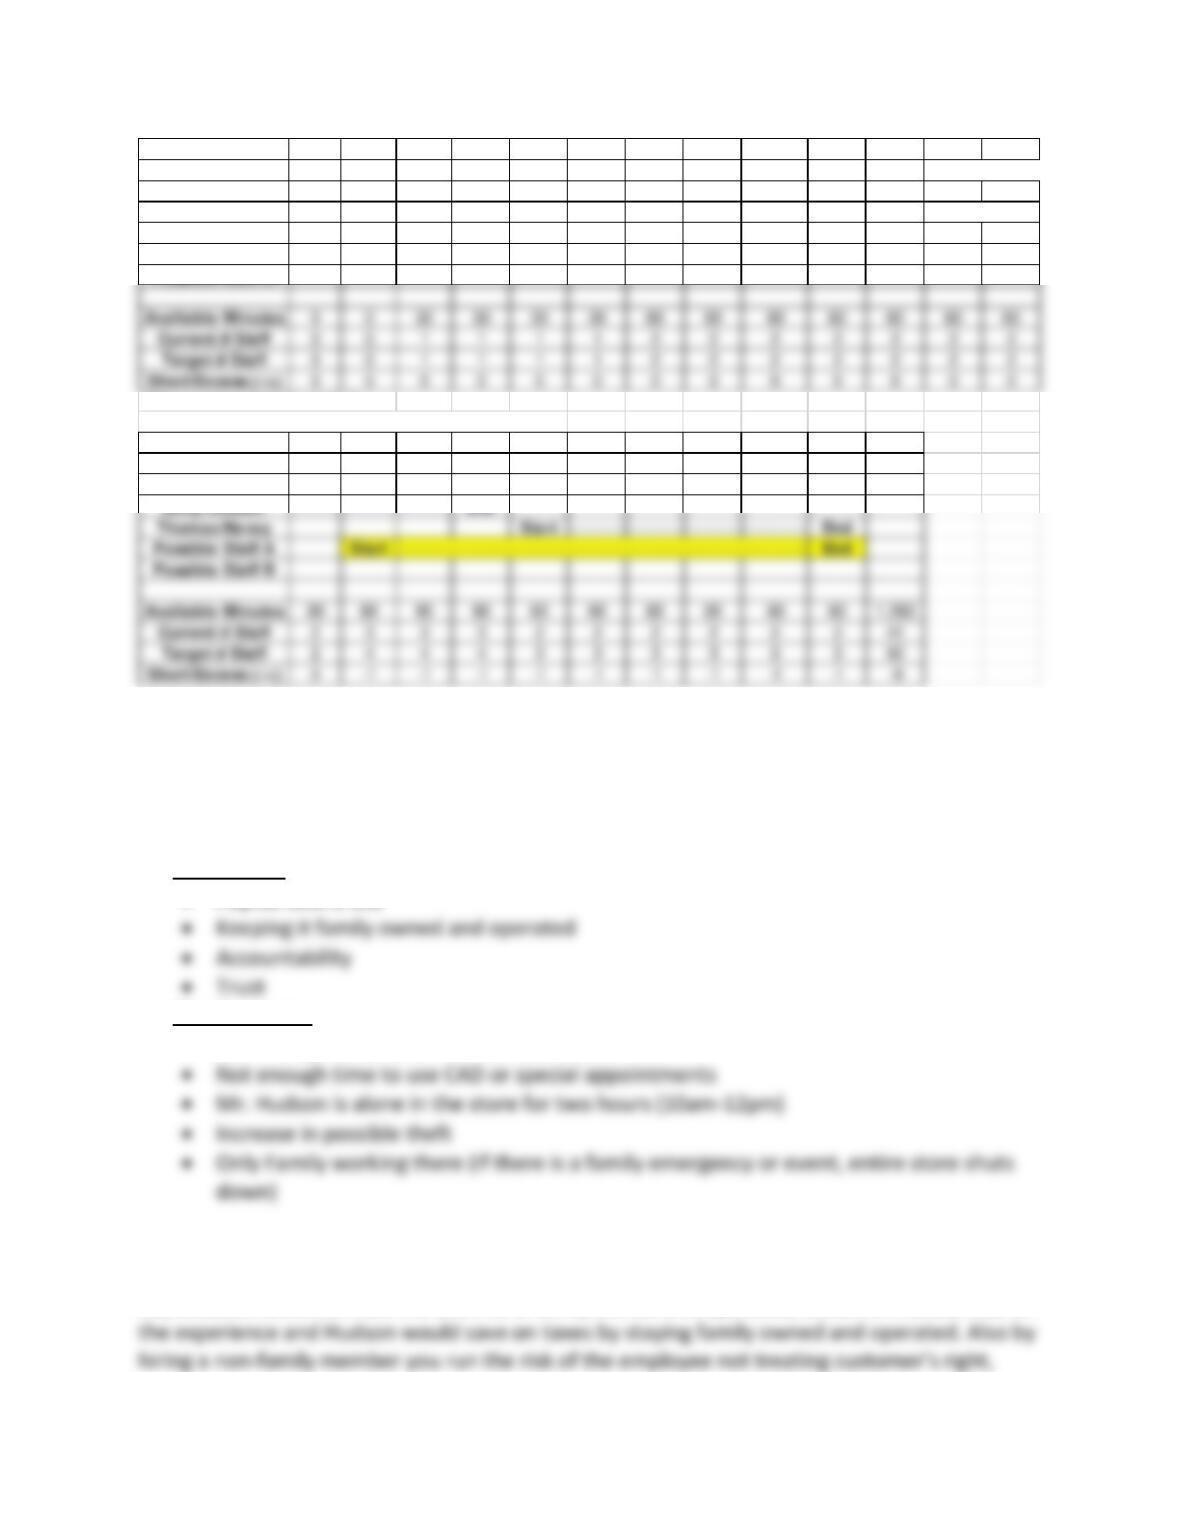
47
We think that hiring an extra person from 4-8 p.m. would free up Jasime to work one-on-one
with customer appointments and CAD.
2. What are the advantages and disadvantages of your store-staffing schedule?
Advantages
Disadvantages
• Just enough Employees to help Customers
3. Would you hire non-family employees to staff this single store? Explain your reasoning.
No, because customers see the store as a family owned and operated, customers would lose on
Staffing 9:00 9:30 10:00 10:30 11:00 11:30 12:00 12:30 1:00 1:30 2:00 2:30 3:00
Bill Hudson Start
—————
—————
—————
—————
—————
—————
(Lunch Lunch) ———————–
Jasime Navey Start
————
—————
—————
—————
(Lunch Lunch)
Betty Hudson Start
—————
——————————–
Thomas Navey
Possible Staff A
537 customer visits for week 8
537/48 total hours that week = 5.6 customers per 1/2 hour
Staffing 3:30 4:00 4:30 5:00 5:30 6:00 6:30 7:00 7:30 8:00 Totals
Bill Hudson
—————
—————
—————
End
Jasime Navey
—————
—————
—————
—————
—————
—————
—————
—————
—————
End
———————————————————————————–