Waiting Line Models
`
Chapter 15
Waiting Line Models
Case Problem 1: Regional Airlines
1. Single-Server Waiting Line Analysis
The analysis that follows is based upon the assumptions of Poisson arrivals and exponential service
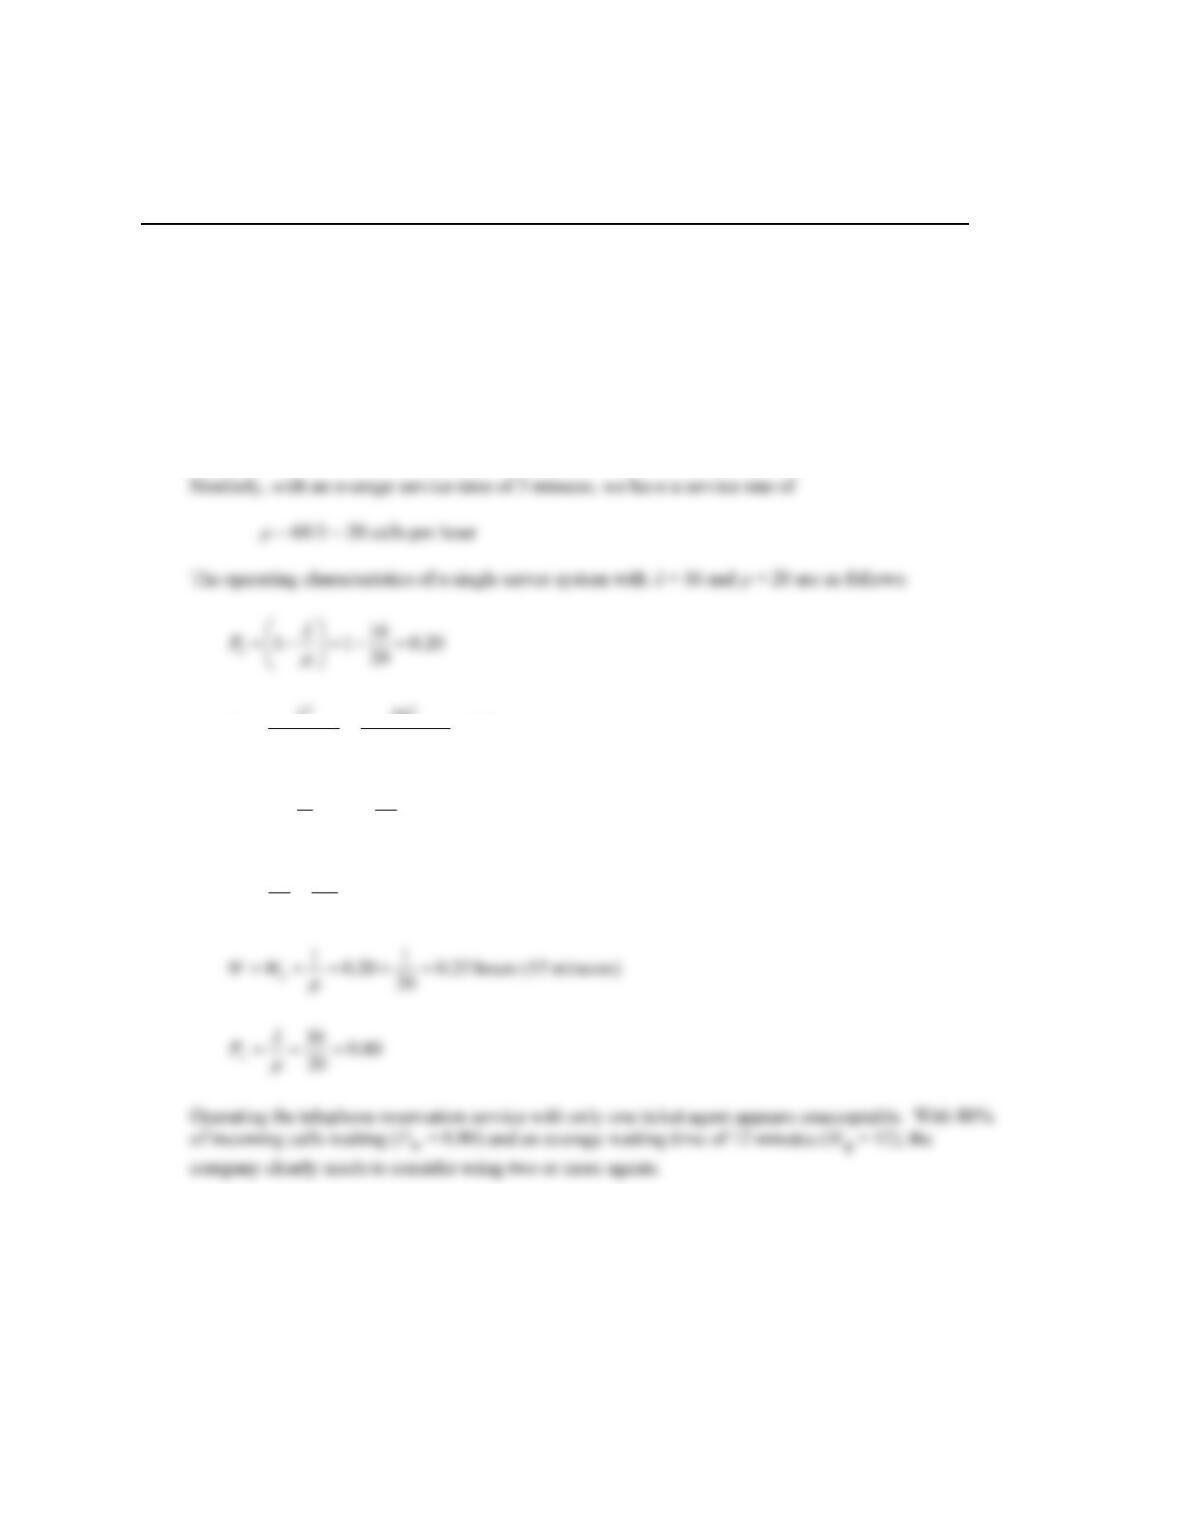
times. With one call every 3.75 minutes, we have an arrival rate of
= 60/3.75 = 16 calls per hour
16 3.2
( ) 20(20 16)
q
L
= = =
−−
16
3.2 4
20
q
LL
= + = + =
3.2 0.20
16
q
q
L
W
+ = =
hours (12 minutes)
2. Multiple-Server Waiting Line Analysis
Since Regional’s management team agreed that an acceptable service goal was to immediately answer
and process at least 85% of the incoming calls, the probability of waiting must be 15% or less.
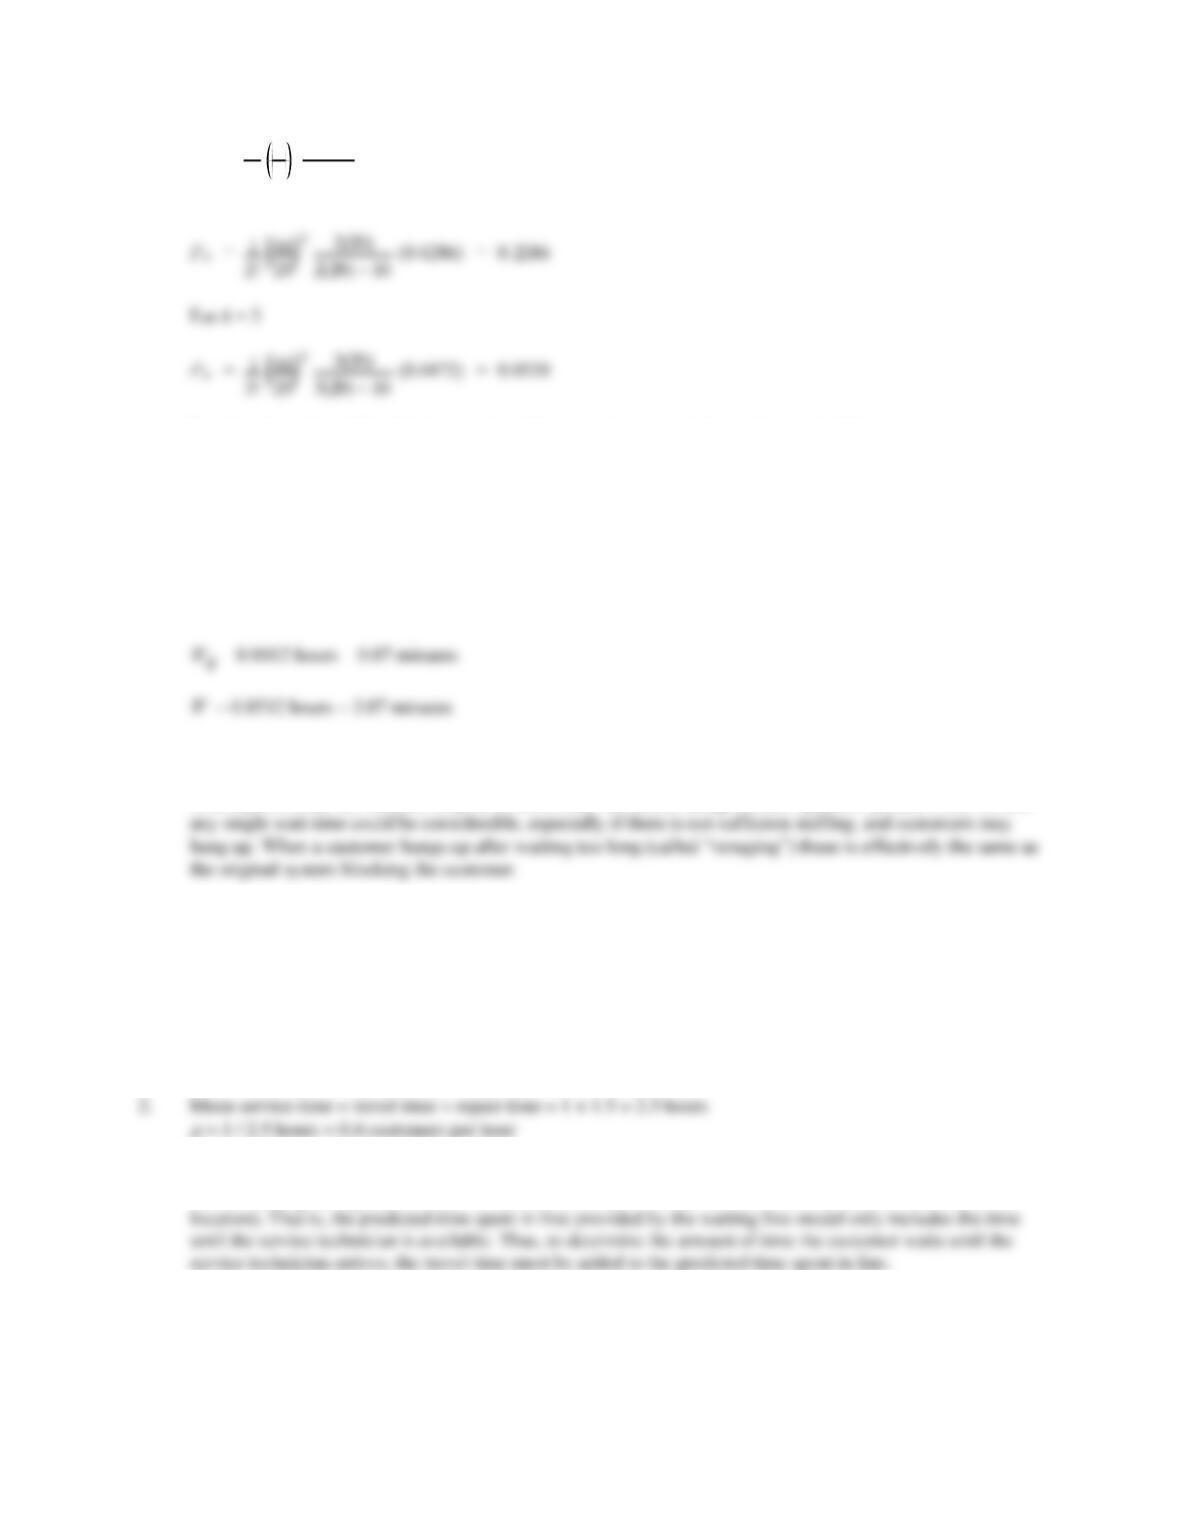
Computing Pw for k = 2 agents and k = 3 agents provides the following.
Chapter 15
P
w
=
1
k
!
k
k
k
–
P
0
For k = 2
Based on the value of Pw, 3 ticket agents will be required to meet the service goal. Other operating
characteristics of the 3-ticket-agent system are as follows:
P0 = 0.4472
Lq = 0.0189
L = 0.8189
3. The primary advantage of the expanded system that allows a caller to wait is that, with three ticket agents, the
average wait time will be short (less than 5 seconds), but in the current system these customers would have
been rejected (and the business may have been lost). The disadvantage of the expanded system would be that
4. We would need to know the arrival rate for each hourly period throughout the day. An analysis similar to the
one above would determine the recommended number of reservation agents each hour. This information
could then be used to develop full-time and part-time shift schedules which would meet the service goals.
Case Problem 2: Office Equipment, Inc.
1.
= 1 call/50 hours = 0.02 calls per hour
3. The travel time is 1 hour. While this is considered part of the service time it actually means that the customer
will be waiting during the first hour of the service time (while the service technician travels to the customer
4. Using the Excel worksheet template Finite, we have the following:
Probability that no customers are in the system 0.5380
Average number of customers waiting 0.2972
Waiting Line Models
Average number of customers in the system 0.7593
Average time a customer spends in the waiting line 1.6082 hours*
Average time until the machine is back in operation 4.1082 hours
Probability of a wait more than one hour 0.4620
Total cost per hour for the service operation $155.93
5. If the company continues to use one technician when the customer base expands to 20 customers, the average
time in the waiting line will increase to 6.9454 hours. With an average travel time of 1 hour, the average time
a customer waits until the service technician arrives will be 6.9454 + 1 = 7.9454 hours. The total cost will be
$397.78 per hour. This average total waiting time is too long and a second technician is definitely necessary.
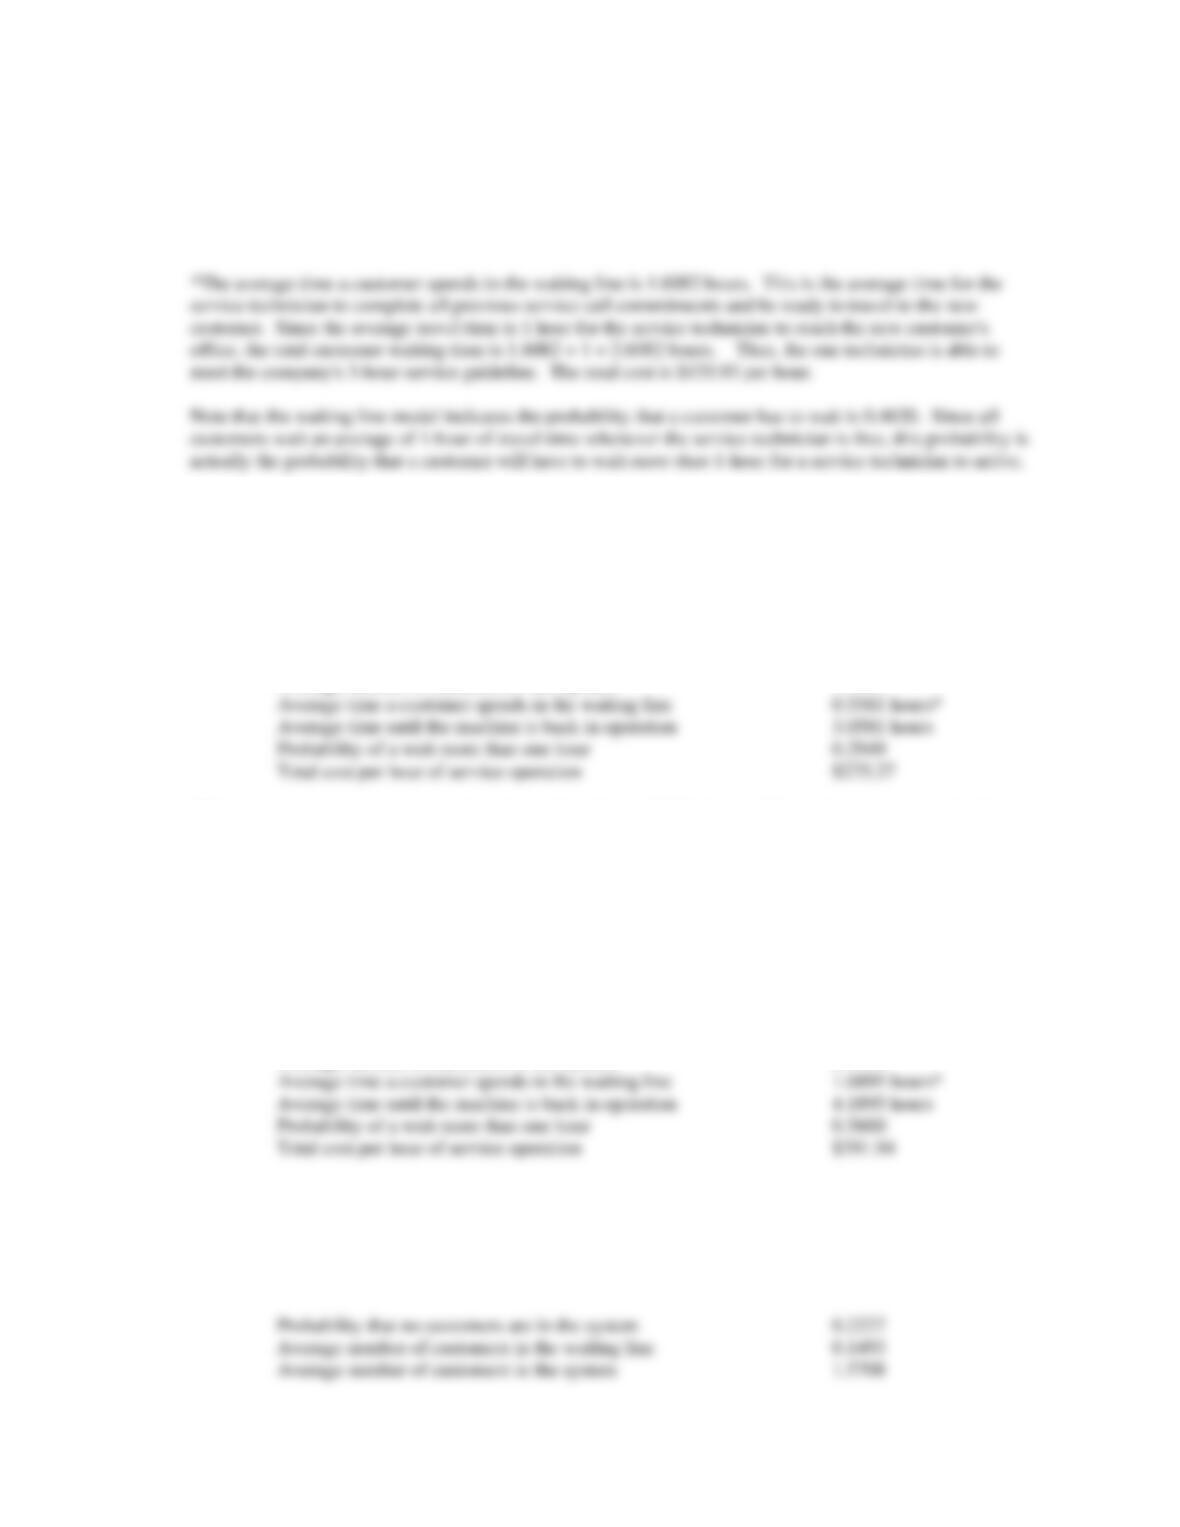
Using the Excel worksheet template Finite, two service technicians provide the following:
Probability that no customers are in the system 0.3525
Average number of customers in the waiting line 0.2104
*The average time a customer spends in the waiting line is 0.5581 hours. This is the average time for the
service technician to complete all previous service call commitments and be ready to travel to the new
customer. Since the average travel time is 1 hour for the service technician to reach the new customer’s
office, the total customer waiting time is 0.5581 + 1 = 1.5581 hours. Thus, two technicians are needed to
meet the company’s 3-hour service guideline when the company reaches 20 customers. The total cost is
$275.27 per hour.
6. Using the Excel worksheet template Finite, two service technicians provide the following:
Probability that no customers are in the system 0.1760
Average number of customers in the waiting line 0.9353
Average number of customers in the system 2.3194
*The average time a customer spends in the waiting line is 1.6895 hours. While the average travel time is 1-
hour for the service technician to reach the new customer’s office, the average total customer waiting time is
1.6895 + 1 = 2.6895 hours.
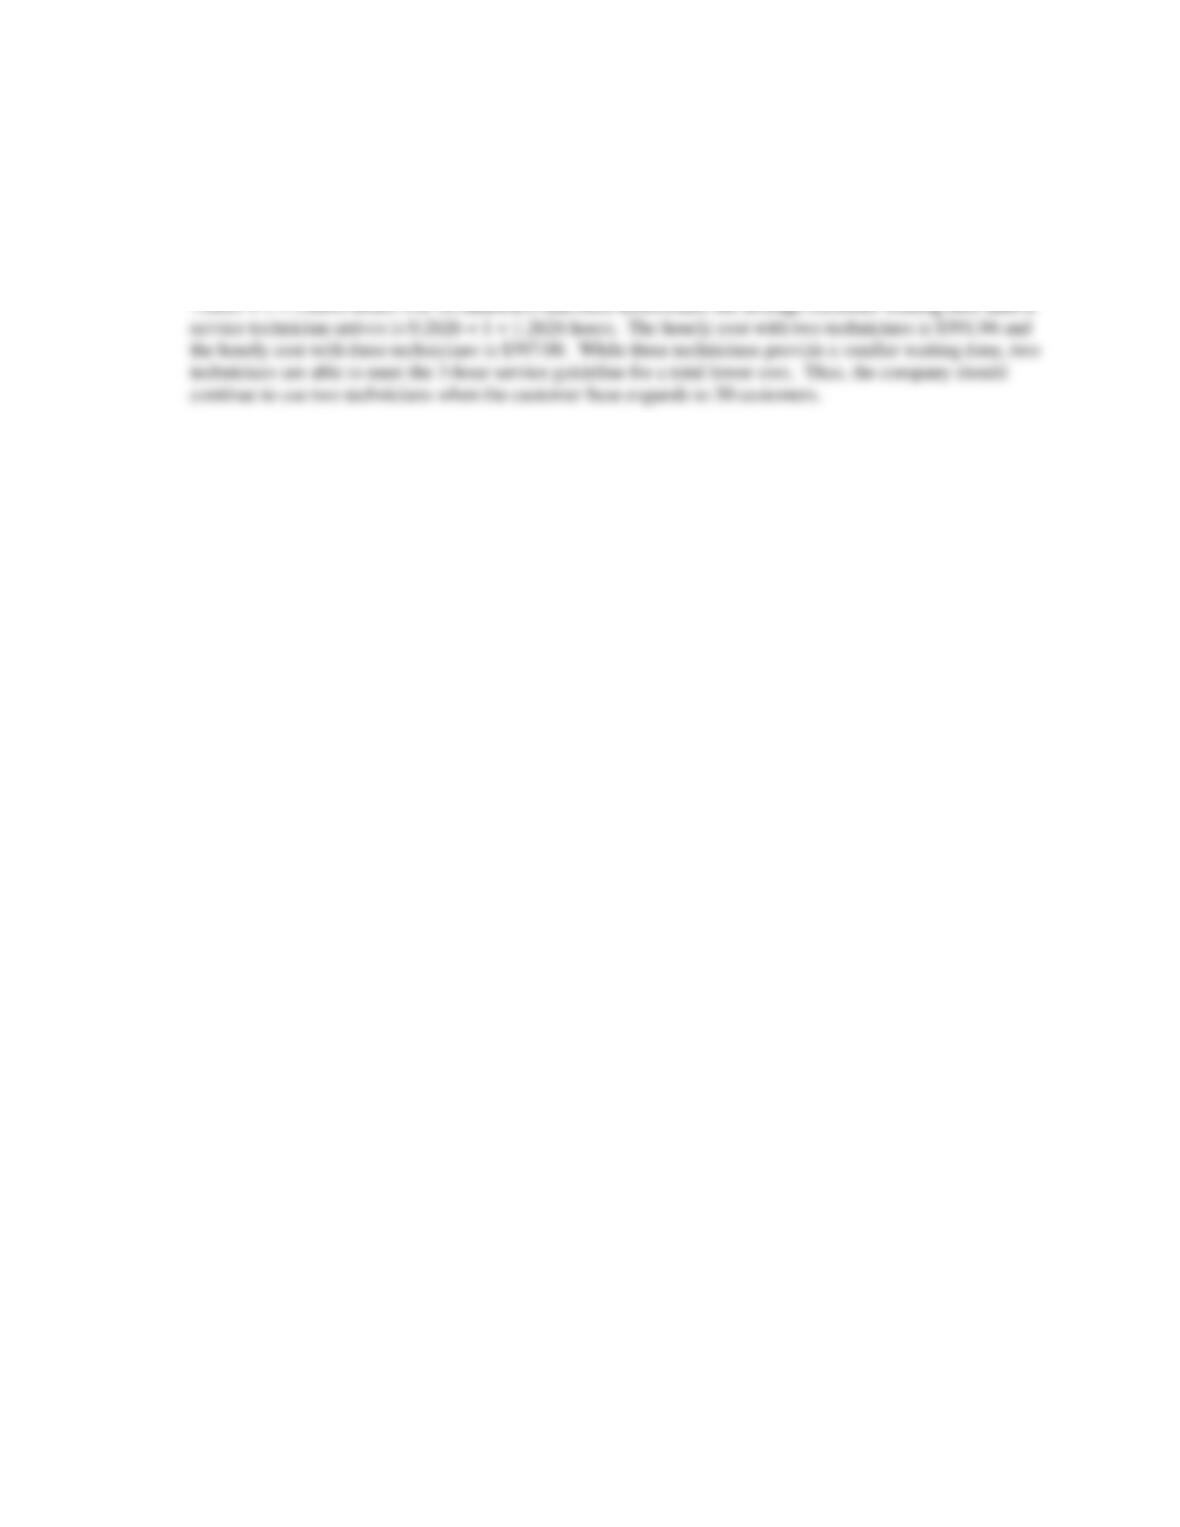
Using the Excel worksheet template Finite, three service technicians provide the following:
Chapter 15
Average time a customer spends in the waiting line 0.2626 hours*
Average time until the machine is back in operation 2.7626 hours
Probability of a wait more than one hour 0.2010
Total cost per hour of service operation $397.08
For 30 customers and two technicians, the average customer waiting time until a service technician arrives is
7. The OEI planning committee’s proposal anticipated that three technicians would be needed at a total cost of
$397.08 per hour. Thus, the recommendation to stay with two technicians has as annual savings of (397.08 –
391.94) x 8 hours/day x 250 days/year = $10,280.
17 – 1