Chapter 14
Project Planning and Acquisition
DISCUSSION QUESTIONS
14-1. Q: Which of the following would be considered a project: (a) construction of a hydroelectric
dam; (b) operation of a nuclear reactor; (c) development of an engine for the 8-2 bomber
through the first production prototype; (d) a production order for an additional twenty F-15
aircraft?
A: Certainly construction of a large dam and the design/development of a new jet engine are
14-2. Q: For a project-driven organization, with which you are familiar, describe the approach used
in advance of RFPs or bid requests to maintain competitiveness in being able to respond to
them.
14-3. Q: What would be some of the difficulties faced during the actual proposal preparation
process, and how can they be minimized?
A: The proposal team is the epitome of the “temporary organization,” pulled together very
14-4. Q: Describe what types of products or services each of the following contracts would be
appropriate for, and give an example for each: (a) firm fixed price; (b) cost plus fixed fee;
and (c) time and materials.
14-5. Q: Discuss how the management functions of planning, organizing, leading, and controlling
relate to the project process.
PROBLEMS
14-1. Q: Prepare (i) a milestone schedule and (ii) a work breakdown structure for one of the
following: (a) construction of a steel and concrete highway bridge, or (b) movement of the
printing department of a daily newspaper from one building to another (assuming two
identical presses, with one press continuously available for use).
14-2. Q: Establish tasks, times, and precedence relationships for the project selected in question
14-4, and draw (a) a bar chart and (b) a network diagram schedule for it.
A: Regardless of whether the bridge or the printing press project is chosen in problem 14-4
each student will create a different set of milestones and tasks, so no “book solution” is
14-3. Q: For the project outlined in the following table, prepare (a) a bar chart, (b) an arrow
network diagram, and (c) PDM network diagram. (d) What and how long is the critical path?
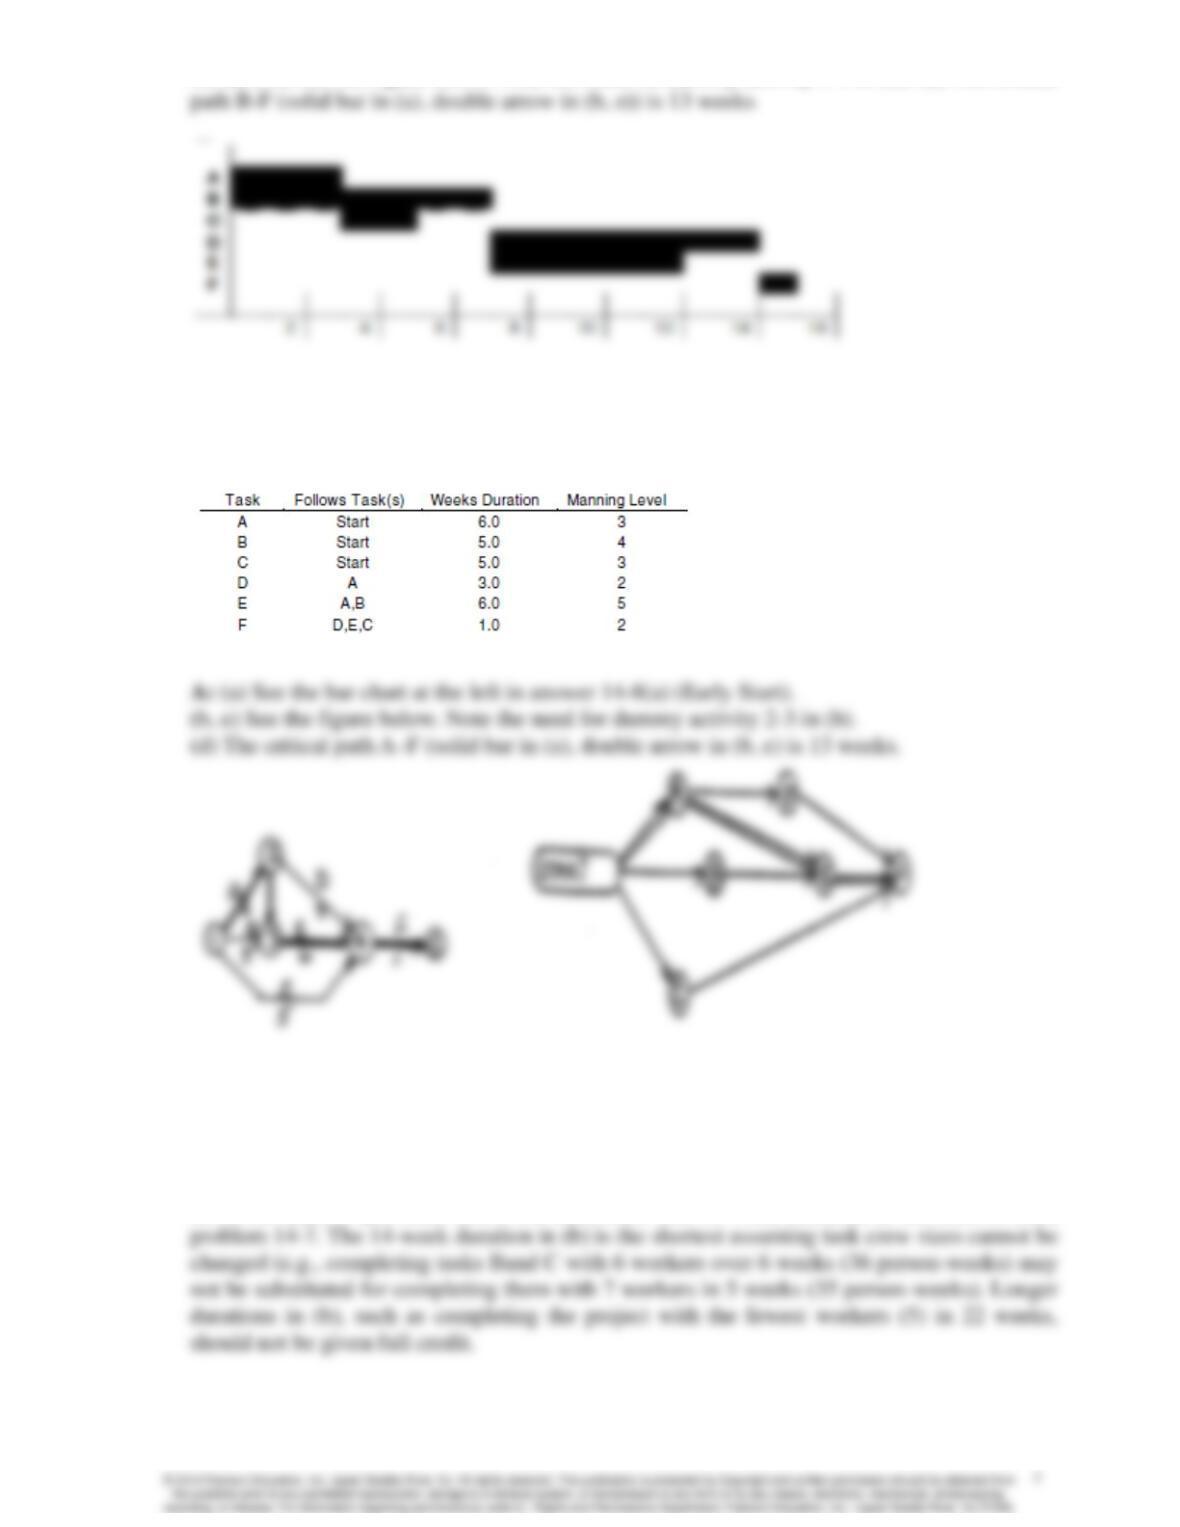
A: (a, b, e) See the figure below. Note the need for dummy activity 3-4 in (b). (d) The critical
14-4. Q: For the project outlined in the following table, prepare (a) a bar chart, (b) an arrow
network diagram, and (e) a circle (AON) network diagram. (d) What and how long is the
critical path?
A: (a) See the bar chart at the left in answer 14-8(a) (Early Start).
14-5. Q: For the project in question 14-7: (a) provide a worker-level profile assuming that all tasks
begin as early as possible; (b) repeat the profile assuming that no more than nine people are
available in any week and the manning level for a task cannot change; and (c) identify the
project duration in each case.
A: A bar chart is provided below for each case. The 13-week duration in (a) follows from
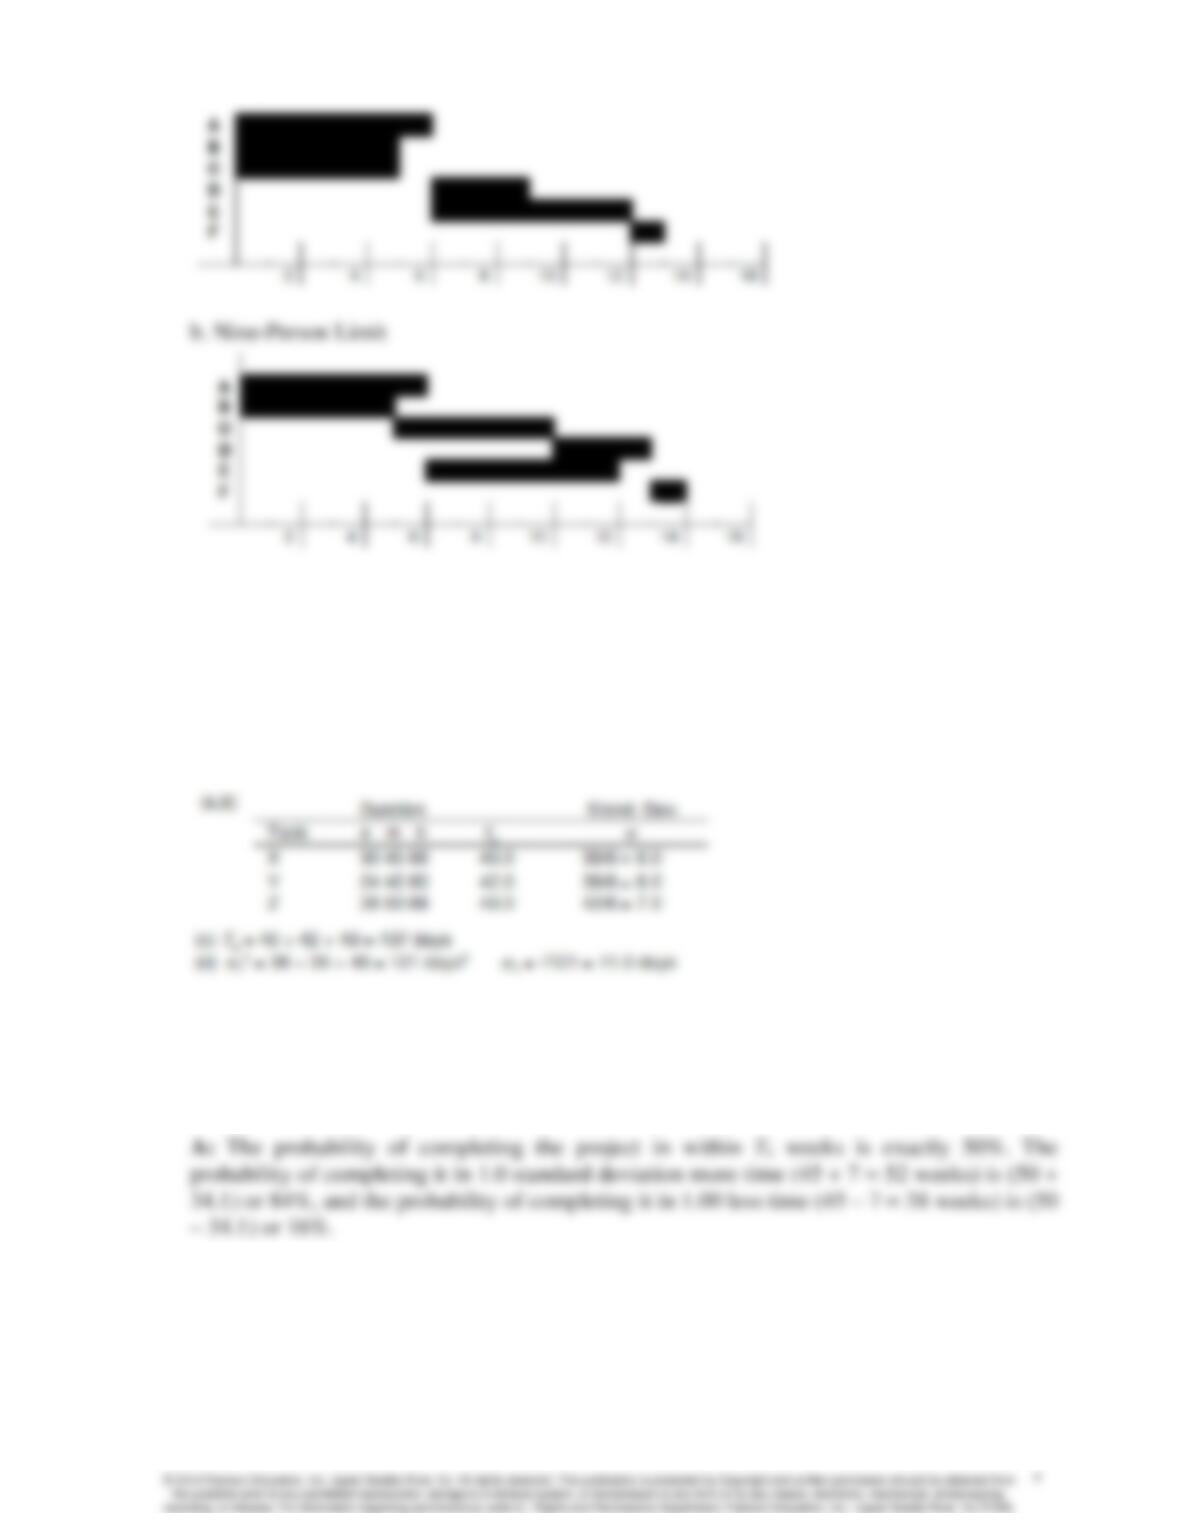
a. Early Start
14-6. Q: Tasks X, Y, and Z must be completed in series to complete a project. The three time
estimates (a, m, and b) for each task in days are: X: 30, 45, and 66 days; Y: 24, 42, and 60
days; and Z: 26, 50, and 68 days. For each task calculate (a) the expected time Te and (b) the
standard deviation 0. What is the (c) expected time Te and (d) the standard deviation 0T for
the complete project?
A: Calculation is as follows:
14-7. Q: If a project has an expected time of completion Te of 45 weeks with a standard deviation
of 7 weeks, what is the probability of completing it within one year (52 weeks)? Within 38
weeks?
A: The probability of completing the project in within Te weeks is exactly 50%. The
14-8. Q: Tasks A, B, and C must be completed in series to complete a project. The three time
estimates (a, m, and b) for each task in weeks are: A: 8, 11, and 14 weeks; B: 7, 10, and 19
weeks; and C: 10, 19, and 22 weeks. For each task calculate (a) the expected time Te and (b)
the standard deviation . What is the (c) expected time Te and (d) the standard deviation a T
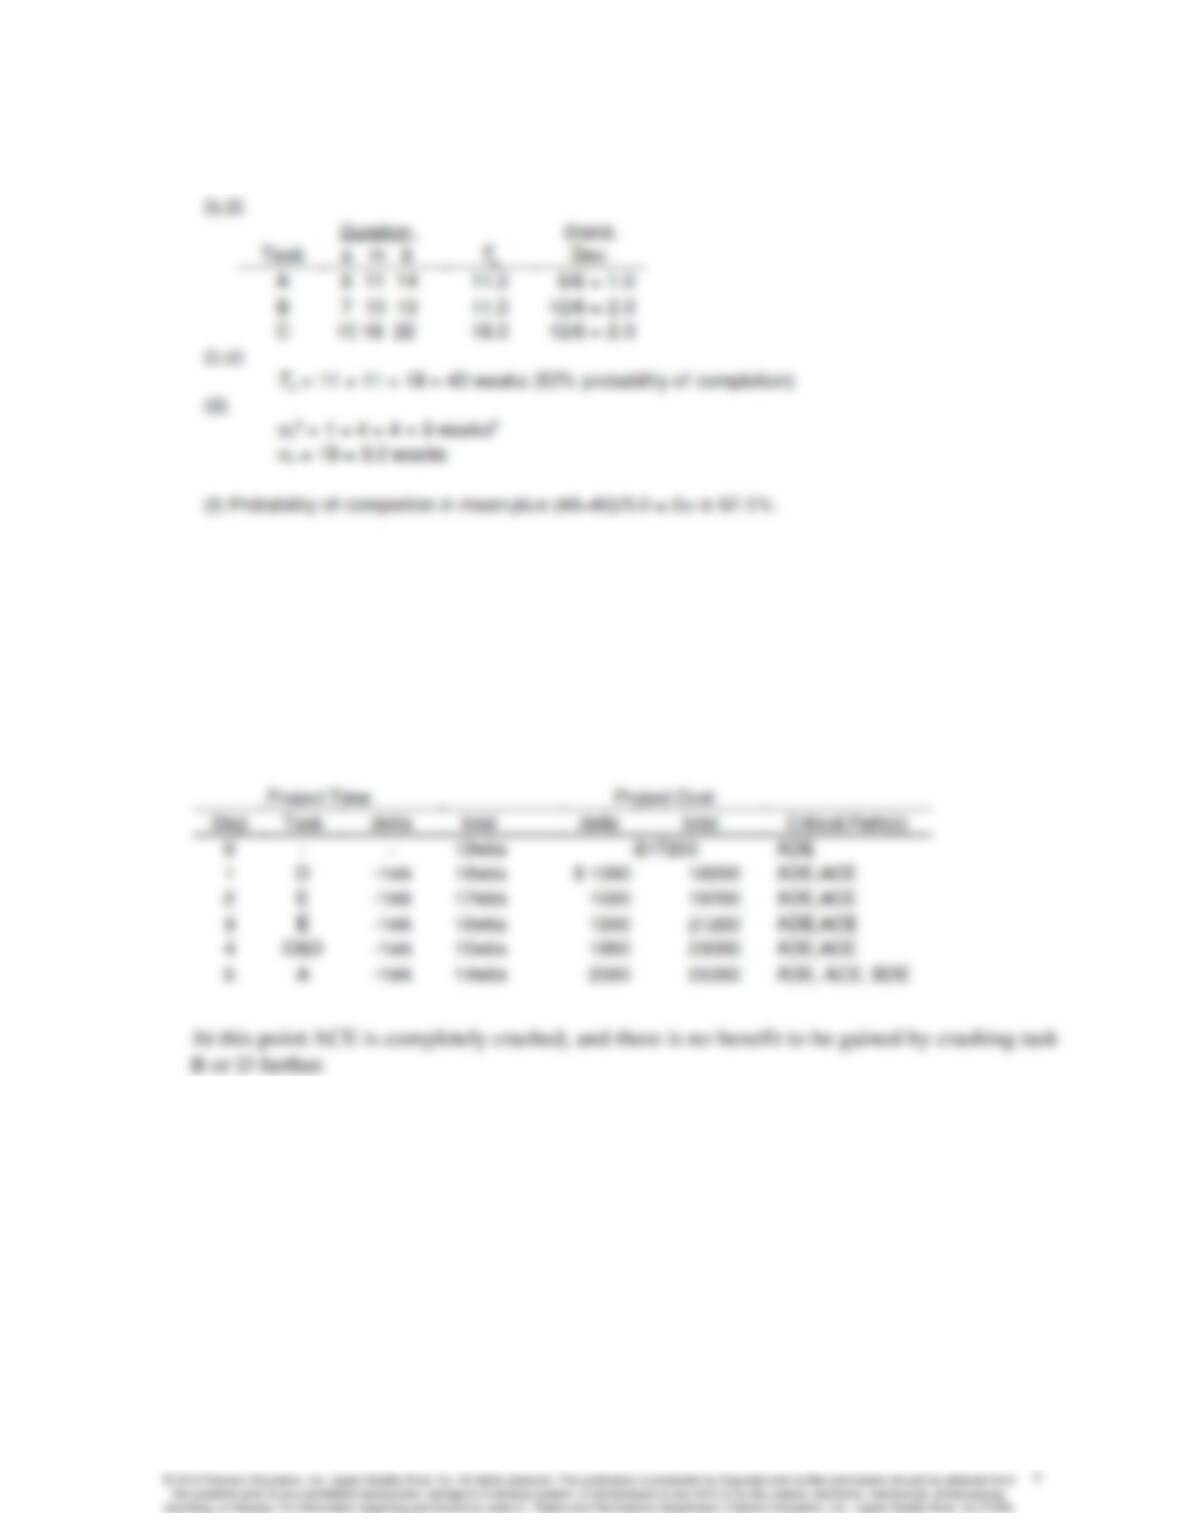
for the complete project? What is the probability of completing the project (e) in 40 weeks?
(f) In 46 weeks?
A: Calculation is as follows:
14-9: Q: The text shows how to reduce to duration of the project shown in Figure 14-14 from 19 to
18 to 17 weeks at the lowest cost. Continue this process, showing the most economical way
to reduce project duration from 17 weeks, week by week, to the minimum possible duration.
What is the minimum project total cost at this minimum duration?
A: Following are the optimum steps (of which 1 and 2 are in the text):
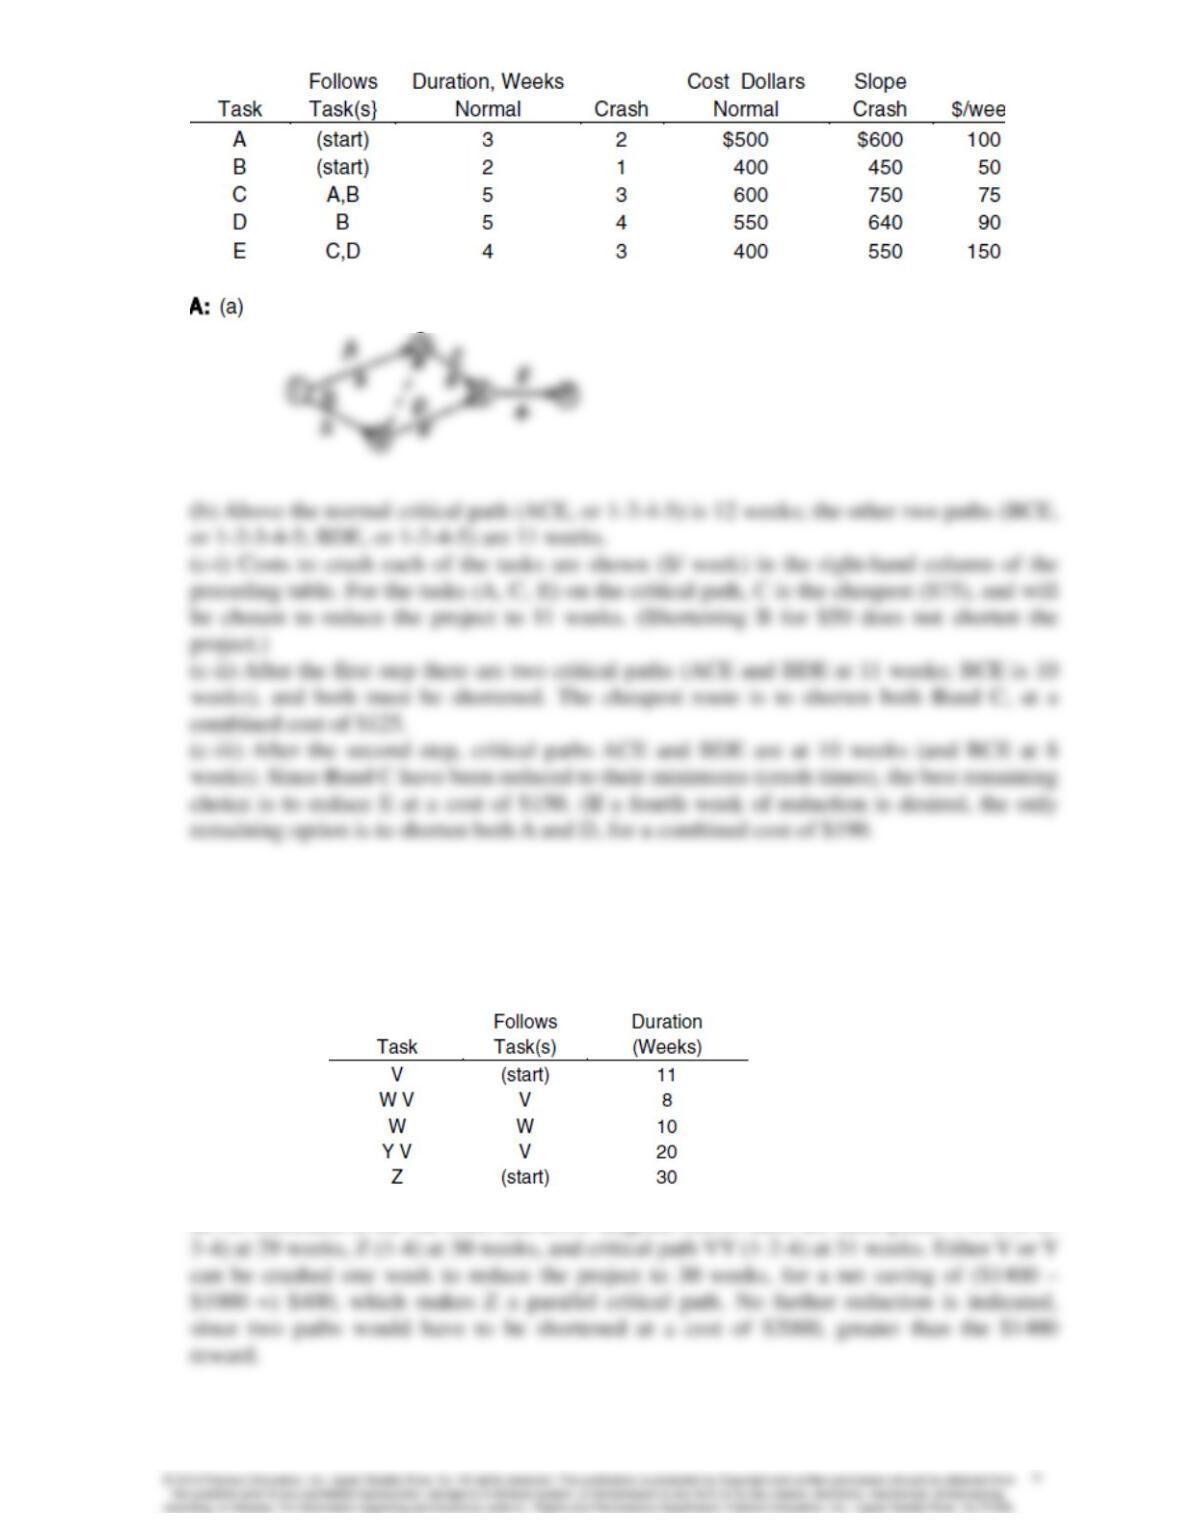
14-10. Q: For the project outlined on the following table, (a) draw a network diagram (arrow or
AON, as preferred), and (b) identify the critical path and duration. (c) Identify the task(s) you
would crash and the incremental cost to reduce project duration by (i) one week; (ii) a second
week; (iii) a third week.
14-11: Q: The following project carries a penalty cost of $200/day ($1400/week) for any delay in
completion beyond 26 weeks. Any task can be accelerated by up to three weeks at a cost of
$1000 per week reduction. Draw an arrow diagram, identify the critical path and duration,
and determine which task(s), if any, you will crash, and by how much, to minimize project
cost.
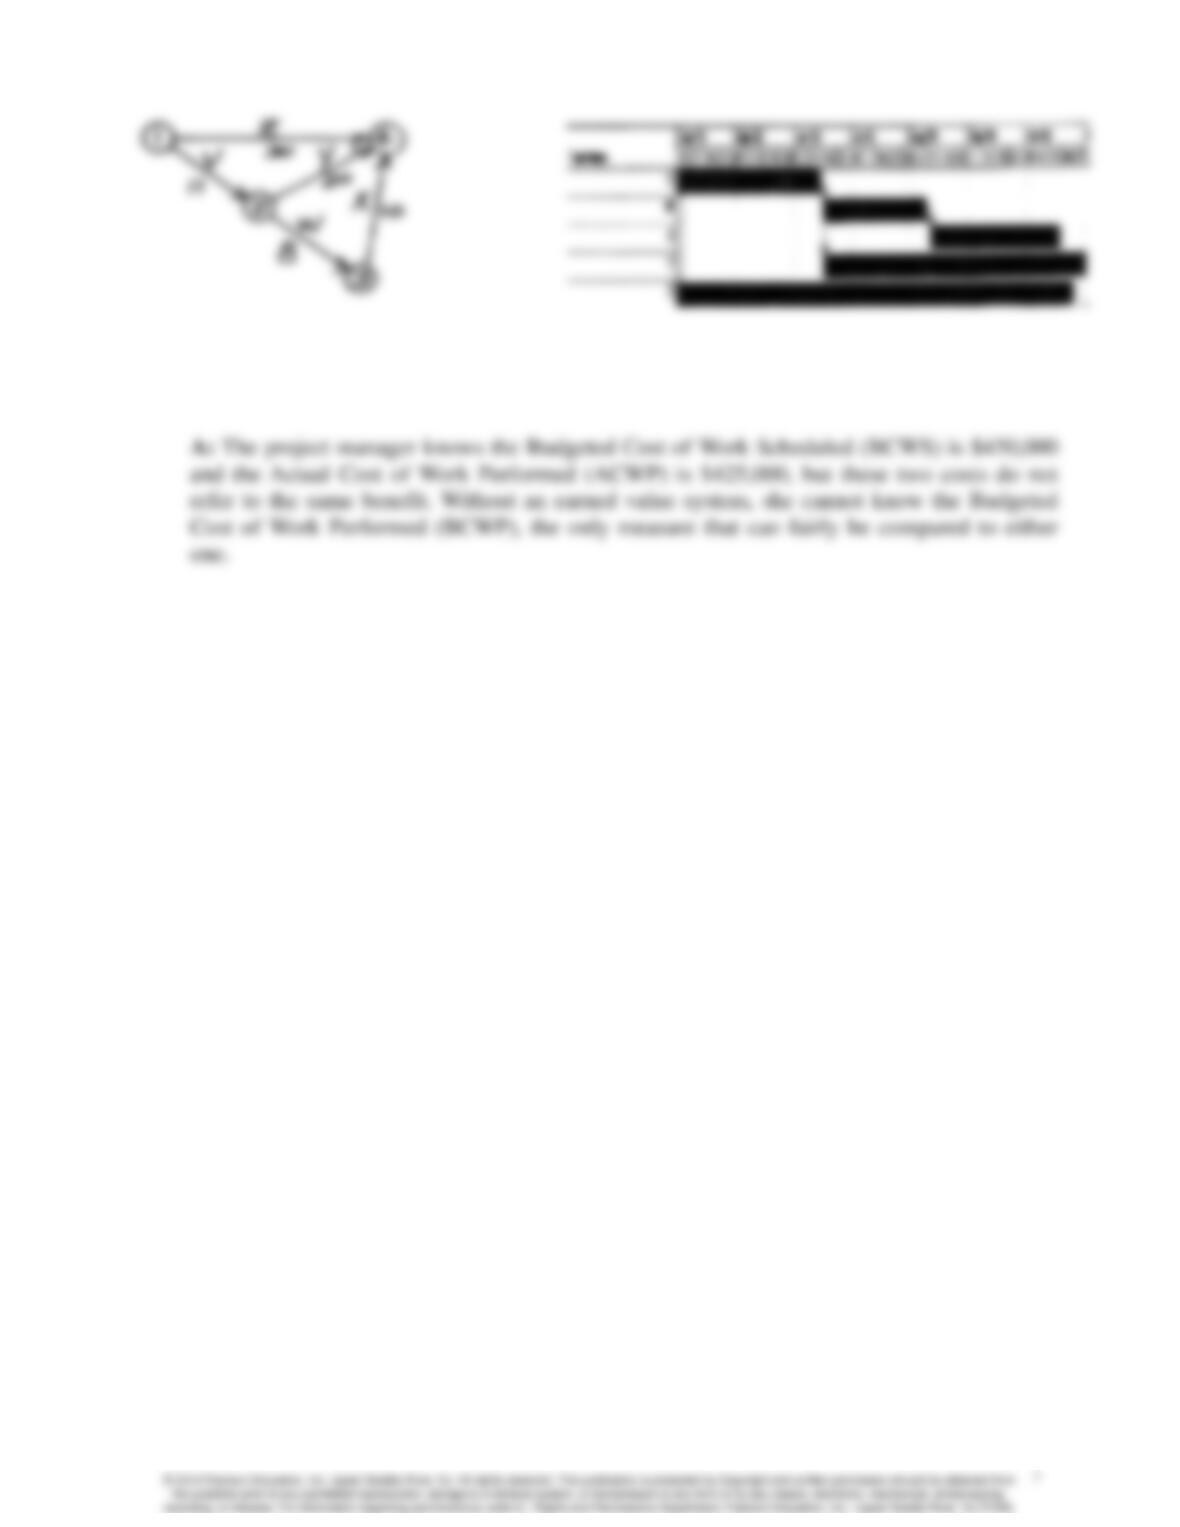
A: As illustrated in the bar chart and arrow diagram below, there are three paths: VWX (1-2-
14-12: Q: A project manager observes that she had budgeted expenditure of $450,000 by a specific
date and had only spent $425,000 by then. What should she conclude?