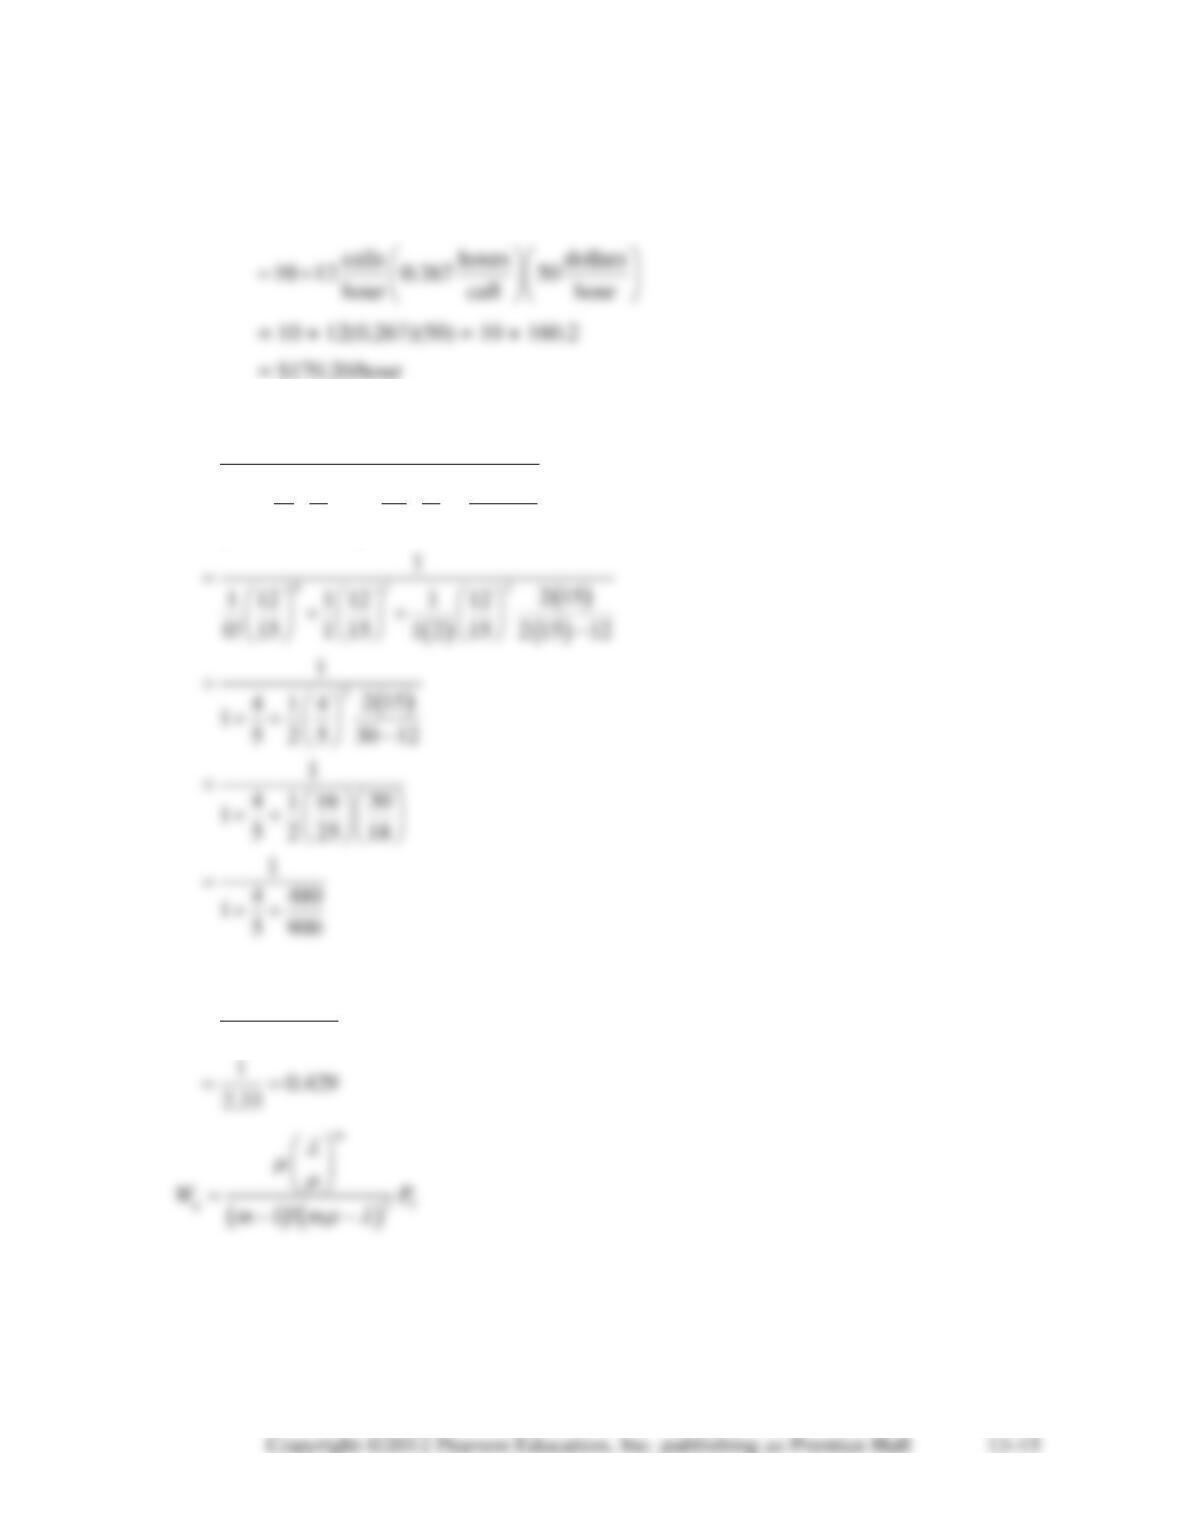
c. To decide whether or not to add the second clerk, we must (a) compute present total cost,
(b) compute total cost with the second clerk, and (c) compare the two. Present total cost:
Ct/hour = service cost + waiting cost
To determine total cost using the second clerk (a second channel):
01
0
1
11
!!
nm
nm
n
P
m
n m m
−−
=
=
+
−
or
0
1
1 0.8 0.53
P=++
Then
( ) ( ) ( )
2
2
12
15 15 0.429
2 1 2 15 12
q
W
=−−
Cost with two clerks:
Ct/hour = service cost + waiting cost
There is a savings of $170.20 – $27.62 = $142.5/hour. Thus a second clerk should certainly be
added!
13-17. This is an M/M/1 system with
= 24 per hour and
= 30 per hour.
a. W = 0.167 hour
b. L = 4
c. Wq = 0.133
13-18. This is an M/M/2 system with
= 24 per hour and
= 30 per hour. Using QM for
Windows we get the following:
a. W = 0.0397 hours
b. L = 0.9524
13-19 and 13-20.
NUMBER OF FRUIT
LOADERS
1
2
Truck arrival rate (
)
3/hour
3/hour
Loading rate (
Average number in system (L)
3 trucks
0.6 truck
Average time in system (W)
1 hour
0.2 hour
Average number in queue (Lq)
2.25 trucks
0.225 truck
3
4
hour
Utilization rate (
)
0.75
0.375
Probability system
0.25
0.625
empty (P0)
Probability of more
than k trucks in
0
0.75
0.375
System
1
0.56
0.141
2
0.42
0.053
3
0.32
0.020
These results indicate that when only one loader is employed, the average truck must wait
3
4
hour before it is loaded. Furthermore, on average, 2.25 trucks are waiting in line to be loaded.
This situation may be unacceptable to management. Note the decline in the queue when a second
loader is employed.
13-21. Referring to the data in Problems 13-19 and 13-20, we note that the average number of
trucks in the system is 3 when there is only one loader and 0.6 when two loaders are employed.
NUMBER OF LOADERS
1
2
Truck driver idle time costs
(= average number
trucks × hourly
rate) (3)($10)
= $30
$6 = (0.6)($10)
Loading costs
12 = (2)($6)
Total expected cost per hour
13-22.
( )
( )
02
1
0
1
24
1 3 1 3
! 4 2! 4 2 4 3
n
n
P
n
=
=
+
−
0.873 0.291
3
W==
hour
3
0.873 0.123
4
q
L= − =
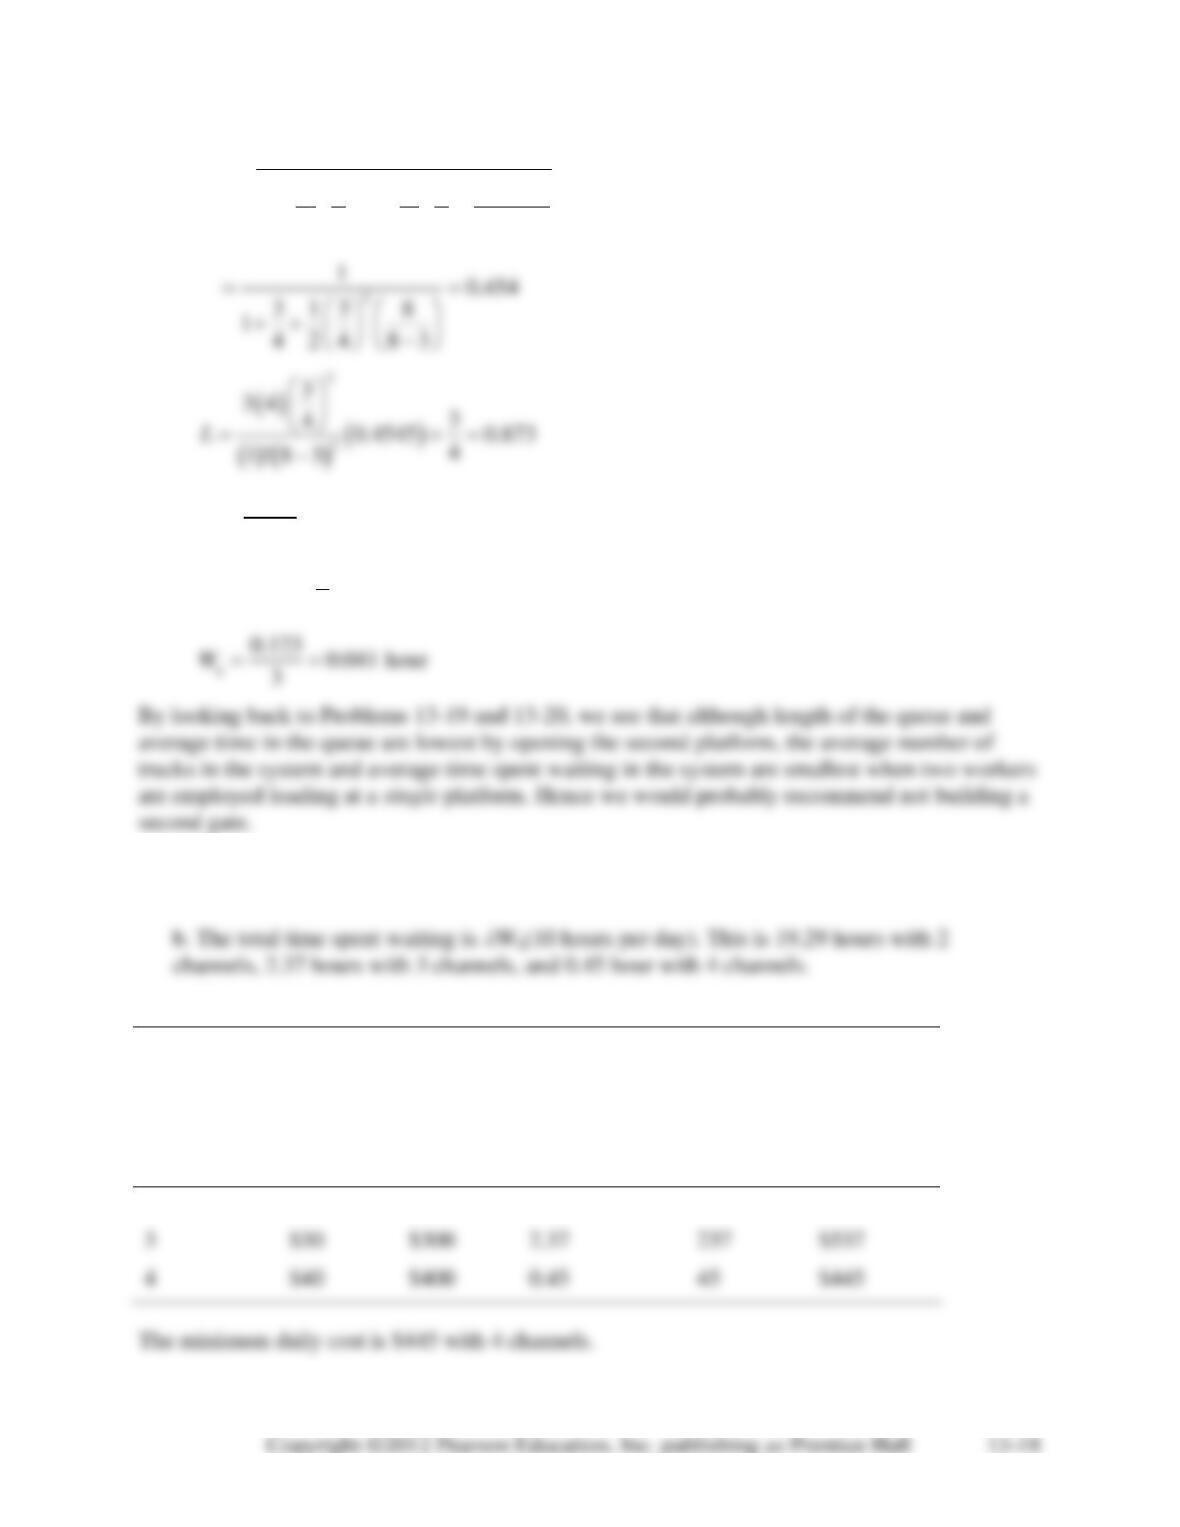
13-23. The queuing systems in this problem are the M/M/2, M/M/3, and the M/M/4 systems.
a. Wq = 0.0643 for 2 channels; Wq = 0.0079 for 3 channels; Wq = 0.0015 for 4 channels;
c. The total daily waiting time cost is given in the table below:
# Channels
Service
cost per
hour
Service
cost per
day
Total waiting
time =
Wq(10hr.)
Total
waiting
cost
Total cost
2
$20
$200
19.29
$1929
$2129
13-24. This is an M/M/1 system with
= 10 per hour and
= 15 per hour.
a. Wq = 0.1333 hour
3-25. This is an M/M/2 system with
= 10 per hour and
= 15 per hour.
a. Wq = 0.0083 hour
13-26. a.
(8 hours per day) = 10(8) = 80 customers per day
b. Total time spent waiting = Wq(number of customers) = 0.1333(80) = 10.66 hours.
13-27. This is an M/D/1 system with
= 4 per hour and
= 6 per hour.
a. Average number in line = 0.666
b. Average number in system = 1.333
c. Average wait in line = 0.1666 minute = 10 seconds
13-28. For M = 1:
( ) ( )
2
00
22
1
L P P
= + = +
−−
This is the same formula.
13-29.
1
0.1667 / day / day
6
==
= 1/day
a. Number in queue =
( ) ( )
0
1 5 7 1 0.36
q
L N P
+
= − − = − −
= 3.84
d. Average time in queue =
( ) ( )( )
0.52 0.817
5 1.16 0.1667
q
q
L
WNL
= = =
−−
day
13-30.
60 0.706 / hour, 0.1765
85
= = =
= 4/hour, N = 5, n = 1
a. Average number waiting = Lq
( )
( )
0
1
4.706
5 0.664 5 4.424 0.576
0.706
NP
+
= − −
= − = − =
e. Average time in system
1
q
WW
= = +
= 0.217 + 0.25
= 0.467 hour
13-31. a. Entering:
= 84/minute,
= 30/minute,
= 2.8
Exiting:
= 48/minute,
= 30/minute,
= 1.6
The manager desires that Wq 0.1 minute = 6 seconds and that Lq 8 customers in queue.
Entering:
If M = 3, Lq = 12.27 and Wq = 0.14 minute (too high)
If M = 3, Lq = 0.31, Wq = 0.006 minute (also okay)
So the manager must open M = 2 or more exits. Since there are only 6 turnstiles, 4 must be used
as entrances and 2 as exits.
b. The students should recognize and question all the limiting queuing assumptions that have
been applied in solving the case. For example, it may be reasonable to assume that arrivals at
the entrance turnstiles are independent and Poisson. But are exiting passengers independent?
13-32. This is an M/M/1 system with
= 12 per hour and
= 15 per hour.
a. Wq = 0.27 hour
13-33. This is an M/M/2 system with
= 12 per hour and
= 15 per hour.
a. Wq = 0.013 hour
SOLUTIONS TO INTERNET HOMEWORK PROBLEMS
13-34.
= 12/hour;
= 4/hour/barber; M = 4 channels
a. P0 = 0.0377 = 3.8% (from formula)
f.
= 0.75 = 75%
g.
with m = 5 barbers drops to 60%
13-35. a. 9 A.M.–3 P.M.;
= 6 patients/hour;
= 5 patients/hour/doctor
61.20
= = =
40.80
5
==
Wq 0.0833 hour implies that or
Lq
0.0833 or Lq 0.0833 or
Lq
1.00. m = 4 doctors are needed.
13-36. a. = 1 per minute and
= 2 per minute
b. M/M/1
c.
=
1
2
1
2
= 0.5. The cashier is busy 50% of the time.
13-37. a.
= 3 per minute and
= 4 per minute
b. M/M/1
e. Lq = 2.25
f. Wq = 0.75 minute
13-38. This is an M/M/2 system with
= 3 per minute and
= 4 per minute. Solving with QM
for Windows we obtain the following:
a. Lq = 0.1227
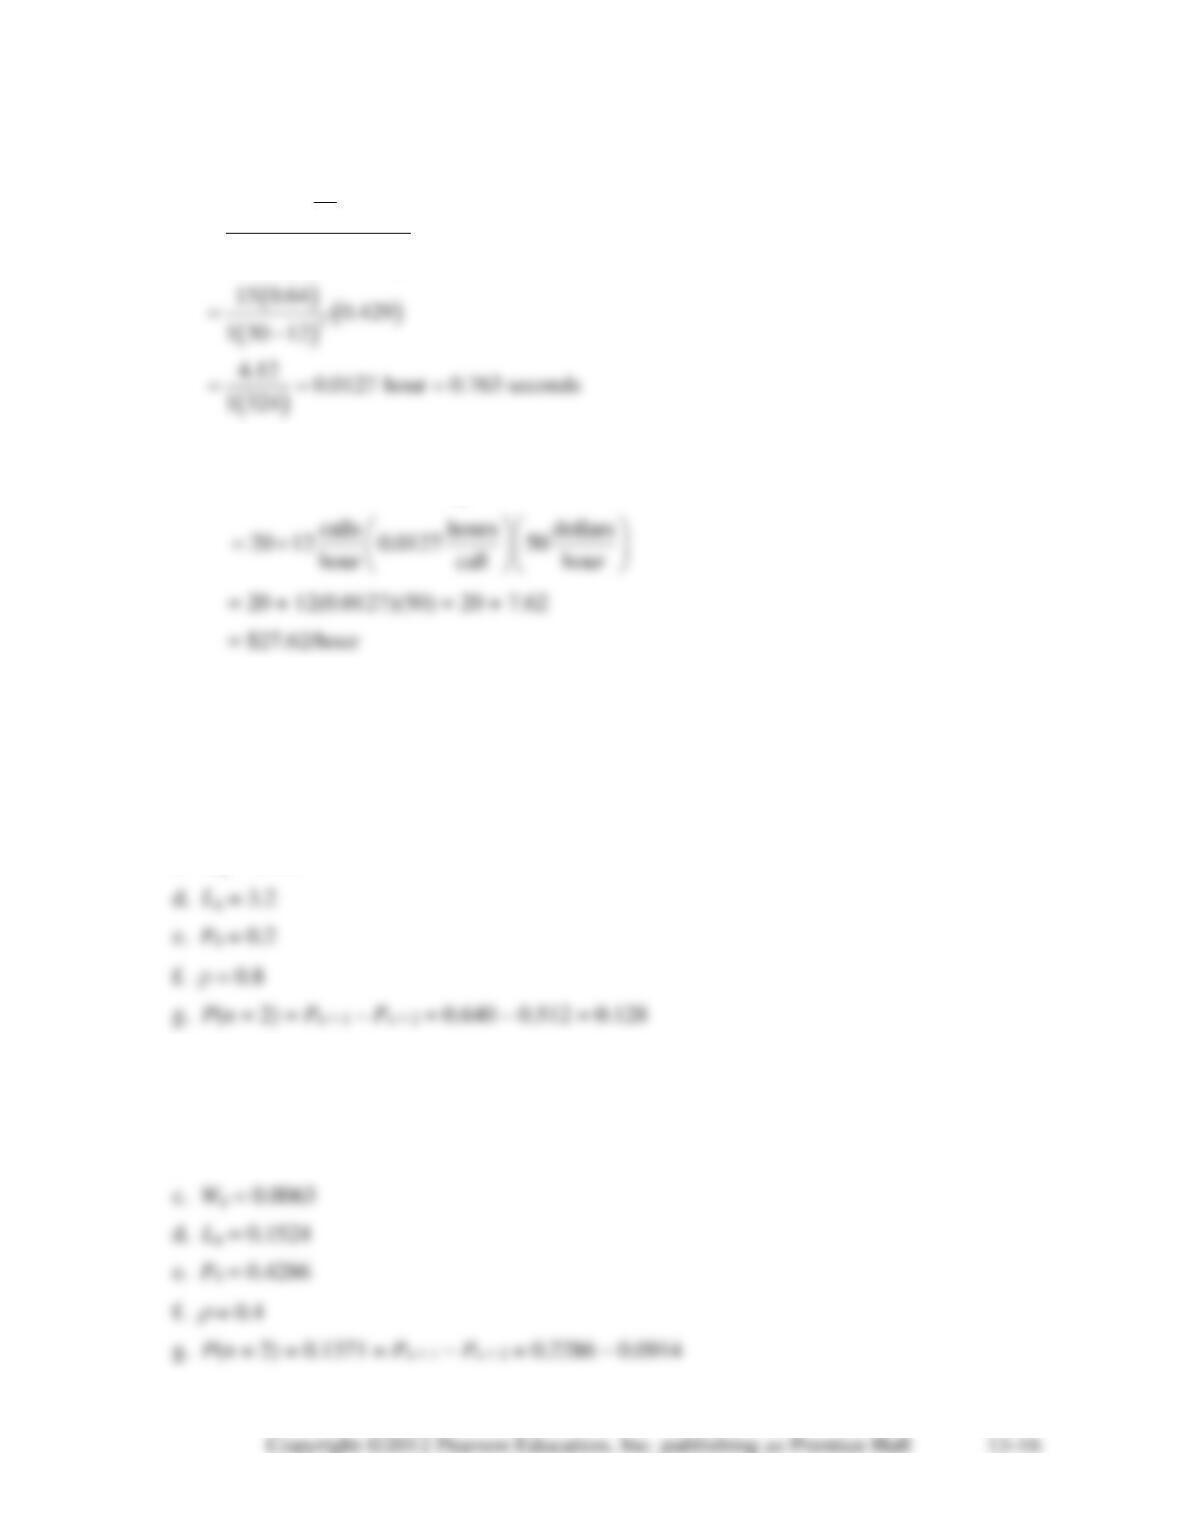
SOLUTION TO NEW ENGLAND FOUNDRY CASE
1. To determine how much time the new layout would save, the present system must be
compared to the new system. The amount of time that an employee spends traveling to the
maintenance department added to the time that he or she spends in the system being serviced and
waiting for service presently, compared to this value under the proposed system, will give the
savings in time.
In this case
( ) ( )
( )
012
10.18
25
1 1 7 1 7
1
1 1 5 2 5 5 2 7
P==
++
−
Therefore,
( )
( ) ( )
2
2
5 7 / 5 0.18 1/ 5
1 10 7
W=+
−
= 0.396 hour, or 23 minutes and 45 seconds
Added to the travel times involved (6 minutes total for maintenance personnel and 2 minutes
total for molding personnel), the total trip takes:
The reduced travel time is equal to 2 minutes, making the total trip time equal to 32 minutes.
This is an increase in time of 2 minutes and 15 seconds for the maintenance personnel.
Pete can now service 7 people per hour (
= 7). Three people arrive from the molding
department every hour (
= 3). The time in Pete’s department is
The travel time is equal to 2 minutes, making the total trip time equal to 17 minutes. This is a
decrease in time of 8 minutes and 45 seconds per trip for the molding personnel.
2. To evaluate systemwide savings, the times must be monetized. For the maintenance personnel
who are paid $9.50 per hour, the
214
minutes lost per trip costs the company 36 cents per trip
214
SOLUTION TO WINTER PARK HOTEL CASE
1. Which of the two plans appears to be better? The current system has five clerks each with his
or her own waiting line. This can be treated as five independent queues each with an arrival time
of
= 90/5 = 18 per hour. The service rate is one every 3 minutes, or
= 20 per hour. Assuming
Poisson arrivals and exponential service times, the average amount of time that a guest spends
waiting and checking in is given by
A single waiting line for the five clerks yields an M/M/5 queue with
= 90 per hour,
= 20
per hour. The calculation of average time in the system gives W = 7.6 minutes. This plan is
clearly faster.
INTERNET CASE STUDY
Pantry Shopper
Beth wants to get a general idea of the system behavior. She first will need to decide whether she
is interested in time waiting or time in system. Some students may use system time, but since
most shoppers are relieved when it is their turn, we use waiting time as our measure. For all of
our analyses, we use current service times, even though a UPC reader is going to be installed.
This means that our waiting times are an upper bound for the new, better system (the M/M/s
model).
This means that the average service rate is 60/3.6 = 16.67 customers per hour. Notice that this is
not the same as taking 20 percent of the rate of 30 and 80 percent of the rate of 15, which would
equal 18 and would be wrong.
Using an arrival rate of 100 and a service rate of 16.67, the minimum number of servers is 6.
(This is due to round off.) In reality, the minimum number is 7, and the average waiting time is
2.2 minutes. Trying one more server leads to a waiting time of .64 minutes.
If Beth uses 7 servers, they will be split this way: 6 in regular lanes and 1 in an express lane.
If Beth uses 8 servers, a 6–2 split between regular lanes and express lanes yields an average wait
of
(0.2)(0.25) + (0.8)(4.28) = 0.05 + 3.424 = 3.47 min.
A 7–1 split yields an average of