
Instructor’s Manual
12-1
CHAPTER TWELVE
Financial Statement Analysis
This chapter examines financial statement analysis. In particular, it
Key Concepts
• Ratio analysis provides additional information that enhances the
decision-making ability of the users of the information.
• Rather than focus on a single ratio, decision makers need to evaluate
• Solvency ratios assess the extent to which a company must borrow
money to operate the business and the amount of interest paid on that
money.
• Profitability ratios provide measures of how effectively a company is
using its assets.
Learning Objectives
LO1— Explain why decision makers analyze financial statements and recognize
the limitations of financial statement analysis.

Instructor’s Manual
LO4— Prepare and use liquidity ratios to analyze a company.
Lecture Outline
A. Introduction
Users of accounting information, both external and internal, need a variety
of information for decision making. Financial statement analysis is a useful
tool for both external and internal users as they make decisions about a
company or for a company.
B. Why Analyze Financial Statements? (LO1)
1. The most compelling reason to analyze financial statements is
simply that it provides useful information to supplement information
2. Limitations of Financial Statement Analysis
o Financial statements are prepared based on a variety of
methods, estimates, and assumptions. If these methods,
3. The Impact of Inflation on Financial Statement Analysis

Instructor’s Manual
12-3
Financial statements are prepared by using historical costs and are
not adjusted for the effects of increasing prices and thus may fail to
depict the real picture.
C. Horizontal Analysis (LO2)
Analyzing financial statements over time is called horizontal analysis.
1. Horizontal analysis of financial statements can and should include
more than just 2 years of data. Many annual reports include, as
2. Decision makers can use trend analysis to build prediction models
to forecast financial performance in the future. Trend analysis can
D. Vertical Analysis (LO3)
Vertical analysis compares financial statements of different companies and
financial statements of the same company across time after controlling for
Key Concept
Key Concept
Rather than focus on a single ratio, decision makers need to evaluate a
Instructor’s Manual
12-4
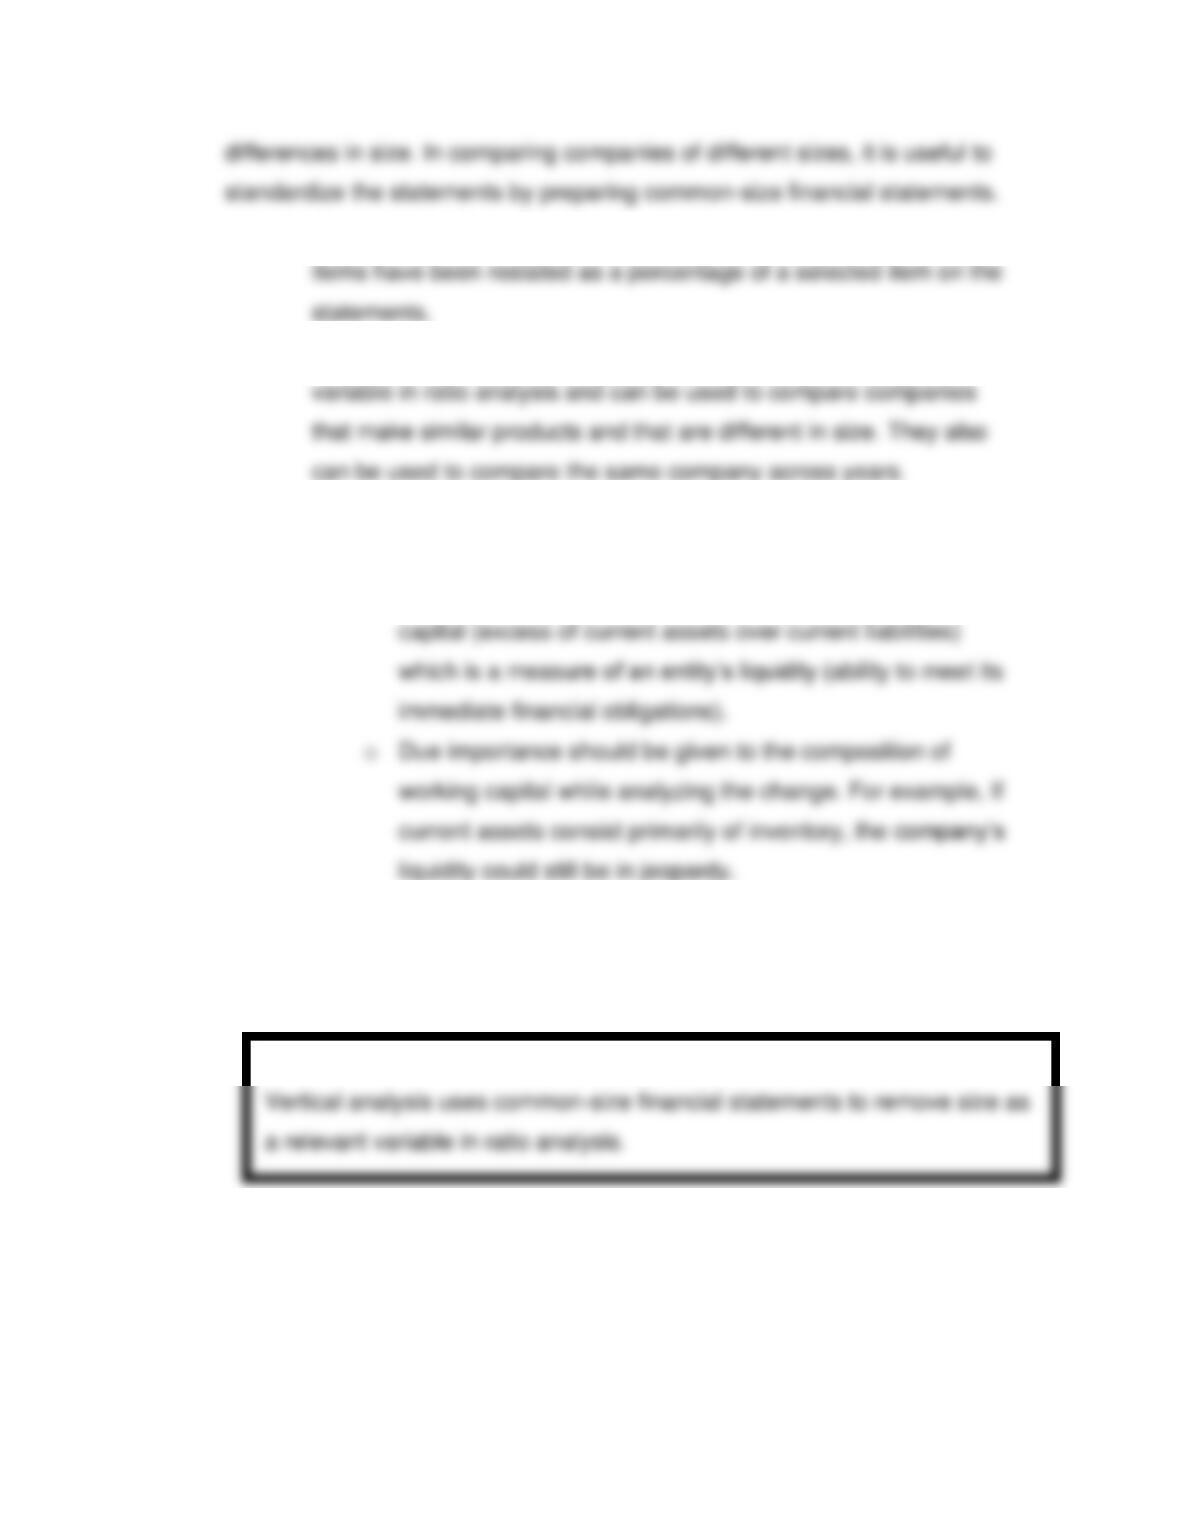
1. Common-size financial statements are statements in which all
2. Common-size financial statements remove size as a relevant
3. When comparing across years, analysts and other decision makers
look for critical changes in the composition of accounts.
o One important measure from the balance sheet is working
4. An important use of common-size financial statements is to
compare companies that are in similar lines of business but are of
different sizes.
E. Ratio Analysis—Liquidity Ratios (LO4)
1. Current Ratio
Key Concept

Instructor’s Manual
The current ratio, or working capital ratio, is a measure of an
entity’s liquidity. The formula for the current ratio is as follows:
o If a company has a current ratio of 2.5, the company has
$2.5 of current assets for every dollar of current liabilities.
o Although high current ratios would appear to be good, a
2. Quick Ratio
One way to reduce the concern over the composition of the current
accounts when computing the current ratio is to use the quick ratio,
or acid-test ratio. The quick ratio removes inventories and prepaid
o If a company has a quick ratio of 2, the company has $2 of
quick assets for every dollar of current liabilities.
Key Formula
Key Formula
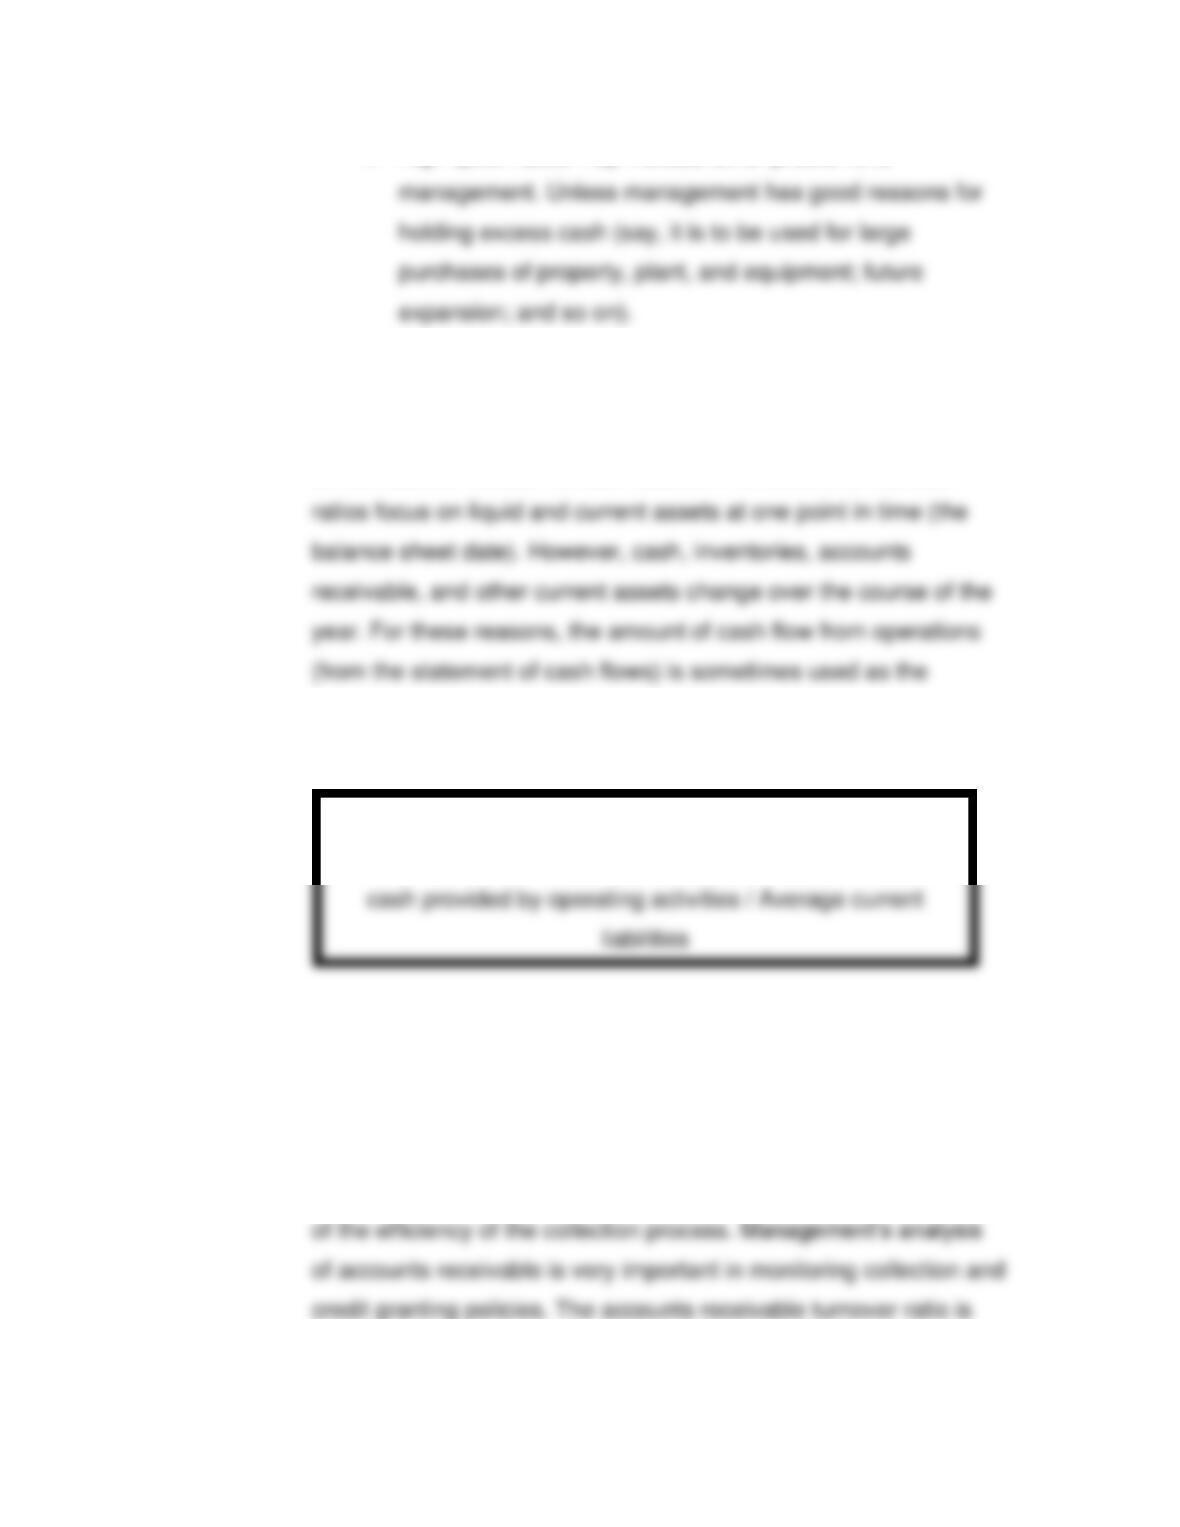
Quick ratio = Quick assets / Current liabilities
Instructor’s Manual
12-6
o High quick ratios may indicate other problems to
3. Ratio of Cash Flow from Operations to Current Liabilities
The current ratio and the quick ratio have two major weaknesses.
The first is that all debt payments are made with cash, whereas
current assets include noncash assets. The second is that both
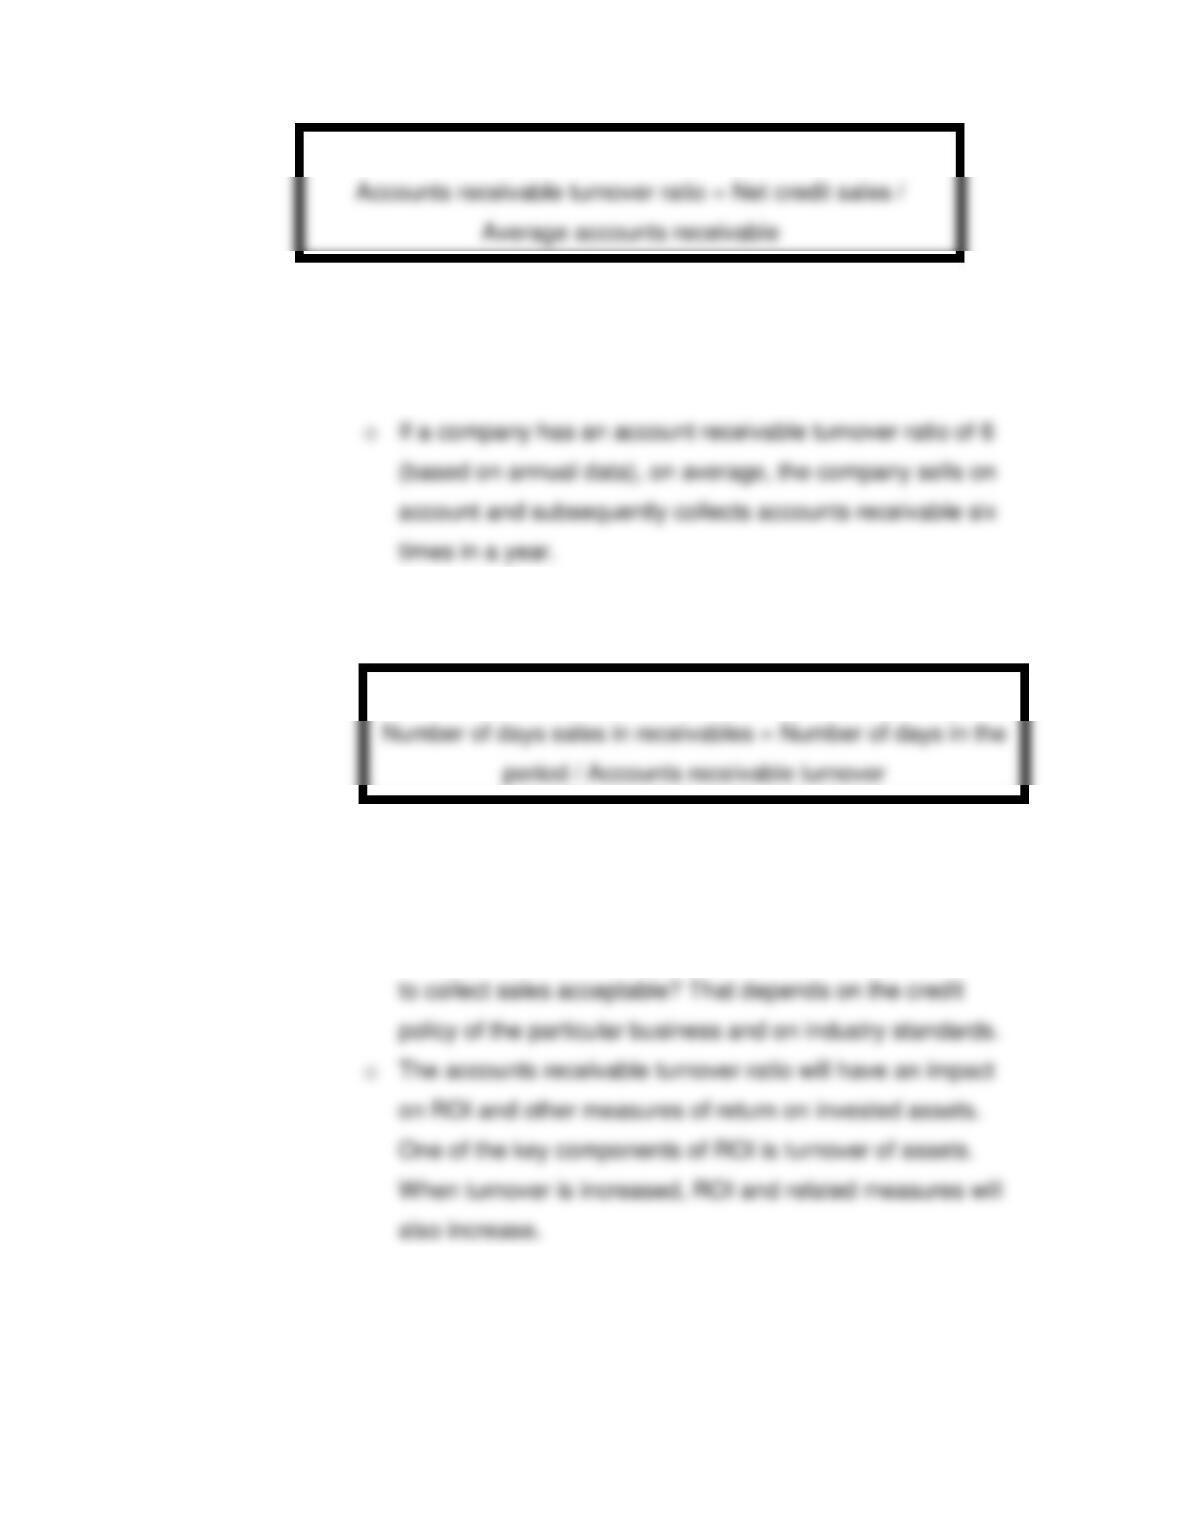
numerator in a ratio, with an average balance of current liabilities in
the denominator:
o If a company has a cash flow from operations to current
liabilities ratio higher than 1, the company is generating
sufficient cash from operations to pay current obligations.
4. Accounts Receivable Analysis
The accounts receivable turnover ratio is one of the best measures
Key Formula
Ratio of cash flow from operations to current liabilities = Net
Instructor’s Manual
12-7
o The account receivable turnover ratio is known as an
activity ratio, which means that it consists of an activity
(sales) divided by a related base (accounts receivable).
o The average number of days to collect a credit sale can be
computed as:
o If a company has an account receivable turnover ratio of 6
(based on annual data), the average time to collect sales
on account is approximately 61 days. Is this amount of time
5. Inventory Analysis
The analysis of inventory is similar to the analysis of accounts
receivable. The first ratio is the inventory turnover ratio:
Key Formula
Key Formula
Instructor’s Manual
12-8
o If a company has an inventory turnover ratio of 3 (based on
annual data), on average, the company purchases
o If a company has an inventory turnover ratio of 3 (based on
annual data), the company holds inventory for
approximately 122 days before sale.
o Low turnover ratios and a correspondingly high number of
Key Formula
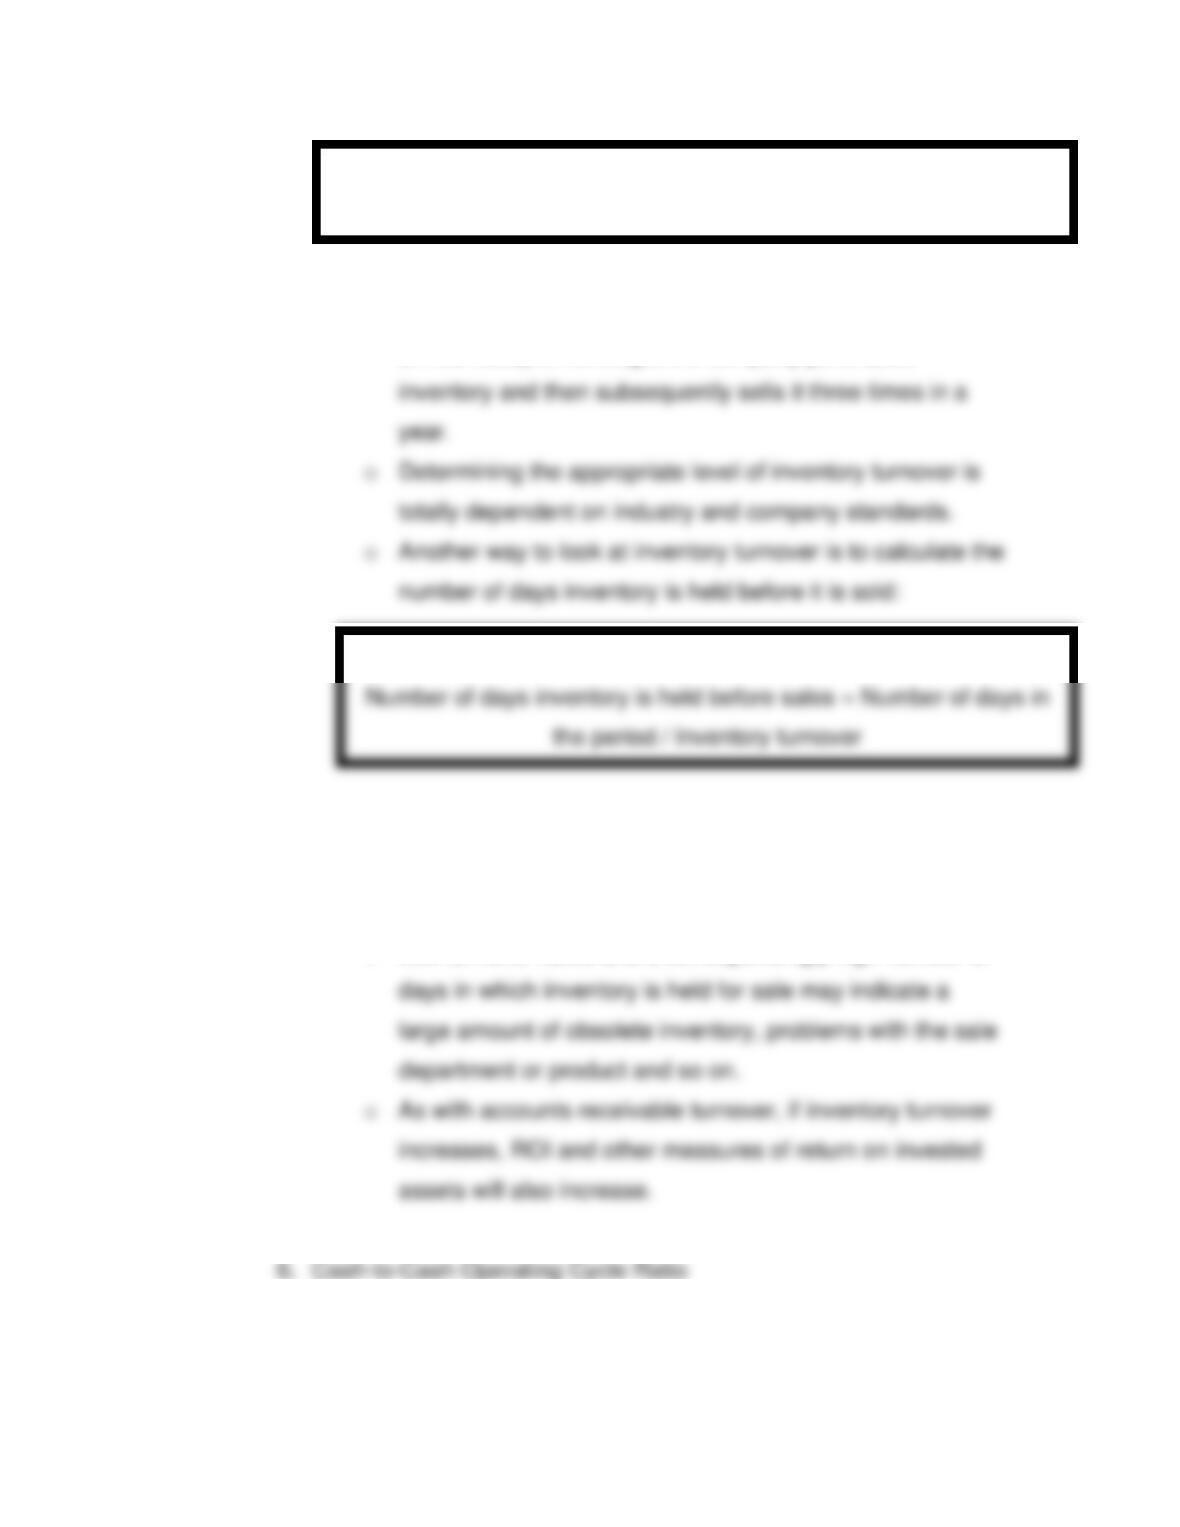
Inventory turnover ratio = Cost of goods sold / Average inventory
Key Formula
Instructor’s Manual
The cash-to-cash operating cycle ratio measures the length of time
o If the number of days sales in receivable and number of
F. Ratio Analysis—Solvency Ratios (LO5)
Solvency represents a company’s ability to remain in business over the long
term. Solvency is related to liquidity but differs with respect to the time
frame. Liquidity measures the ability to pay short-term debt, whereas
solvency measures the ability to stay financially healthy over the long run.
1. Debt-to-Equity Ratio
The main focus of solvency analysis is capital structure. Capital
Key Formula
Cash-to-cash operating cycle ratio = Number of days in inventory +
Number of days in receivables
Instructor’s Manual
12–10
o If a company has a debt-to-equity ratio of 0.25 to 1, it
indicates that for every $1 of capital (capital stock and
retained earnings), creditors provided 25 cents.
o Low debt-to-equity ratios indicate a preference to raise
obligation to repay the debt and the interest on the debt.
2. Times-Interest-Earned Ratio
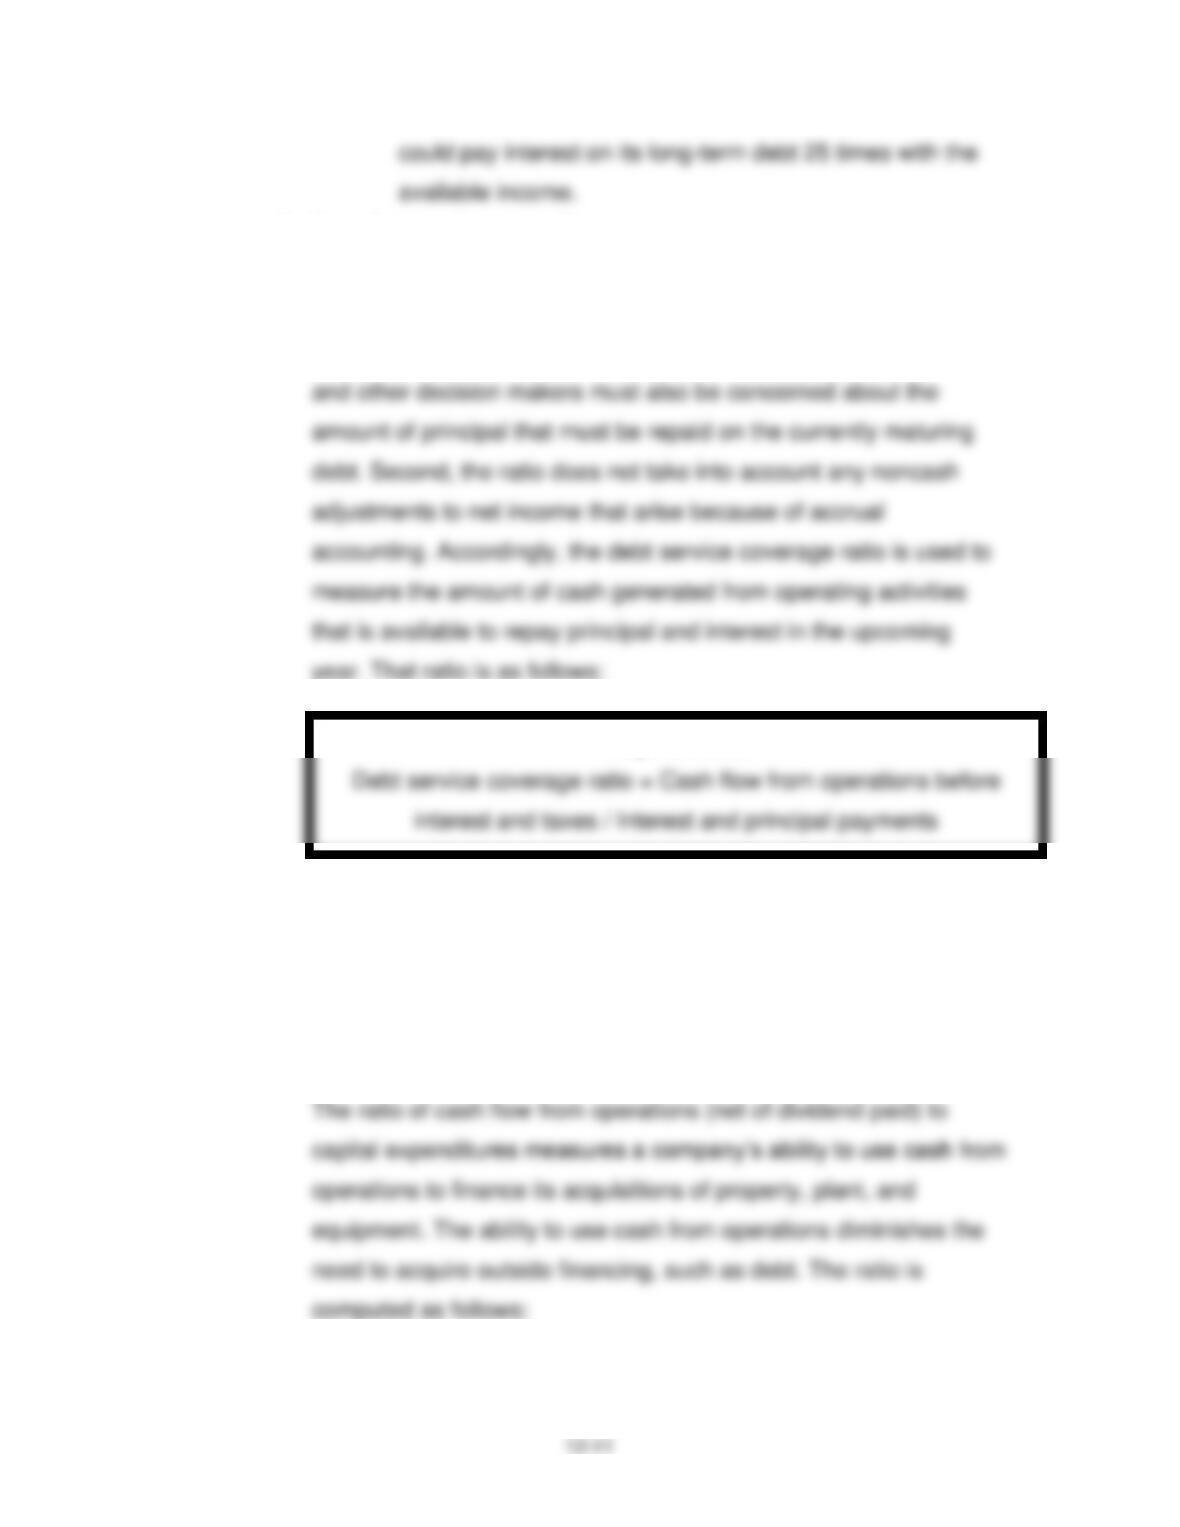
Times interest earned measures a company’s ability to meet
current interest payments to creditors by specifically measuring its
ability to meet current-year interest payments out of current-year
earnings:
Key Formula
Instructor’s Manual
3. Debt Service Coverage Ratio
Two major weaknesses are associated with the use of the times-
interest-earned ratio as a measure of the ability to pay creditors.
First, the ratio considers only interest expense. Yet management
o If a company has a debt service coverage ratio of 1.5, it
indicates that the company generated $1.5 in cash for
every $1 of interest and principal paid during the period.
4. Cash Flow from Operations (net of dividends paid) to Capital
Expenditures Ratio
Key Formula
Instructor’s Manual
12–12
o If a company has a cash flow from operations (net of
G. Ratio Analysis—Profitability Ratios (LO6)
Another group of ratios of importance to decision makers consists of those
ratios concerned with profitability analysis.
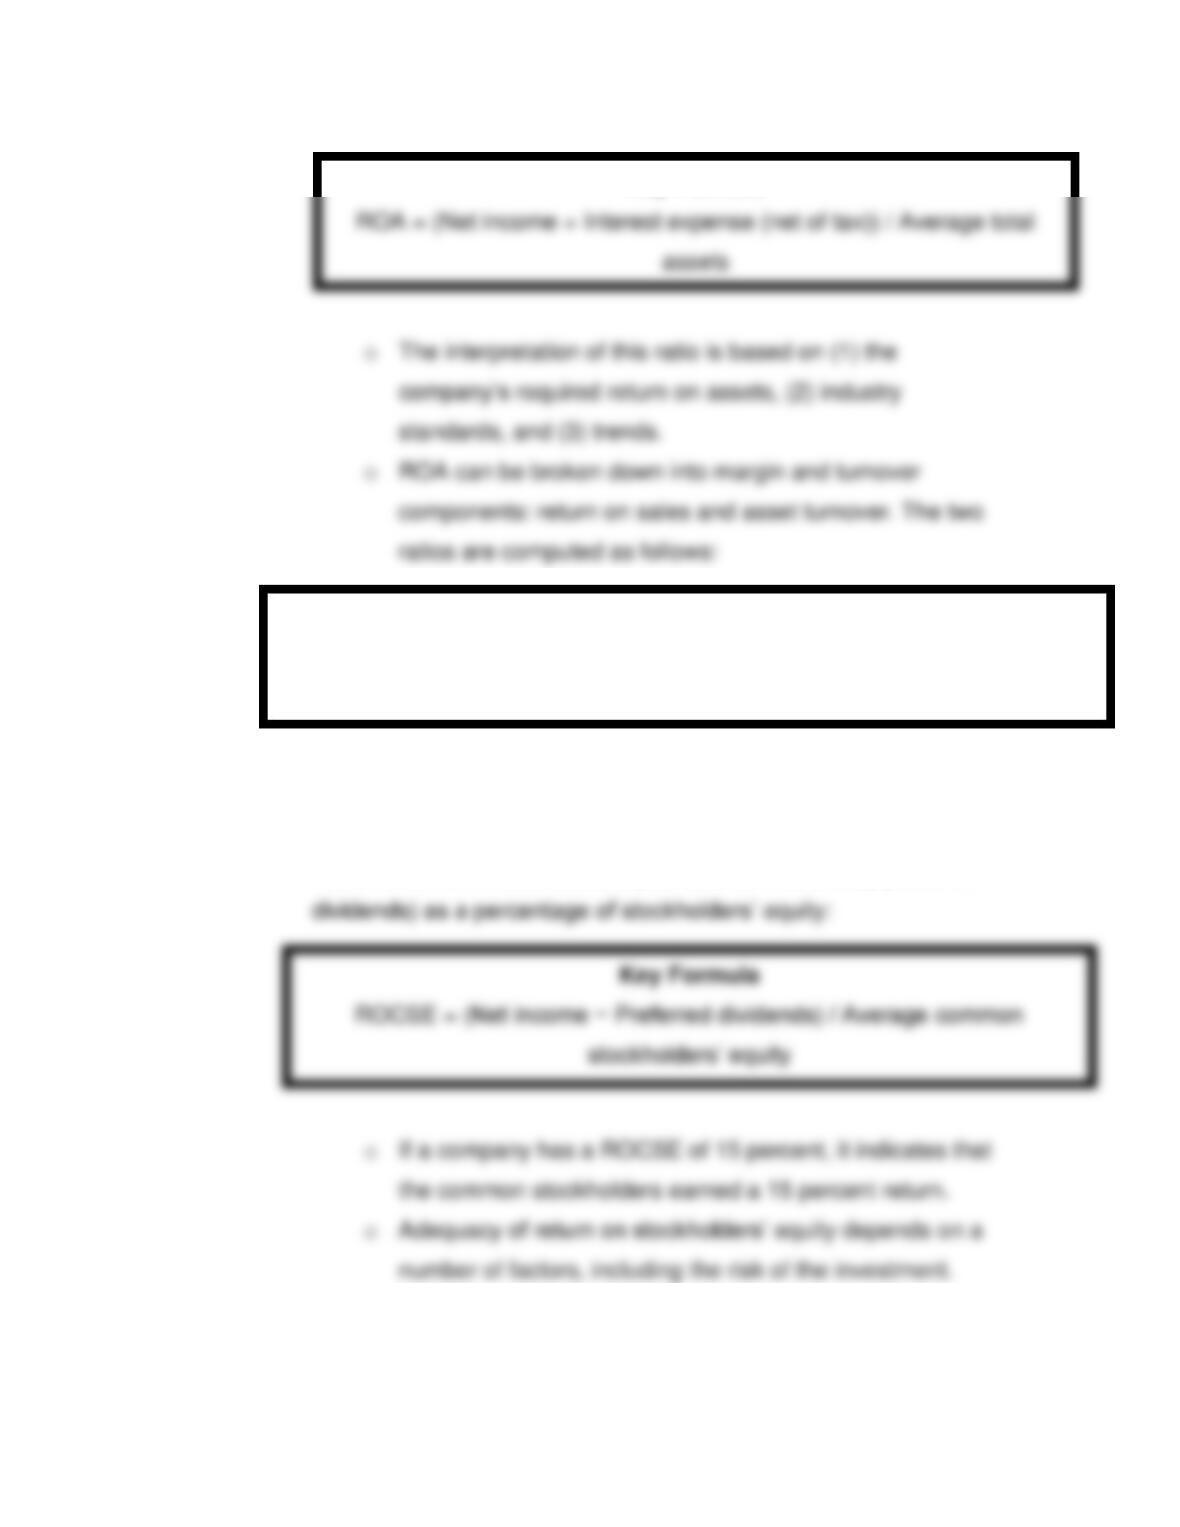
1. Return on Assets
Return ratios measure the relationship between a return and a
Key Concept
Solvency ratios assess the extent to which a company must borrow money to
operate the business and the amount of interest paid on that money.
Key Formula
Instructor’s Manual
12–13
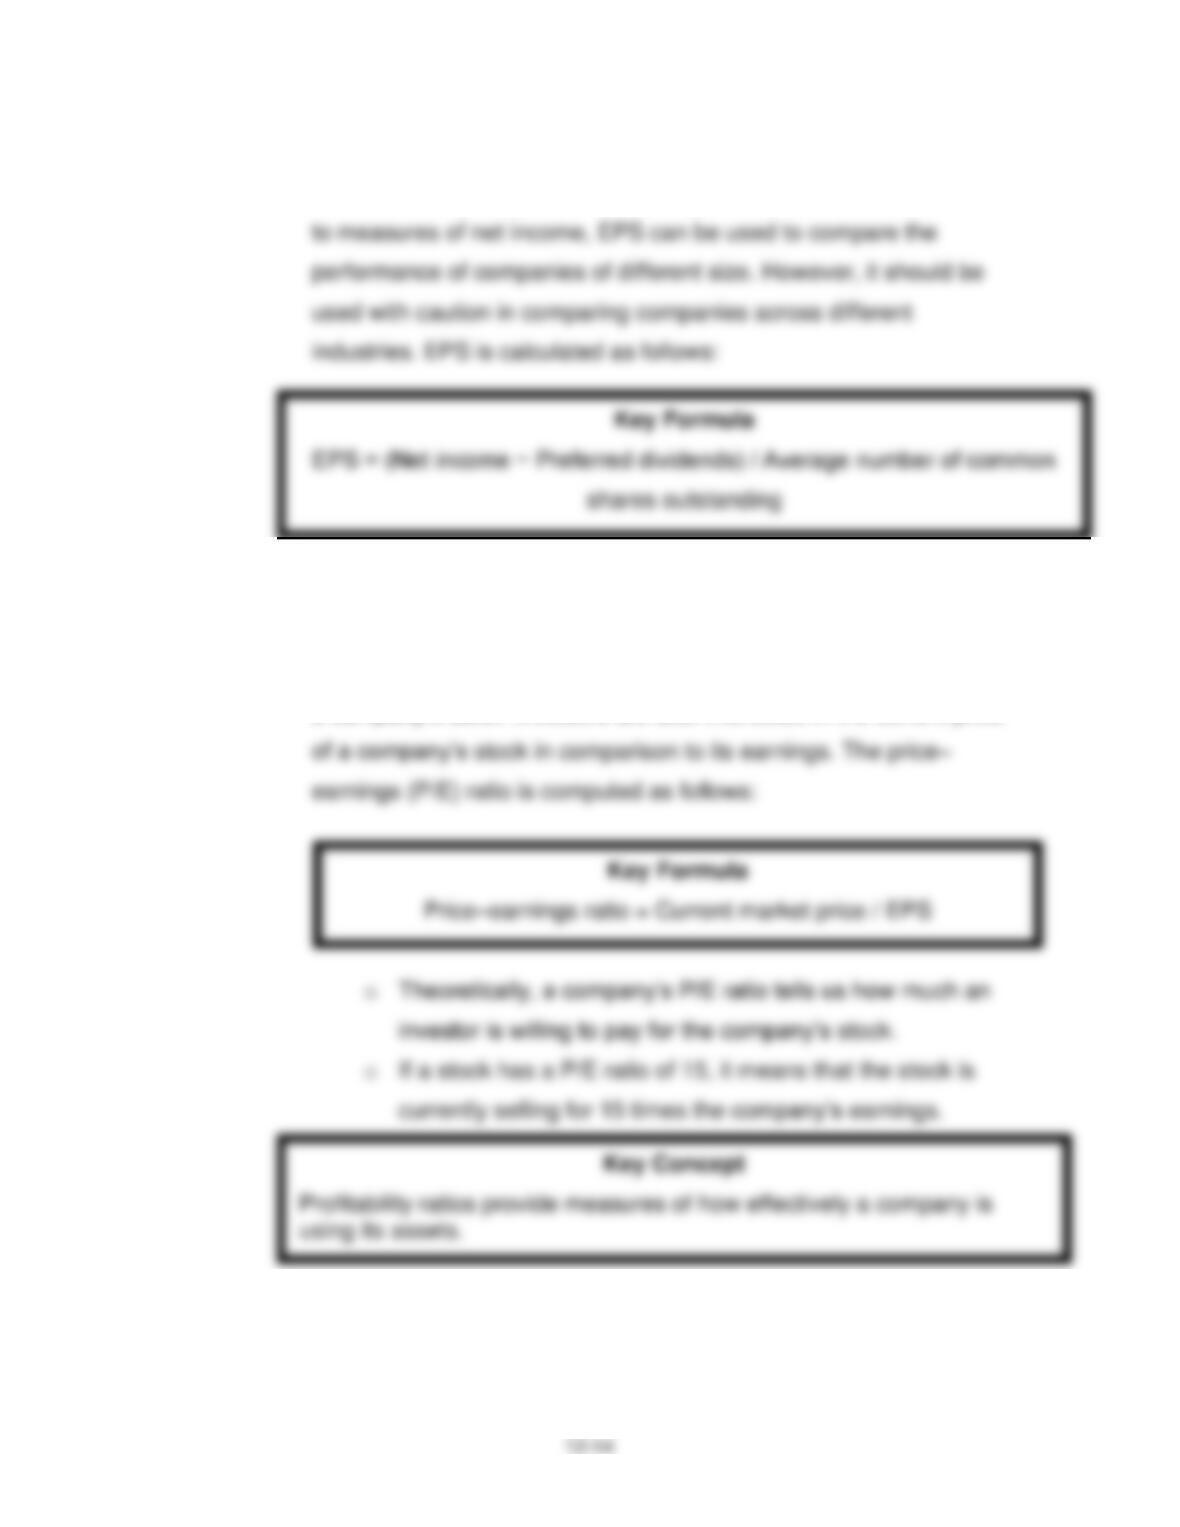
2. Return on Common Stockholders’ Equity
Return on common stockholders’ equity (ROCSE) measures the
return to common stockholders (net income reduced by preferred
3. Earnings per Share
Key Formula
Key Formula
Return on sales = (Net income + Interest expense (net of tax)) / Net sales
Asset turnover ratio = Net sales / Average total assets
Instructor’s Manual
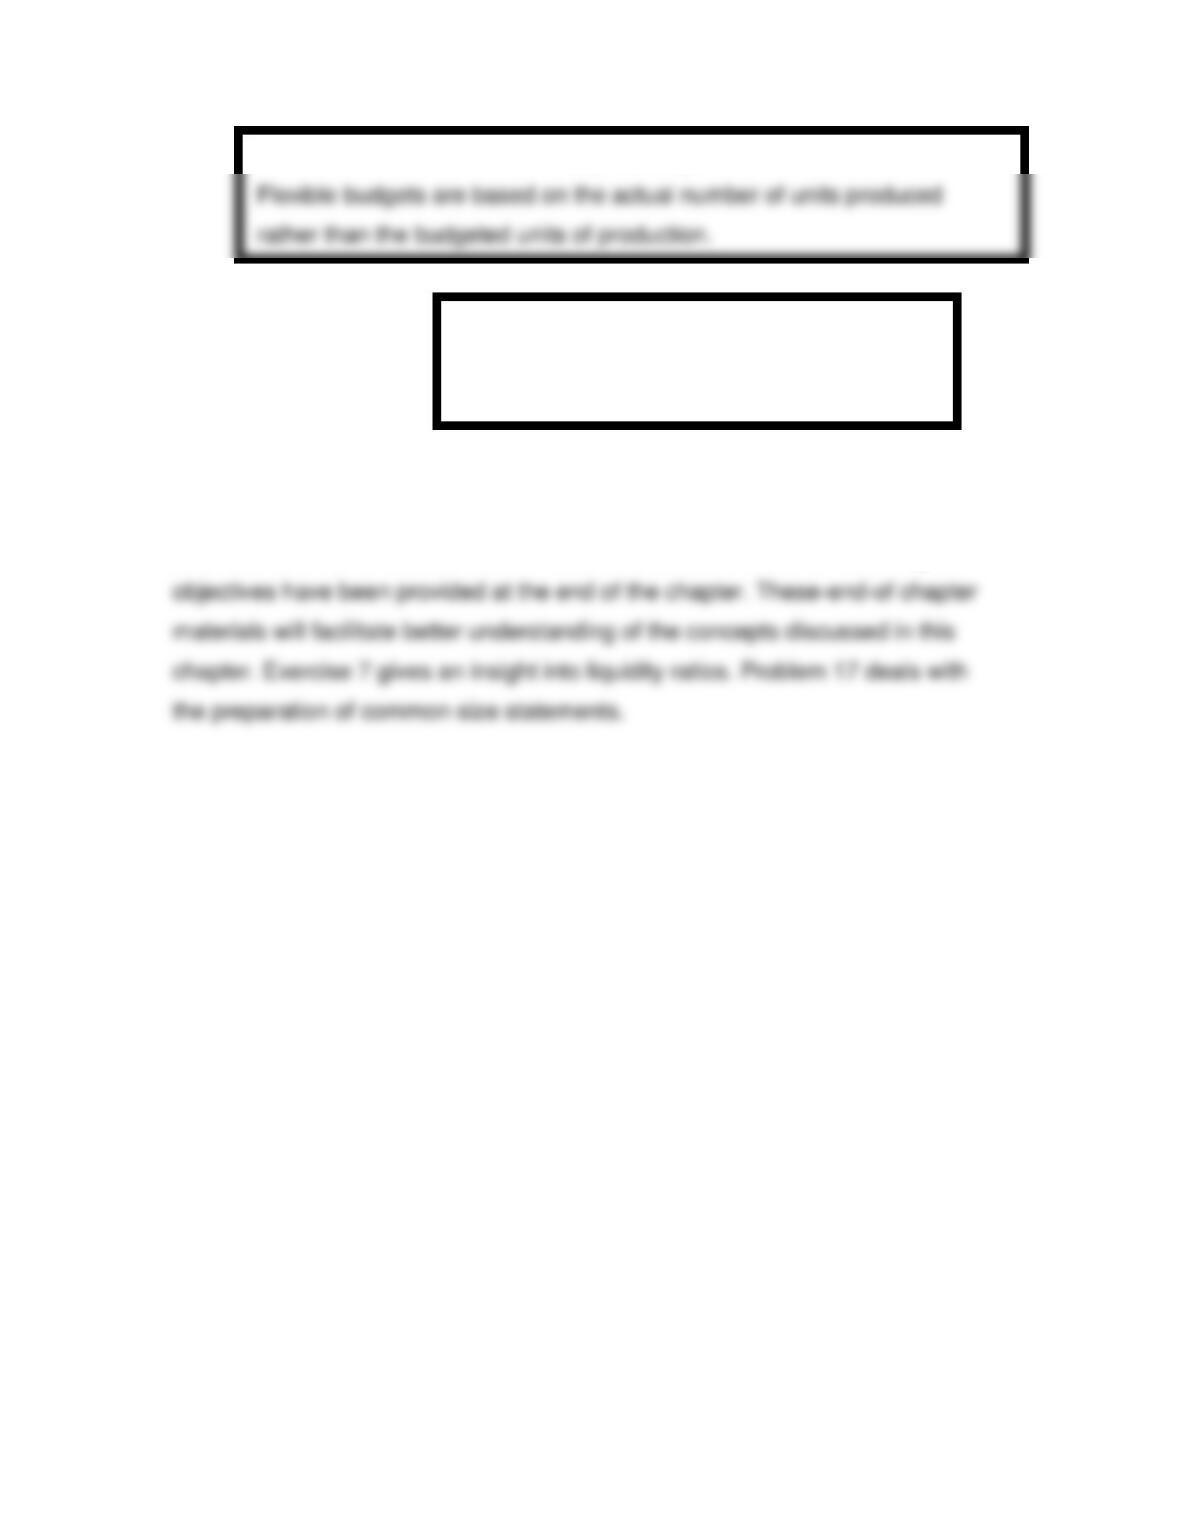
Current stockholders and potential investors use earnings
per share (EPS) as a key measure of performance. In contrast
4. Price Earnings Ratio
Earnings per share is a very important ratio for investors because
of the relationship of earnings to dividends and the market price of
a company’s stock. Investors are also interested in the current price
Instructor’s Manual
12–15
End-of-Chapter Material
Brief exercises, exercises, problems, and case based on different learning
Making It Real:
Predicting Stock Performance with
Financial Statement Analysis
Key Concept