12-1
Chapter 12
Financial Statement Analysis
Concept Questions
1. (LO1—The purpose of financial statement analysis)
Financial statement analysis provides useful information to supplement
information that is directly provided in the financial statements. Ratio analysis
2. (LO1—Limitations of financial statement analysis)
Ratio analysis by itself does not indicate the various accounting methods (e.g.,
whether a company used LIFO or FIFO to value inventory), estimates, and
3. (LO2—Trend analysis)
Decision makers might wish to perform a trend analysis because it is useful in
4. (LO2—Trend analysis: Number of years)
Decision makers should use more years because doing so enables them to
5. (LO3—Usefulness of common-size financial statements)
Common-size financial statements are useful because they allow decision
makers to remove size (i.e., dollar amounts) as a relevant variable in ratio
Solutions Manual
12-2
analysis, and they can be used to compare companies that make similar
products and that are different in size.
6. (LO3—Working capital)
7. (LO4—Formula to compute accounts receivable turnover)
8. (LO4—Decreasing the current ratio)
High current ratios can indicate problems in managing inventory and/or investing
idle cash. A company can decrease its current ratio in a number of ways,
9. (LO4—Increasing the current ratio)
Although a current ratio of 2.0 is probably adequate, the company may need
additional cash to finance new investments or could be expecting a seasonal
downturn in sales that would make it prudent to hold more cash. The current ratio
10. (LO5—Interpretation of the debt-to-equity ratio)
The debt-to-equity ratio tells how a company is capitalized—that is, how much
11. (LO6—Calculation of the asset turnover ratio)
Chapter 12: Financial Statement Analysis
12-3
(Note to instructors: Please be aware that there are some exercises or
problems that require students to round their solutions.)
Brief Exercises
1. (LO1—Analyzing financial statements)
a. False
2. (LO2, 3—Horizontal and vertical analysis)
a. False
3. (LO4—Liquidity ratios)
4. (LO5—Solvency ratios)
Solutions Manual
12-4
Exercises
6. (LO3—Return on assets: Margin versus turnover)
Dan’s Duds is likely the specialty retailer. It has a higher profit margin (7.06%)
than Handsome Hal’s (4.49%) and a lower turnover (1.97, compared with Hal’s
turnover of 3.59). Handsome Hal’s ends up with the highest return on assets
(16.12%, as opposed to Dan’s ROA of 13.91%).
ROA =
Profit margin
× Asset turnover
7. (LO4—Liquidity ratios)
Accounts receivable turnover = Net credit sales ÷ Average accounts receivable
Average number of days in accounts receivable = 365 ÷ Accounts receivable turnover
C. Company 1 collects its accounts receivable more quickly than Company 2.
However, Company 2 may have more liberal credit and collection policies
than Company 1 in an effort to stimulate sales. It is difficult to conclude
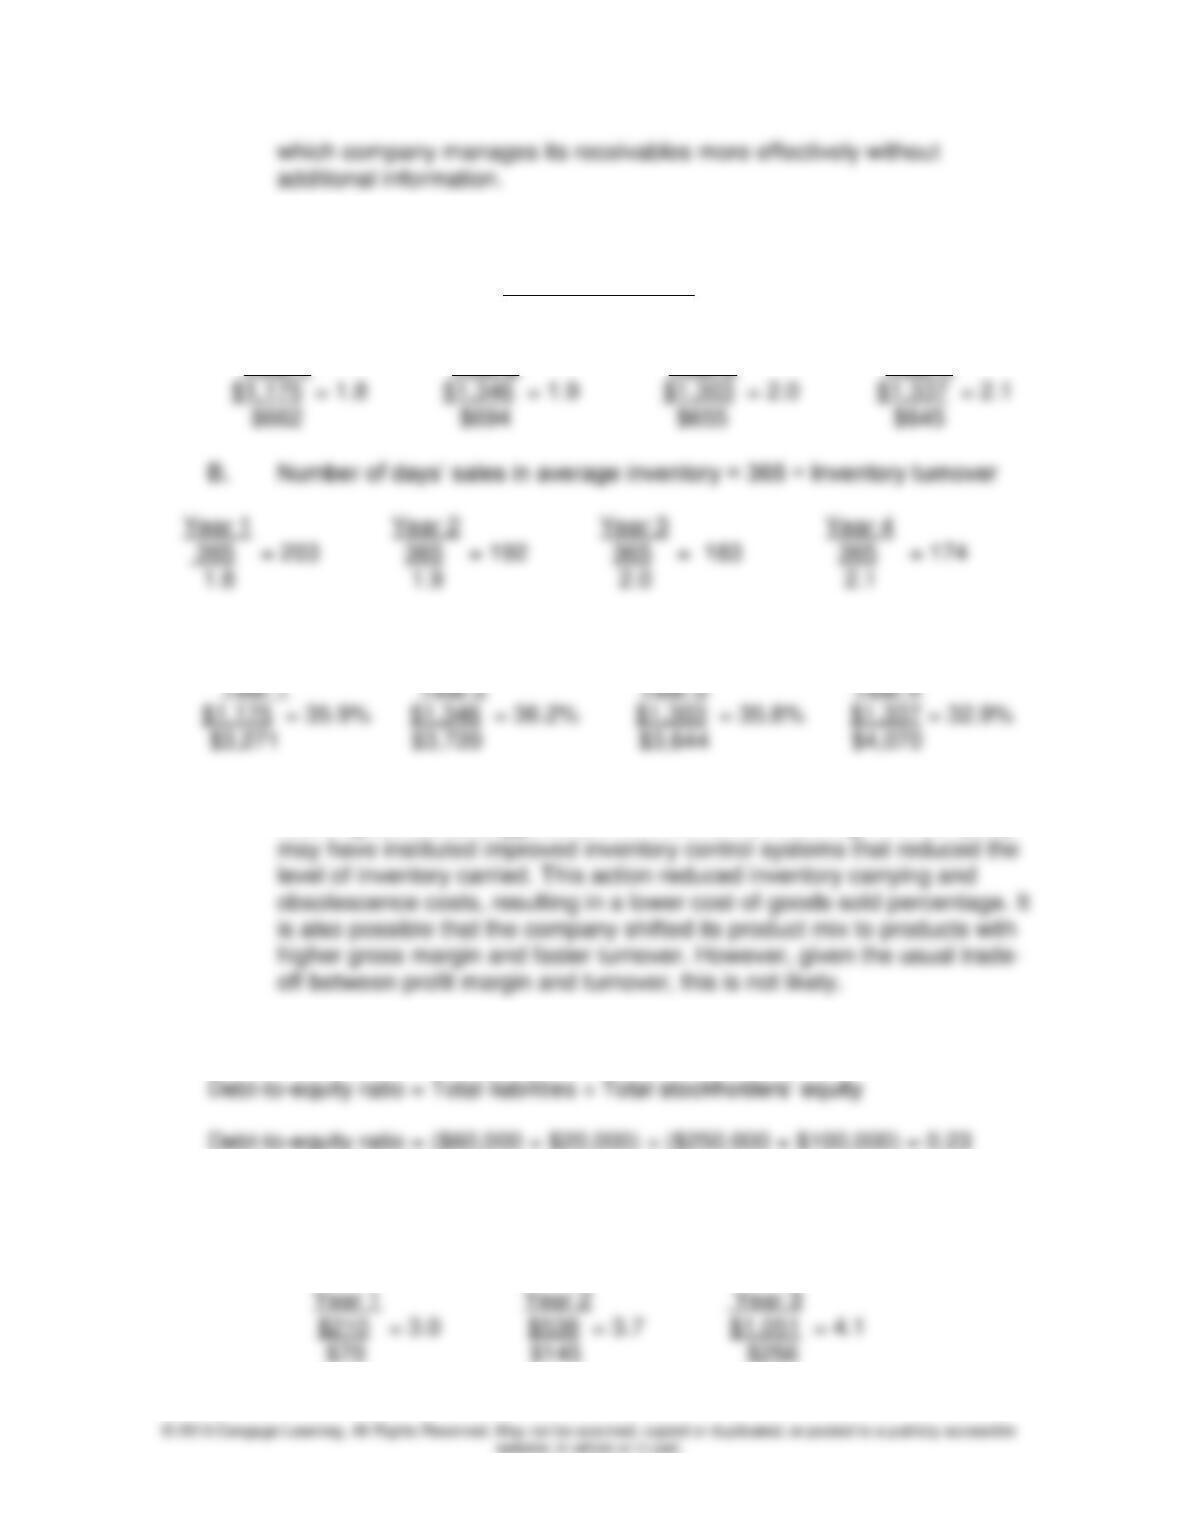
Chapter 12: Financial Statement Analysis
12-5
8. (LO4—Liquidity ratios)
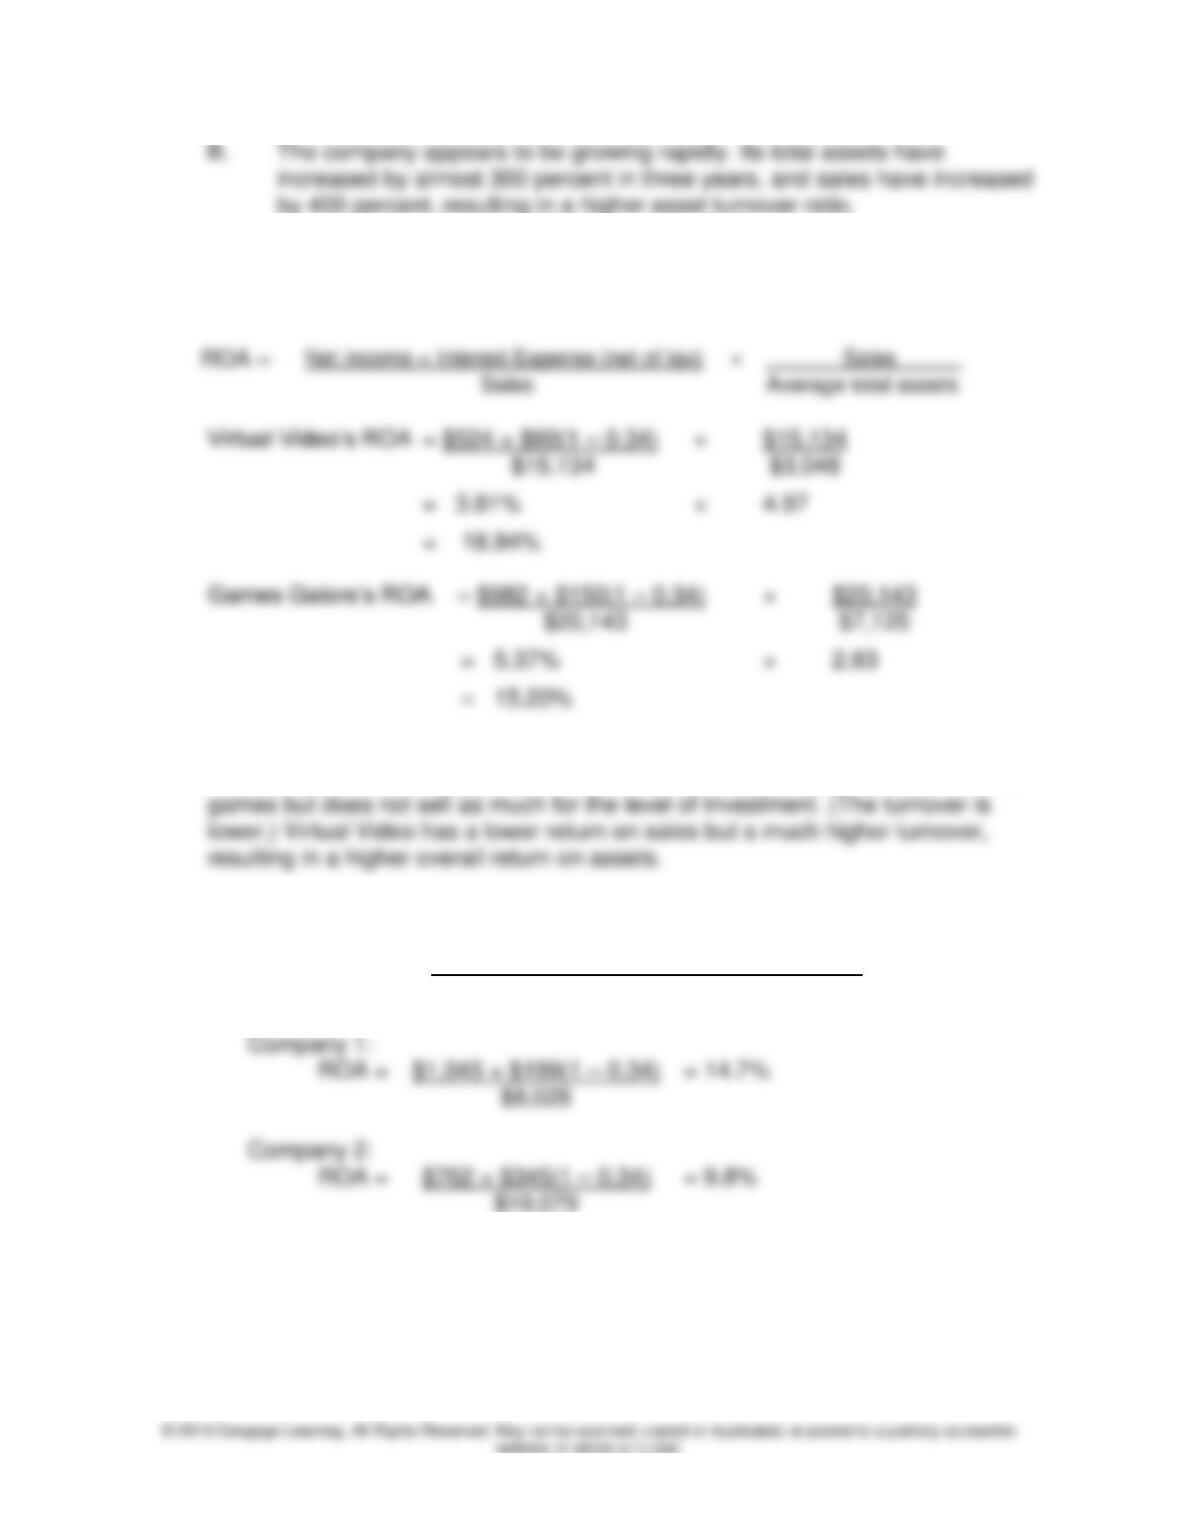
A. Inventory turnover = UCost of goods sold
Average inventory
UYear 1U
UYear 2U
UYear 3U
UYear 4U
C. Cost of goods sold to sales = Cost of goods sold ÷ Sales
D. The increasing rate of inventory turnover, coupled with the decreasing
cost of goods sold, suggests one or more of the following: The company
9. (LO5—Solvency ratio: Calculation of debt-to-equity ratio)
10. (LO6—Asset turnover ratio)
A. Asset turnover = Sales ÷ Average total assets
Solutions Manual
12-6
11. (LO6—Return on assets: Margin versus turnover)
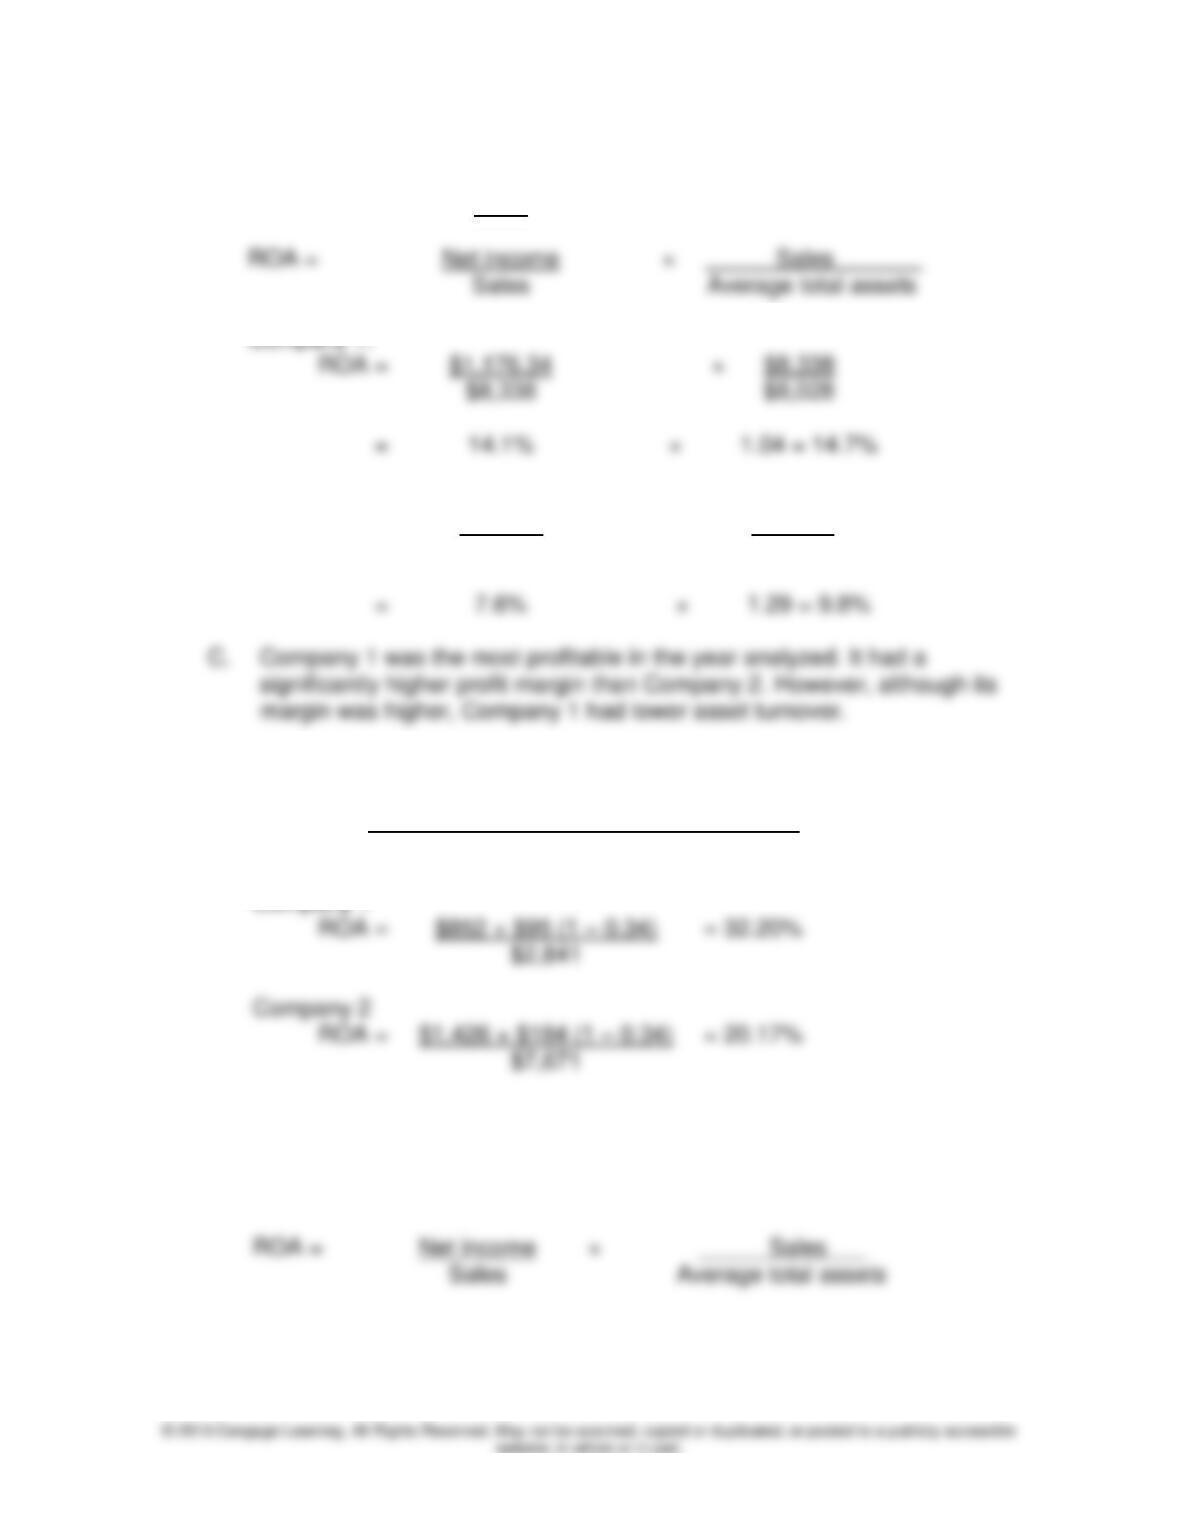
ROA =
Return on Sales
× Asset turnover
ROA =
Games Galore has a higher return on sales, but a lower asset turnover ratio, than
Virtual Video. The company makes more money on each dollar of sales of video
12. (LO6—Profitability ratios)
A.
ROA =
Net income + Interest expense (net of tax)
Average total assets
Company 1:
= 14.7%
Company 2:
Chapter 12: Financial Statement Analysis
12-7
B.
ROA =
Profit
× Asset turnover
ROA =
Company 1:
=
Company 2:
ROA =
$989.70
× $13,007
$13,007
$10,079
=
7.6%
13. (LO6—Profitability ratios)
A.
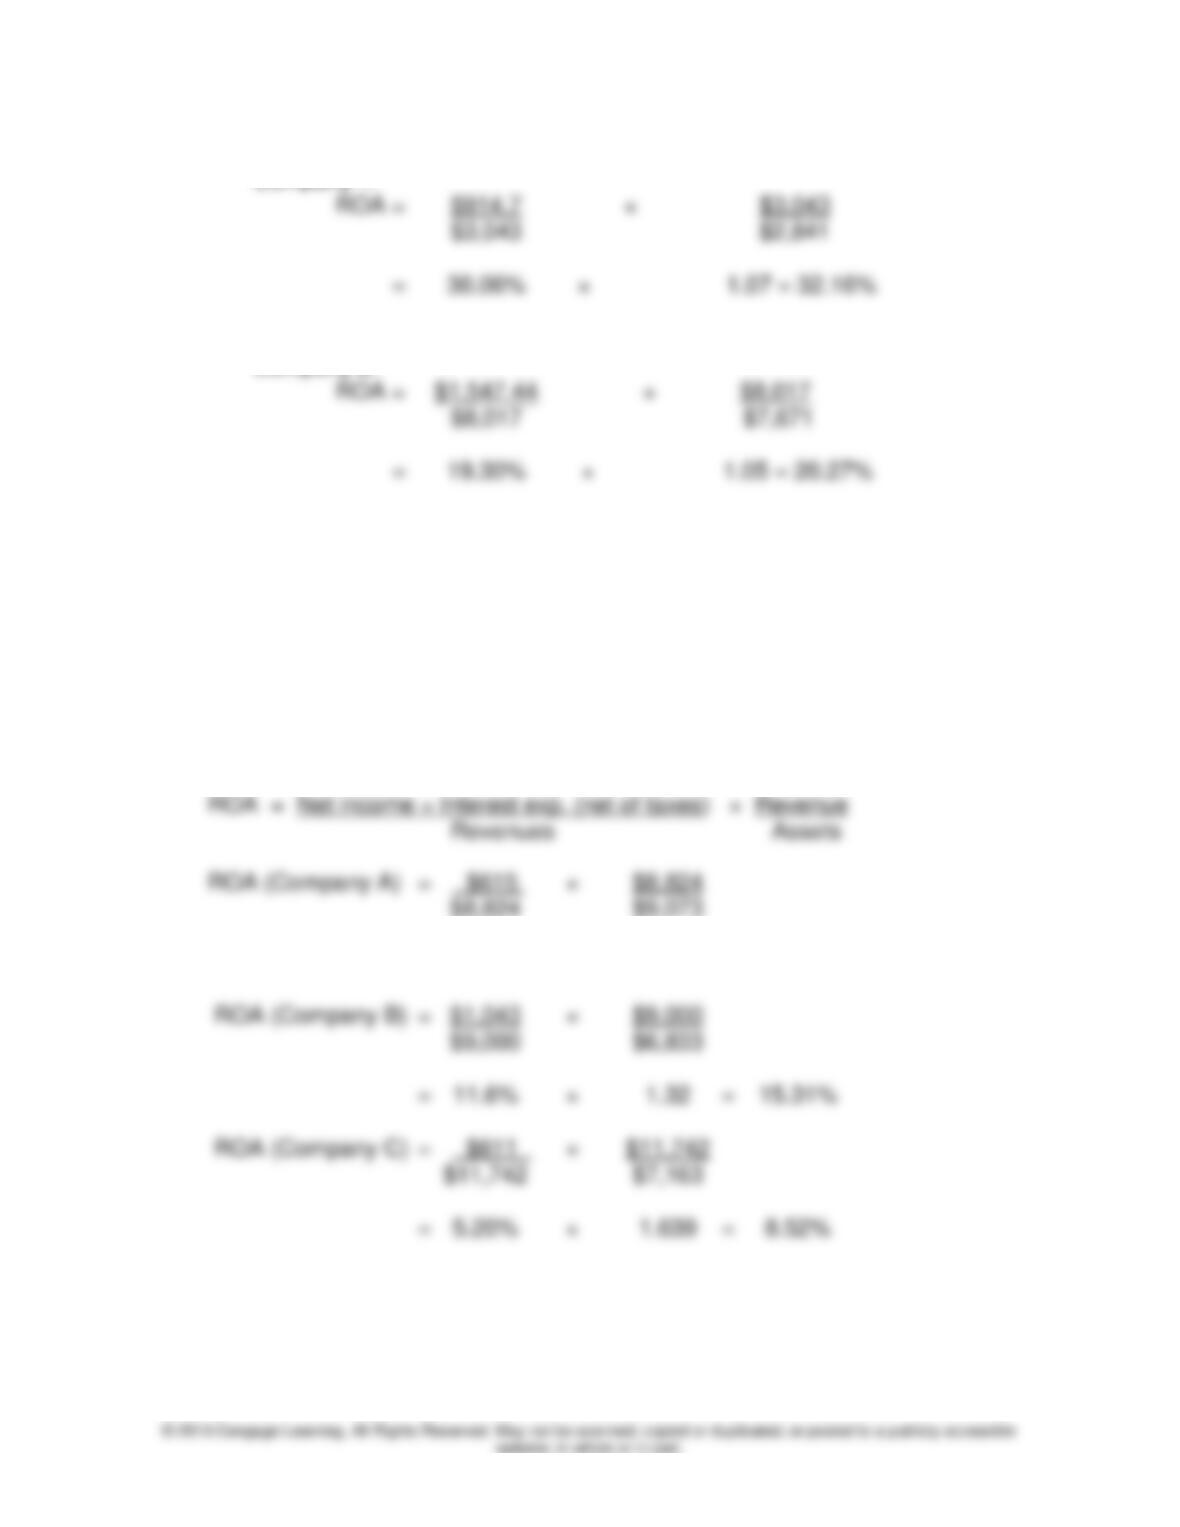
ROA =
Net income + Interest expense (net of tax)
Average total assets
Company 1
ROA =
= 32.20%
Company 2
ROA =
= 20.17%
B.
ROA =
Return on
Sales
× Asset turnover
ROA =
Sales
Average total assets
Solutions Manual
12-8
Company 1:
Company 2:
C. Company 1 was the most profitable in the year analyzed. It had a
significantly higher profit margin than Company 2, while the asset turnover
ratio of the two companies was similar. Accordingly, Company 1 had a
ROA of 32.16 percent, while Company 2 had an ROA of 20.27 percent.
14. (LO3, 6—Rate of return: Comparison of different companies)
A.
= 6.97% × 0.97 = 6.76%
B. Company A is most likely the airline. It has a large amount of assets and a
small rate of return. Airlines are the most capital intensive of the three
industries represented. Company B is most likely the pharmaceutical
company. Pharmaceutical companies generally generate high margins on
Chapter 12: Financial Statement Analysis
sales of their products. Company C is most likely the retail department
store, a competitive business characterized by low margins and high
turnover.
Problems
15. (LO1, 2, 4, 5, and 6—Ratio analysis: Decision focus)
A. The current ratio measures overall short-term liquidity and is an indicator
of the short-term debt-paying ability of the firm. The quick ratio is also a
measure of short-term liquidity. However, it is a measure of more
immediate liquidity and is an indicator of the ability of a firm to pay current
B. 7BUMidCoastal BankU: Current and quick ratios as well as debt-to-equity ratio
8B UOzawa CompanyU: Current ratio, quick ratio, and inventory turnover
UDrucker & DenonU: Profit margin and turnover (ROA)
UWorking Capital Management CommitteeU: Current ratio, quick ratio, and
inventory turnover
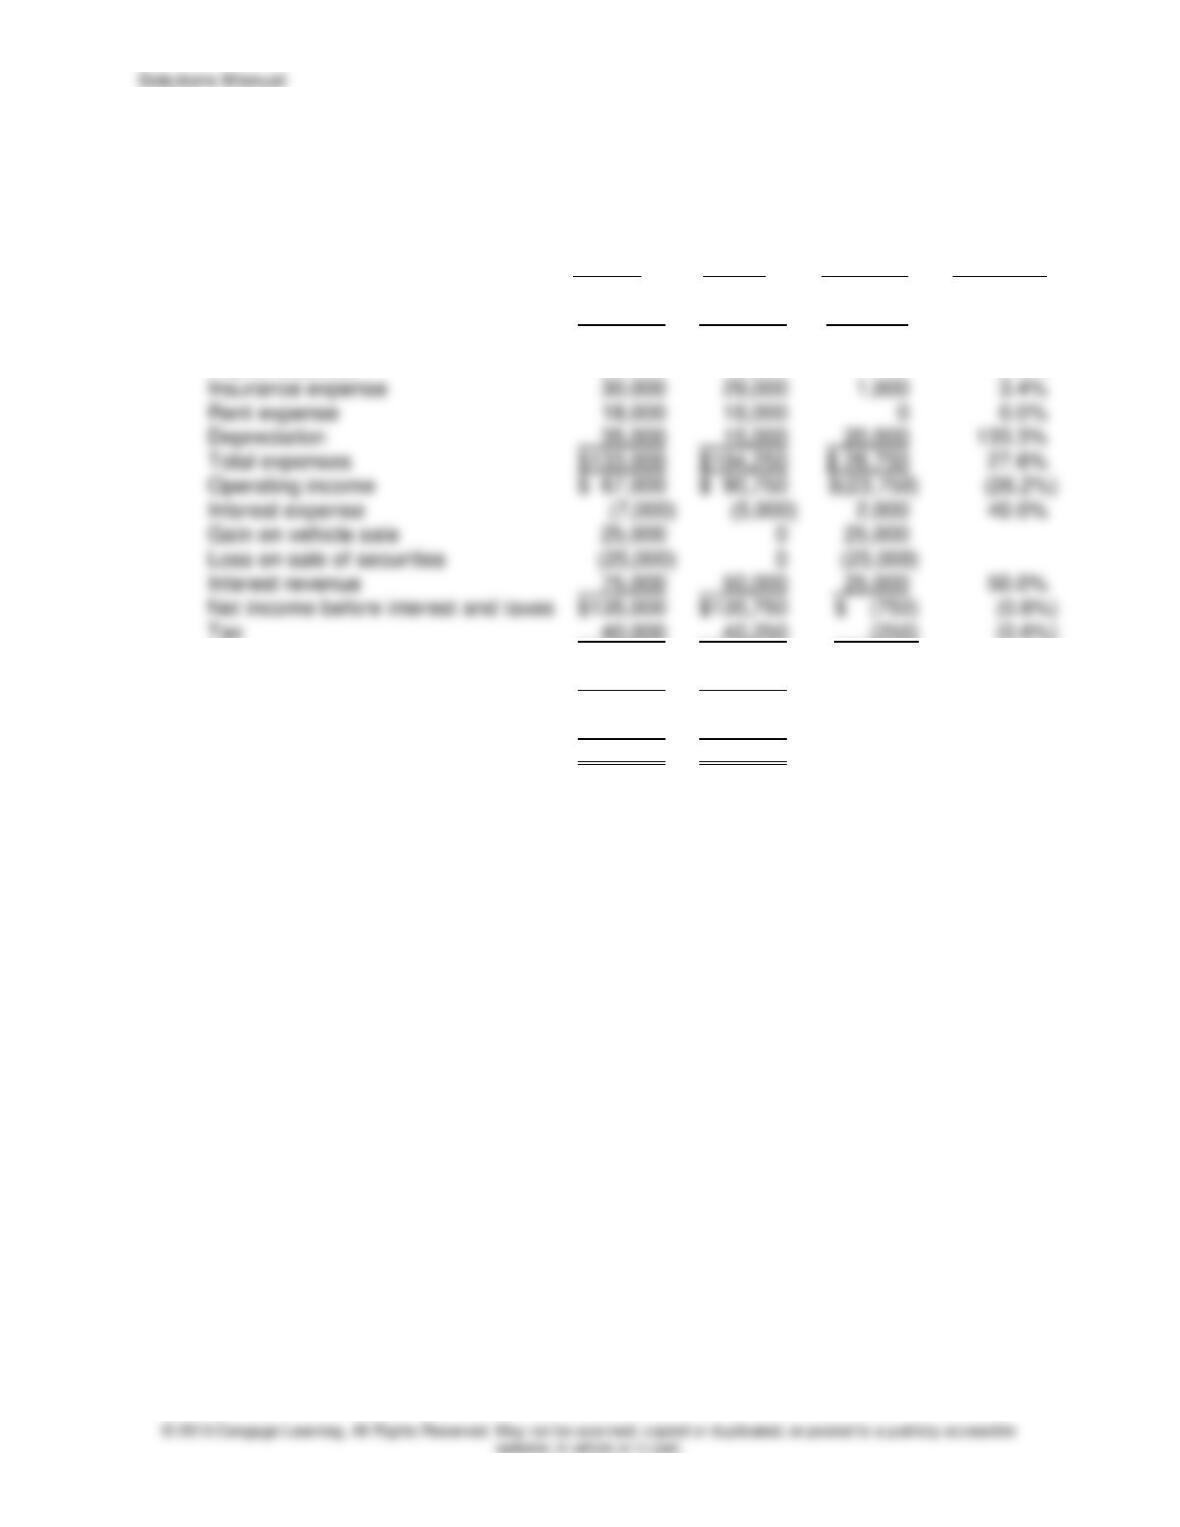
C. 9BAvantronics’s current and quick ratios have been improving over time and
are currently near or above industry averages. However, one must look at
The company’s profitability is very good. The profit margin has been
increasing and is greater than the industry average. However, this good
finding is tempered by the lower-than-average inventory turnover.
12–10
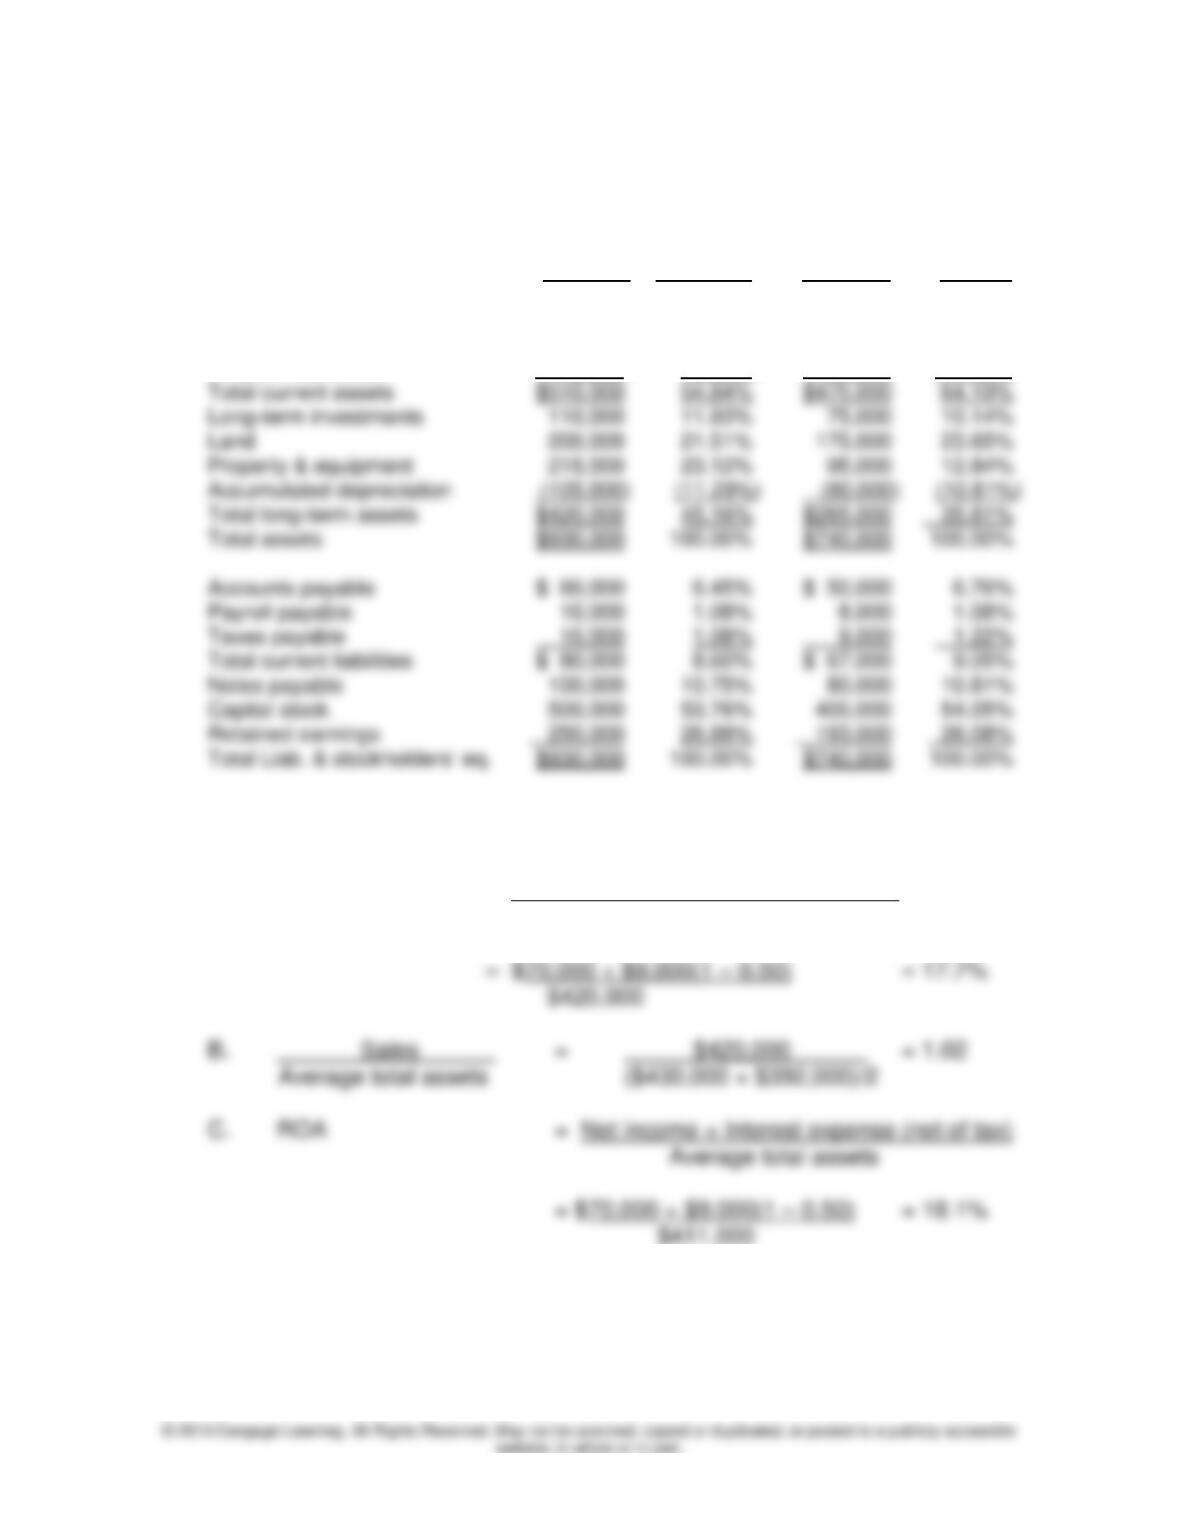
16. (LO2—Horizontal analysis) Martha’s Miscellaneous
Comparative Statements of Income and Retained Earnings
U Year 2
UYear 1U
U$ changeU
U% changeU
Sales revenue
$700,000
$650,000
$ 50,000
7.7%
Cost of goods sold
U 500,000U
U 455,000U
U 45,000U
9.9%
Gross profit
$200,000
$195,000
$ 5,000
2.6%
Payroll expense
50,000
42,250
7,750
18.3%
Insurance expense
3.4%
Rent expense
18,000
18,000
0.0%
Depreciation
U 35,000U
U 15,000U
U 20,000U
Total expenses
U$133,000U
U$104,250U
U$ 28,750U
Operating income
$ 67,000
$ 90,750
Interest expense
Gain on vehicle sale
25,000
25,000
Loss on sale of securities
Interest revenue
U 75,000U
U 50,000U
U 25,000U
Net income before interest and taxes
$135,750
$ (750)
(0.6%)
Tax
U 40,000U
U 40,250U
U (250)U
(0.6%)
Net income
$ 95,000
$ 95,500
$ (500)
(0.5%)
Dividends
U 38,000U
U 38,000U
To: Retained earnings
$ 57,000
$ 57,500
Retained earnings: 1/1
U 193,500U
U 136,000U
Retained earnings: 12/31
$250,500
$193,500
Chapter 12: Financial Statement Analysis
12–11
17. (LO4—Common-size statements)
Howard’s Hammocks
Comparative Balance Sheets
2012
Percent
2011
Percent
Cash
$130,000
13.98%
$110,000
14.86%
Accounts receivable
130,000
13.98%
120,000
16.22%
Inventory
225,000
24.19%
215,000
29.05%
Prepaid insurance
25,000
2.69%
30,000
4.05%
Total current assets
54.84%
$475,000
64.19%
110,000
11.83%
10.14%
200,000
21.51%
175,000
23.65%
Property & equipment
215,000
23.12%
12.84%
Total long-term assets
$420,000
45.16%
$265,000
Total assets
$930,000
$740,000
Accounts payable
$ 60,000
6.45%
$ 50,000
6.76%
Payroll payable
1.08%
1.08%
Taxes payable
10,000
1.08%
9,000
1.22%
Capital stock
500,000
53.76%
400,000
54.05%
Retained earnings
26.88%
Total Liab. & stockholders’ eq.
$740,000
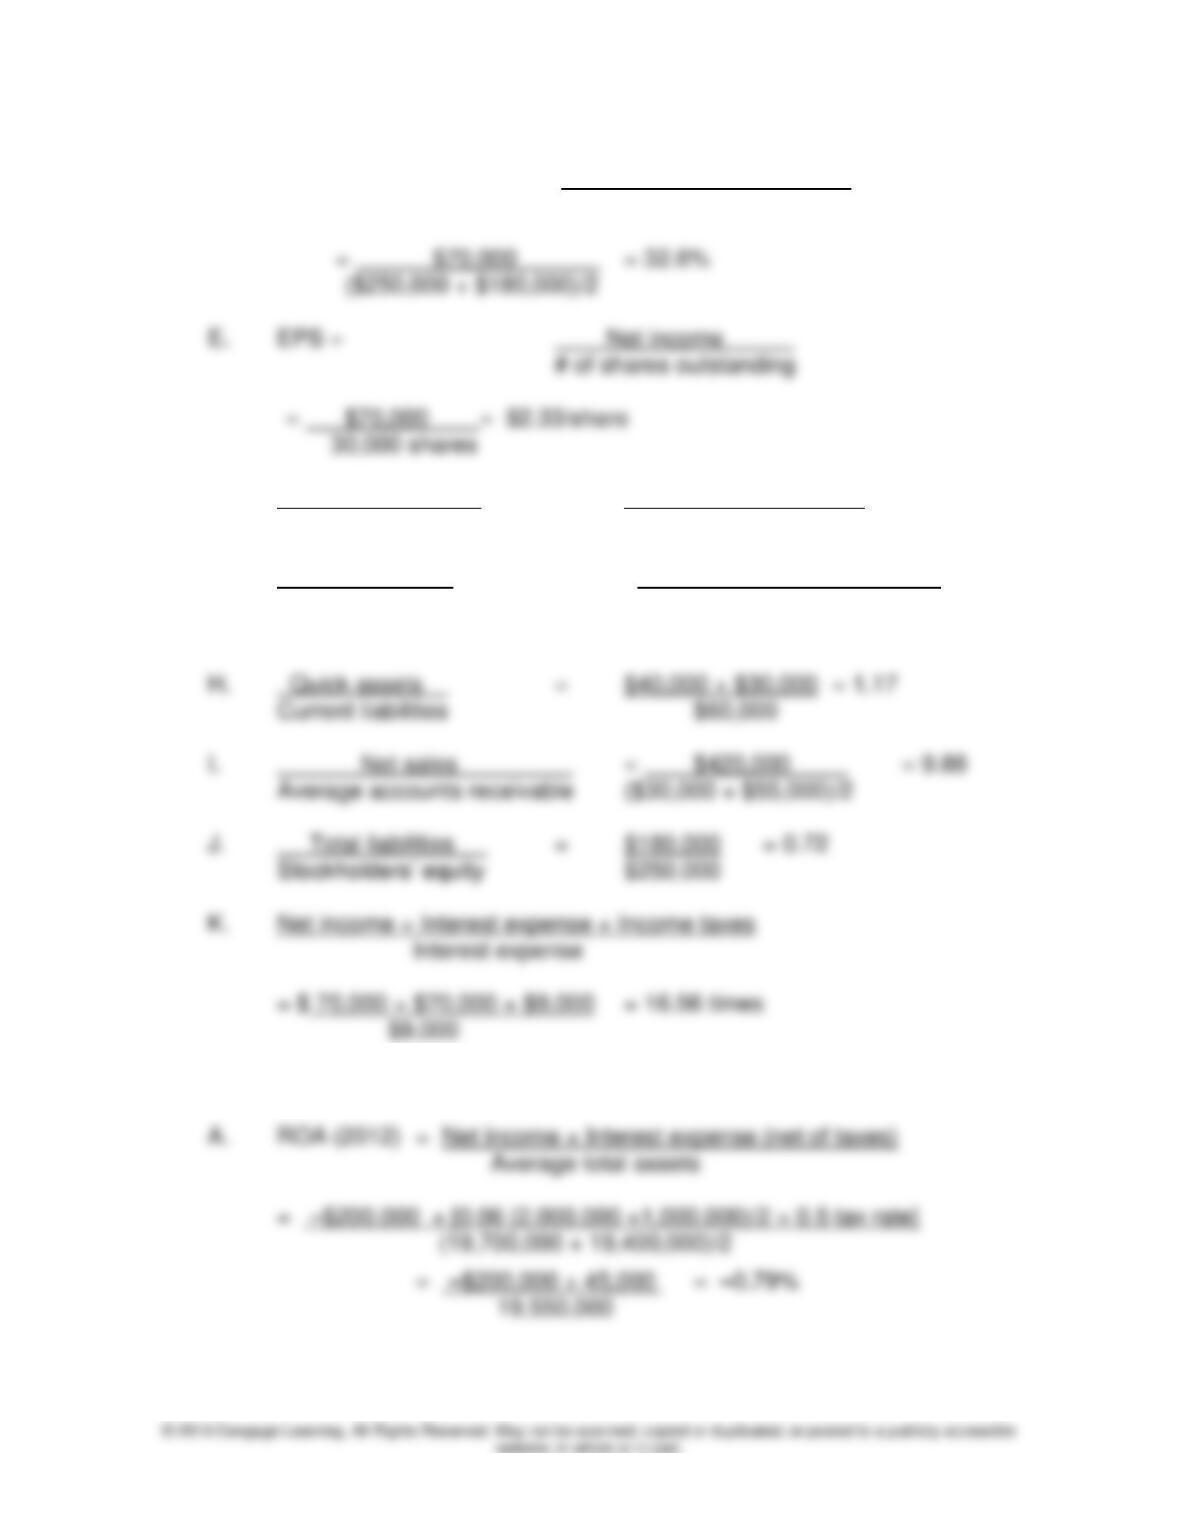
18. (LO4, 5, and 6—Comprehensive ratio analysis)
A. Profit margin ratio = UNet income + Interest exp. (net of tax)
Sales
Solutions Manual
12–12
D. 1BROCSE = U Net income _
Average stockholders’ equity
F. 3BUCost of goods sold U = U $214,000 U = 2.38
4B Average inventory ($110,000 + $70,000)/2
G. U Current assets U = $U40,000 + $30,000 + $110,000U = 3.0
Current liabilities $60,000
19. (LO4, 5, and 6—Comprehensive ratio analysis)
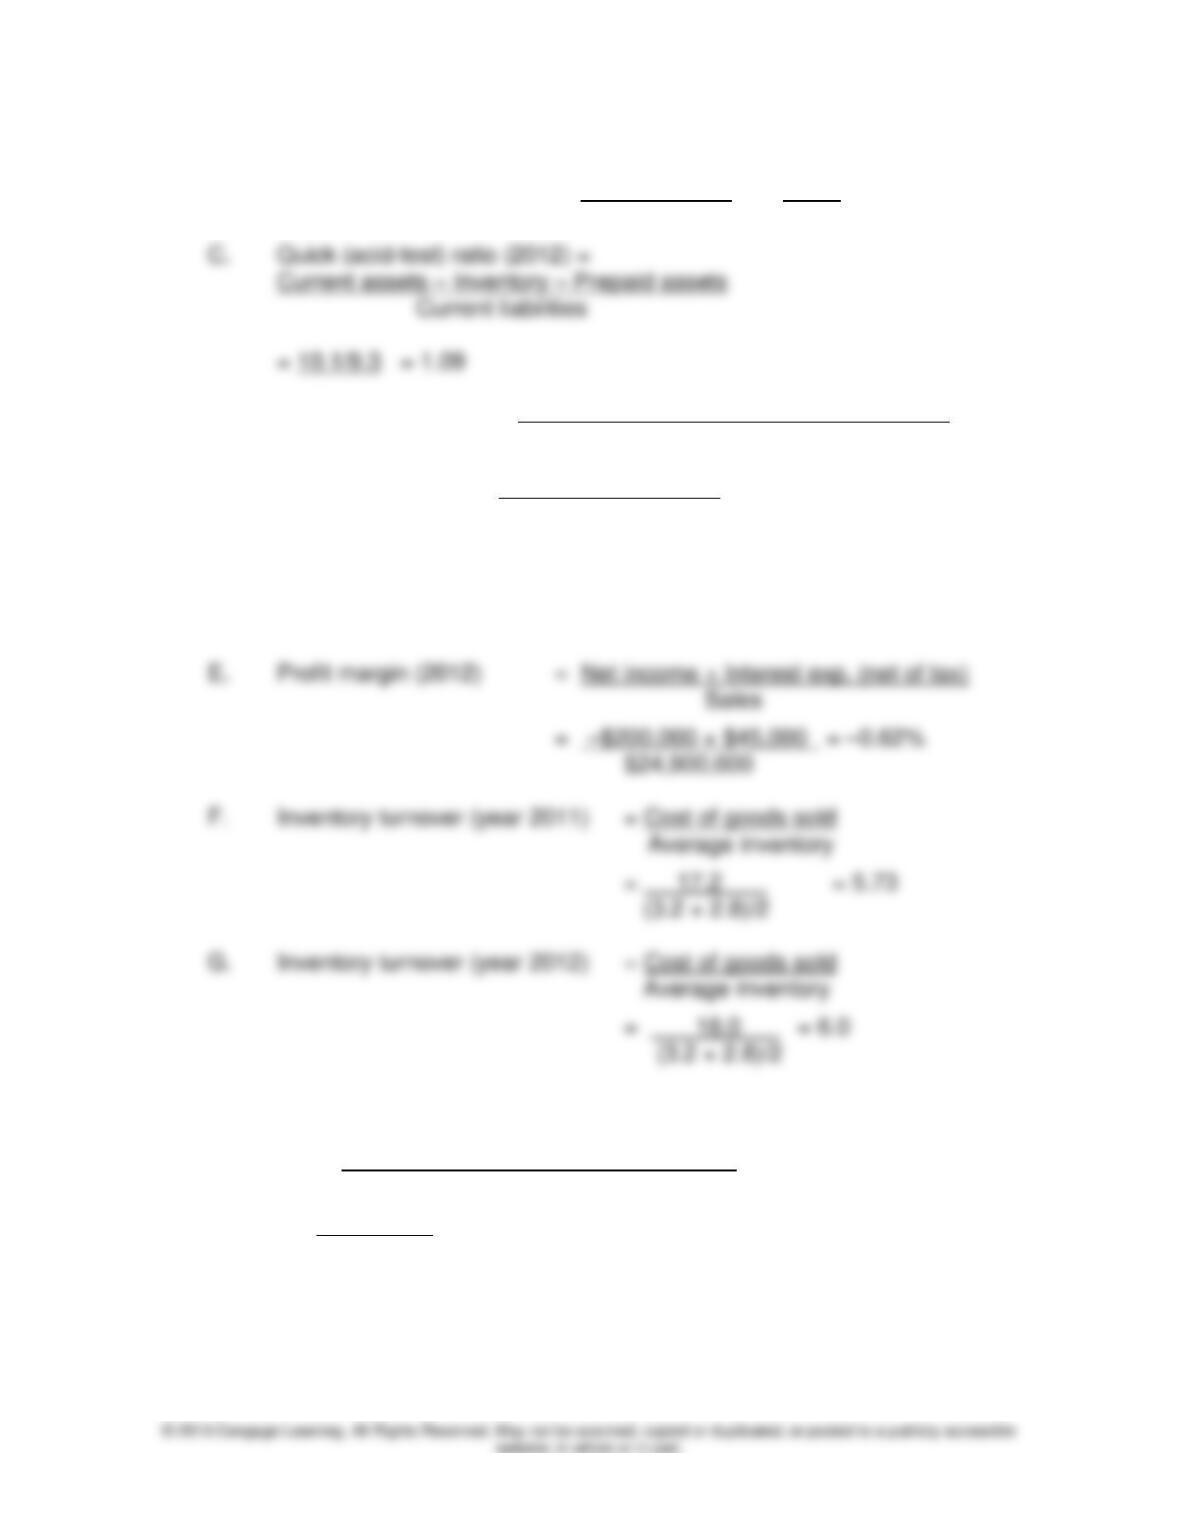
A. ROA (2012) = Net income + Interest expense (net of taxes)
Chapter 12: Financial Statement Analysis
12–13
B. Current ratio (2012) = Current assets = $13.5 = 1.45
Current liabilities $9.3
D. Profit margin (2011) = Net income + Interest expense (net of tax)
Sales
= $300,000 + $90,000* = 1.59%
$24,500,000
* 6% × $2.5 million average balance =
$150,000 interest expense × (1 – 0.4 tax rate) = $90,000
H. Rate of return on stockholders’ equity (year 2011)
= Net income – Preferred dividend
Average common stockholders’ equity
= 0.3 + 0 = 3.31%
(8.9 + 9.2)/2
Solutions Manual
12–14
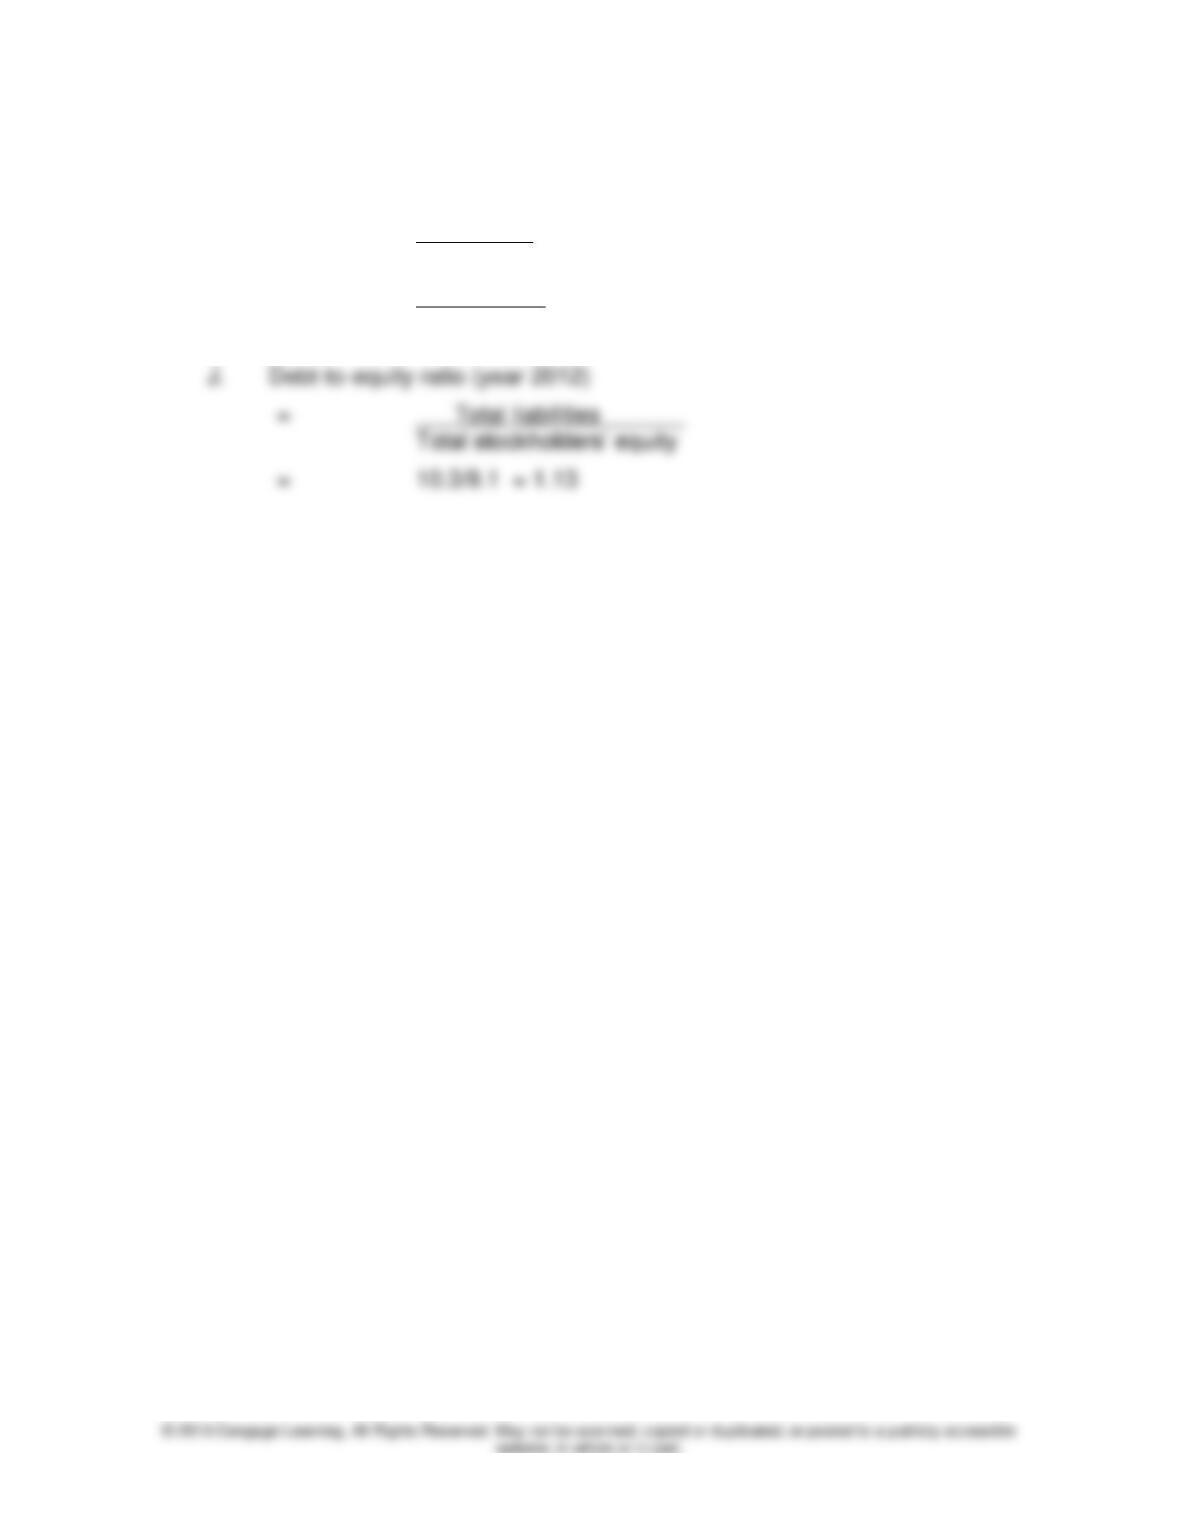
I. Rate of return on stockholders’ equity (year 2012)
= Net income
Average common stockholders’ equity
= –0.2 = –2.19%
(9.2 + 9.1)/2