Management Information Systems, 13TH ED.
MANAGING THE DIGITAL FIRM
Kenneth C. Laudon ● Jane P. Laudon
continued
Learning Track 1: Building and Using Pivot Tables
Spreadsheet software is useful for helping managers detect and understand patterns in data.
For instance, let’s a take a look at one day’s worth of transactions at an online firm, Online
Management Training Inc. (OMT Inc.), that sells online management training books and stream-
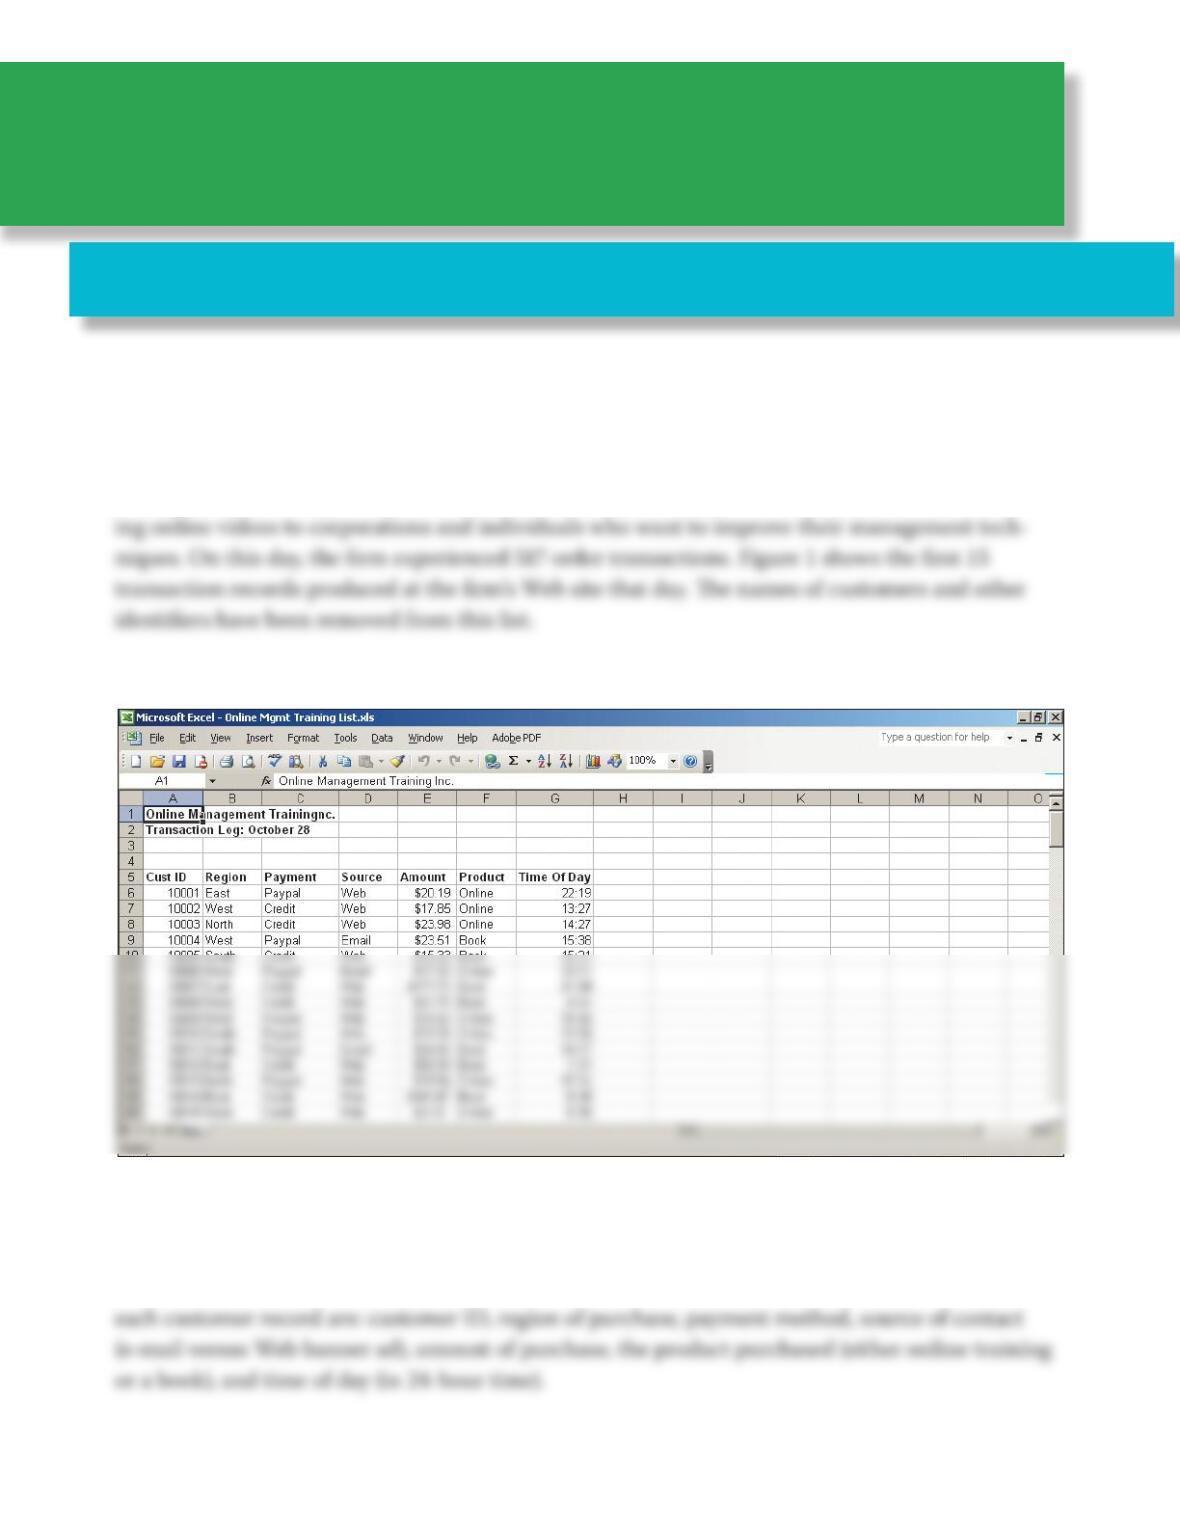
FIGURE 1 Sample List of Transactions for Online Management Training Inc.
This list shows a portion of the order transactions for Online Management Training Inc. (OMT Inc.) on
October 28, 2013.
You can think of this list as a database composed of transaction records (the rows). e fields for
Chapter 12: Enhancing Decision Making

Chapter 12 Learning Track 1 2
ere’s a great deal of valuable information in this transaction database that could help managers
answer important questions and make important decisions:
◆ Where do most of our customers come from? e answer might tell managers where to spend
more marketing resources, or to initiate new marketing eorts.
◆ Where are the average purchases higher? e answer might tell managers where to focus
marketing and sales resources, or pitch dierent messages to dierent regions.
◆ What form of payment is the most common? e answer could be used to emphasize in adver–
Microsoft Excel spreadsheet software oers many tools that are helpful in answering these kinds of
questions. If the list was small, you could simply inspect the list and try to get a sense of patterns
in the data. But this is impossible when you have a list of over 500 transactions. Notice that these
questions often involve two dimensions: region and average purchase, time of day and average
purchase, payment type and average purchase. But the last question is more complex because it has
three dimensions: region, source of customer, and purchase.
You could use Excel’s charting capabilities, such as a bar chart, to answer some of these ques-
tions, but this would require you to sort the transactions on one dimension, calculate an average
Chapter 12 Learning Track 1 3
continued
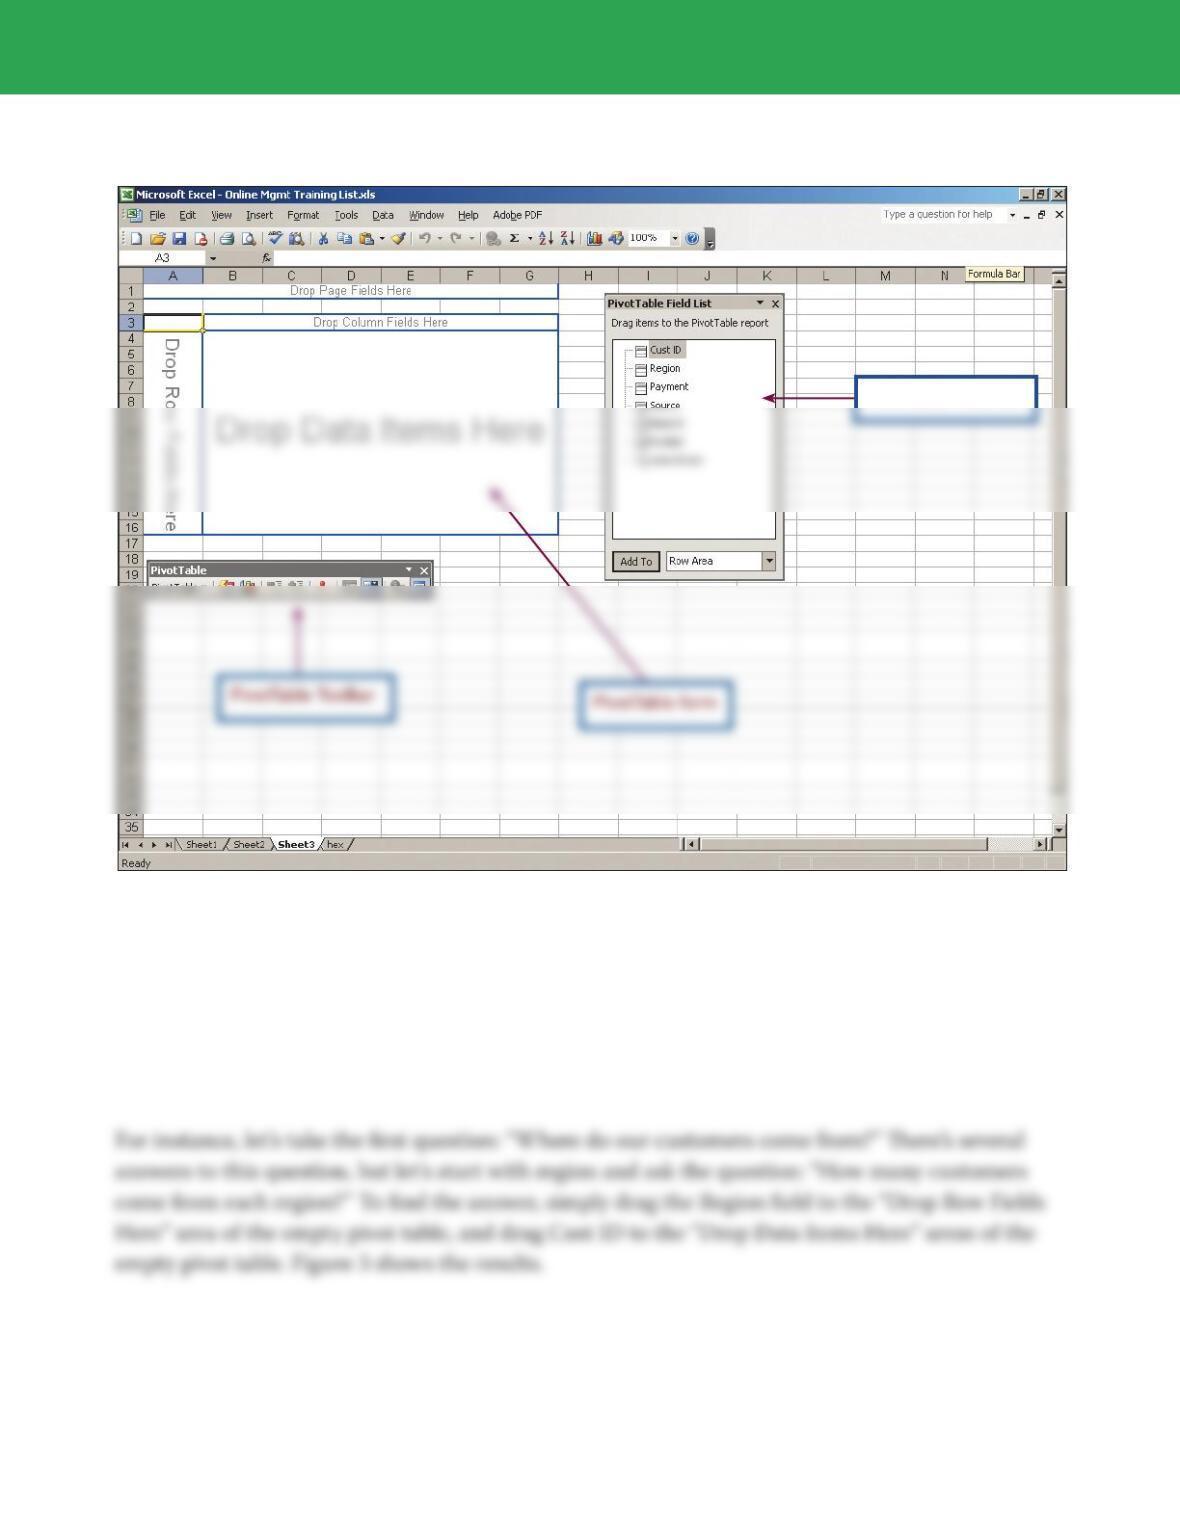
FIGURE 2 The Excel PivotTable Wizard
The PivotTable Wizard in Excel makes it easy to analyze lists and databases by simply dragging and drop–
ping elements from the Field List to the PivotTable area.
e PivotTable Wizard has three elements: an empty PivotTable with labels for rows, columns, and
data areas; a PivotTable Field List which lists the fields in your list or database; and a PivotTable
Toolbar. By dragging and dropping the fields you want to look at in your pivot table, you can
analyze this list quickly, and arrive at decisions quickly.
PivotTable Field List
Chapter 12 Learning Track 1 4
continued
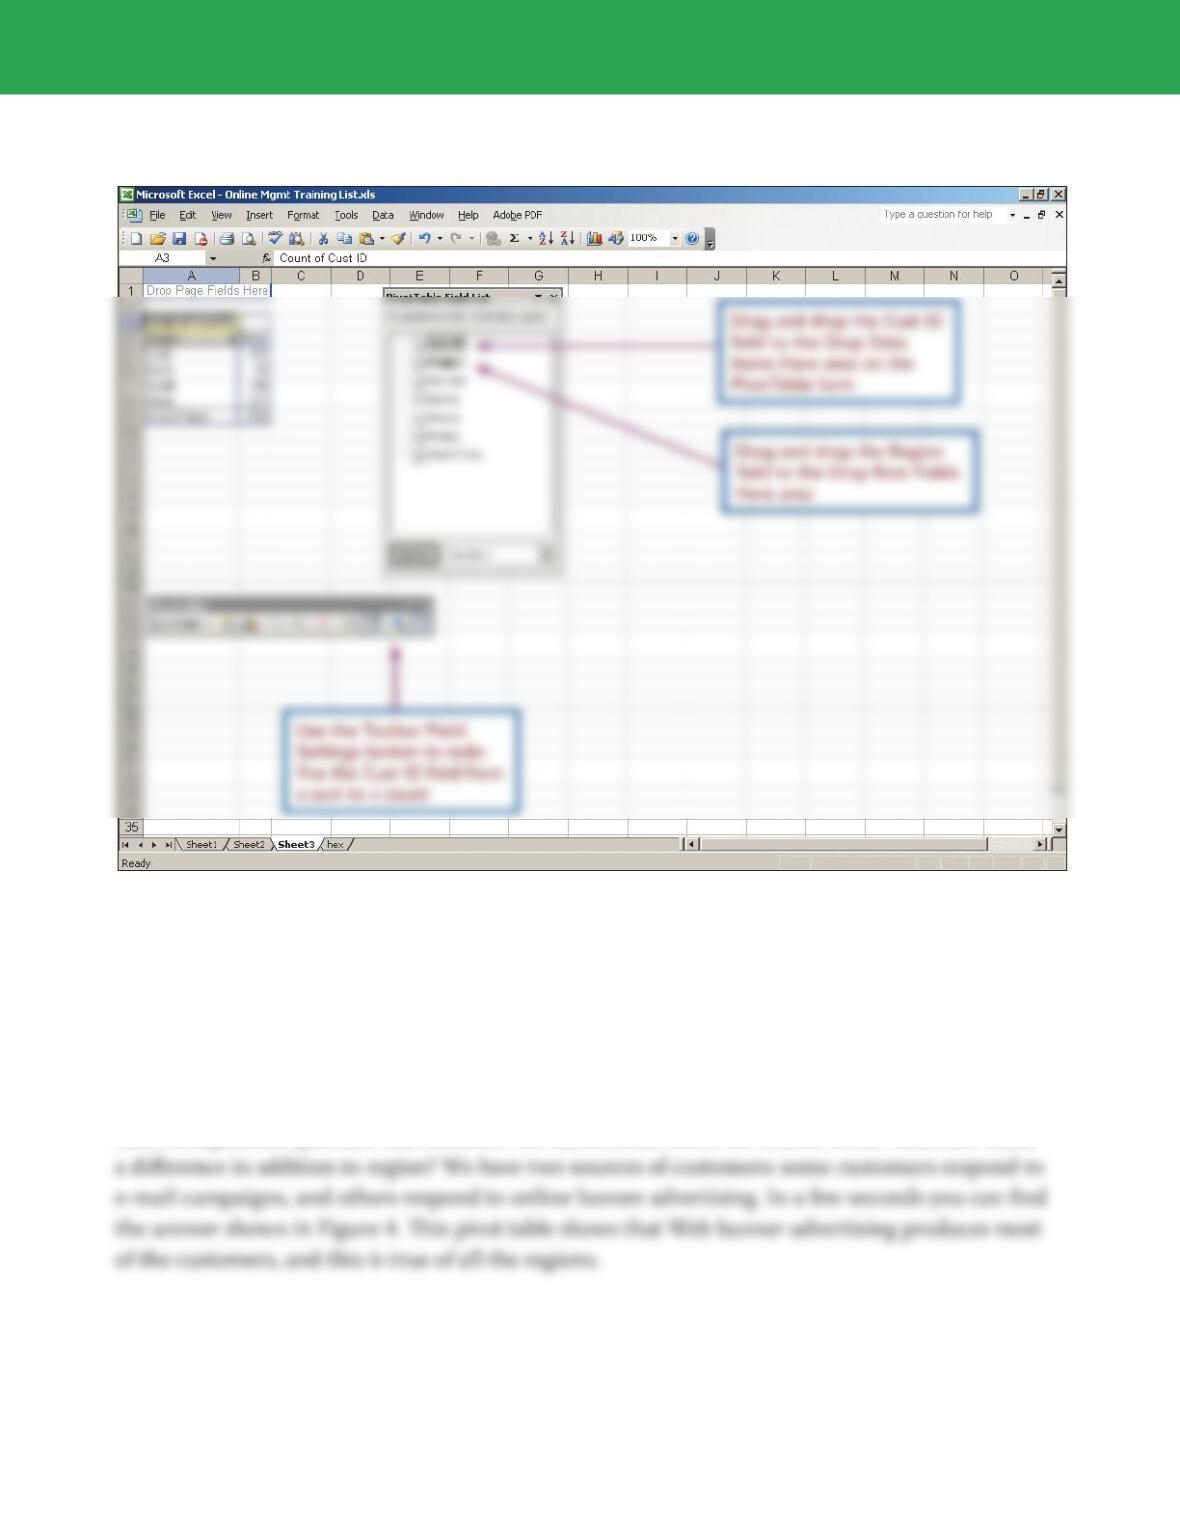
FIGURE 3 A Pivot Table That Quickly Determines the Regional Distribution of Customers
By dragging and dropping fields to row and data areas of the pivot table form, you can quickly produce a
table showing the relationship between region and number of customers. You will need to use the Field
Settings button on the Toolbar to produce this table in order to redefine the Cust ID field as a count
rather than a sum so Excel reports the number of customers, not the sum of their customer IDs, which
would be meaningless.
e PivotTable shows most of our customers come from the Western region. So far we’ve looked
at a single dimension, region, in understanding where our customers come from. Now let’s take a
more complicated question that involves two dimensions: Does the source of the customer make
Chapter 12 Learning Track 1 5
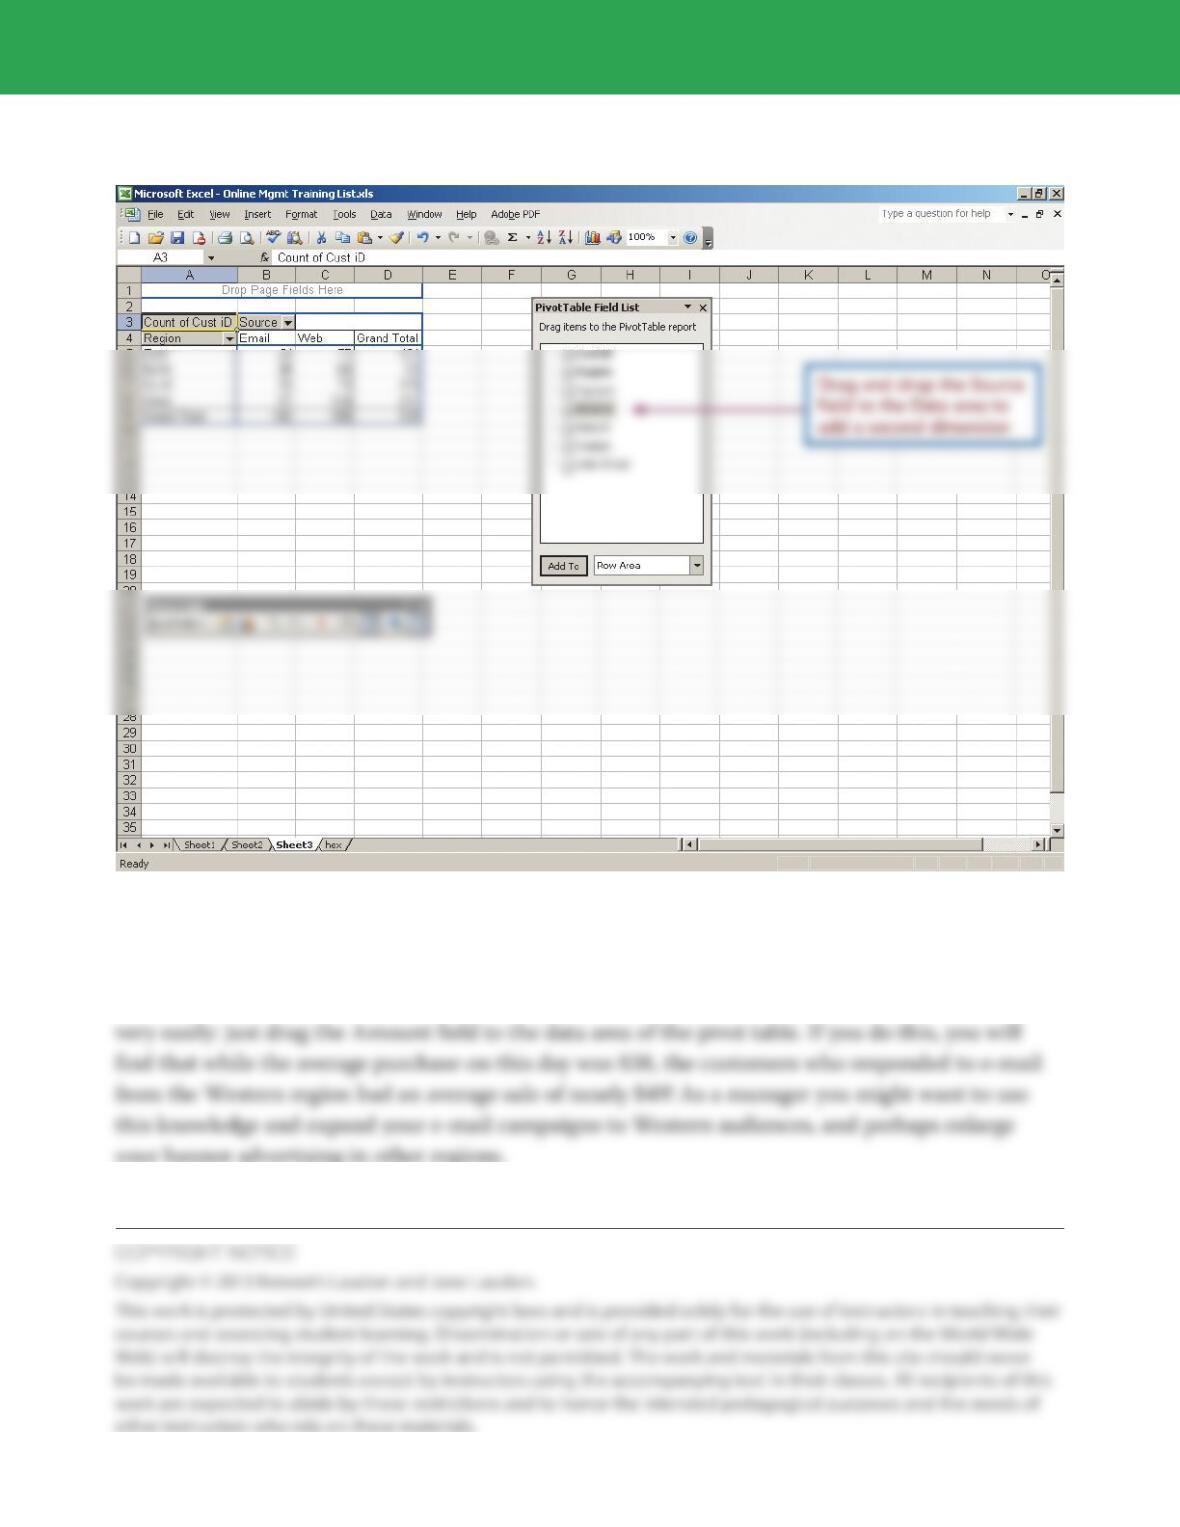
FIGURE 4 A Pivot Table That Examines Two Dimensions
In this pivot table, we can examine where our customers come from in terms of two dimensions: region
and advertising source. It appears nearly 40 percent of the customers respond to e-mail campaigns, and
there are some regional variations in this theme.
Could we analyze the average amount of the purchase to the table in Figure 4? e answer is yes,