41
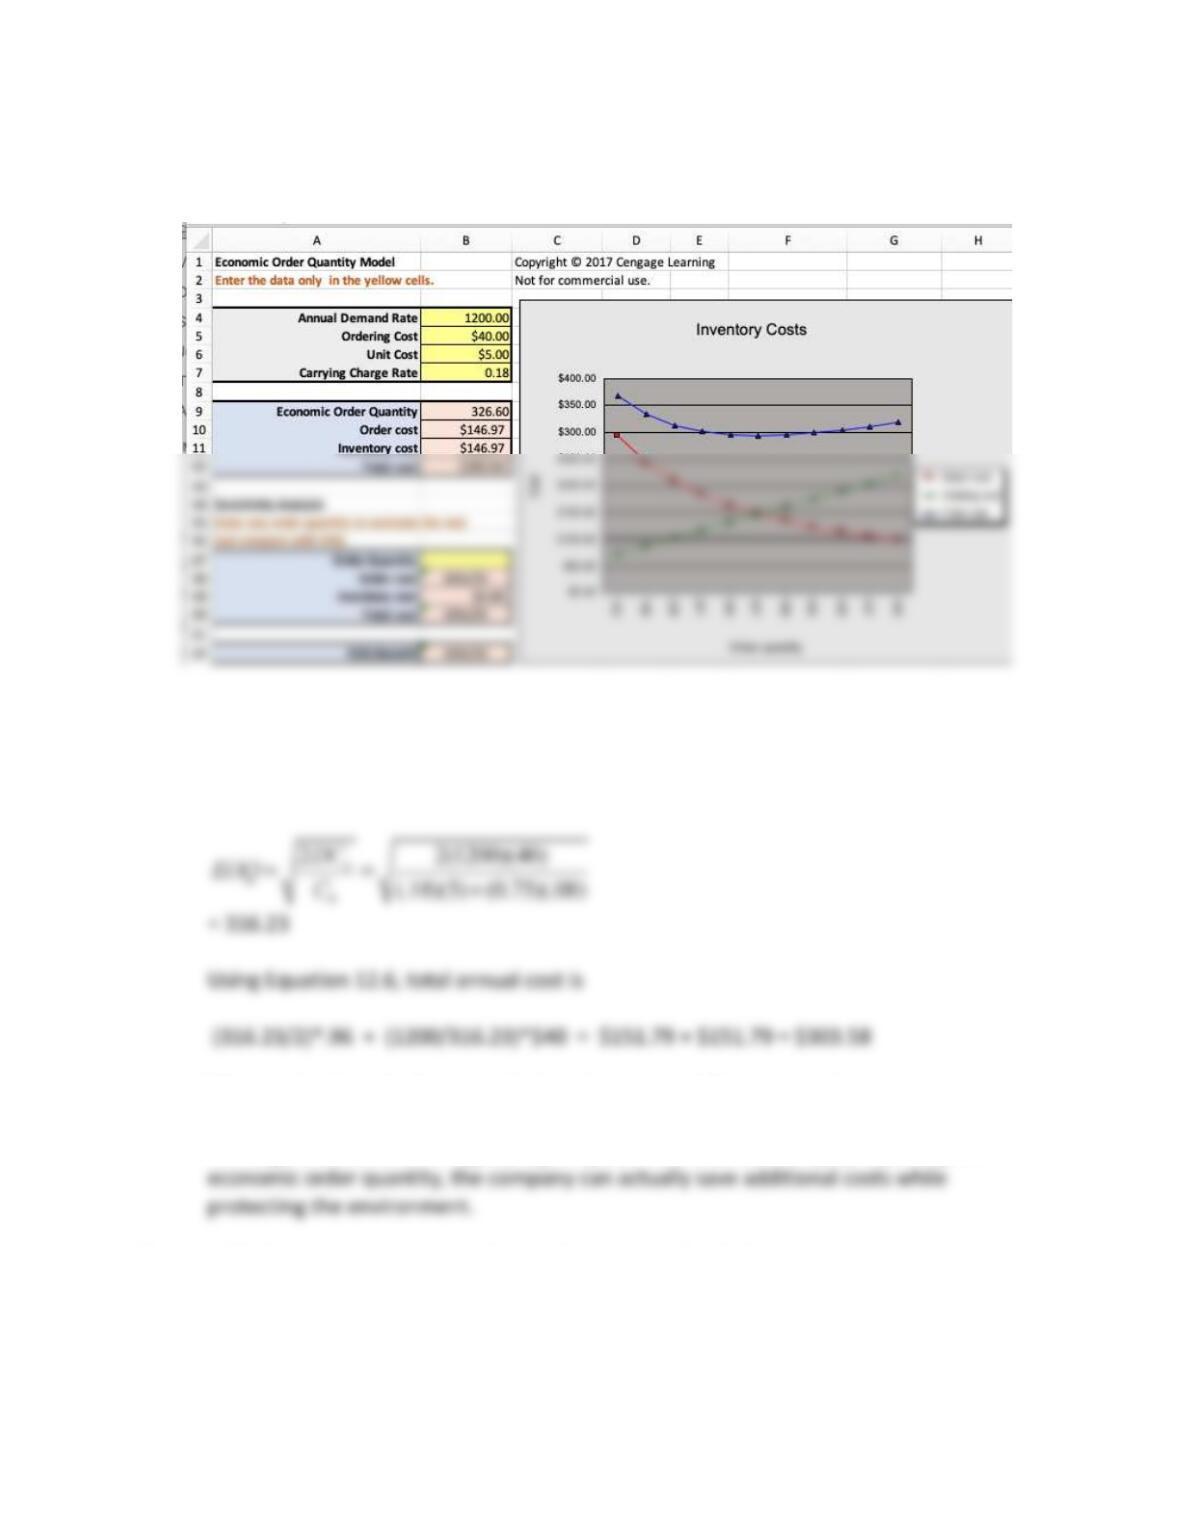
= 326.6
b. Now assume that eight percent of the chemical is not used and disposed of, with a
disposal cost of $0.75/lb. Find the EOQ and total cost when disposal costs are
incorporated into the model. (Hint: Add to the holding cost the disposal cost times the
percent of product that is disposed of. This calculation must be done manually.)
c. What implications do these results have for sustainability practices?
Although the total cost is slightly higher ($303.58 versus $293.94), by adjusting the
71. High Tech, Inc. is a virtual store that stocks a variety of cell phones in their warehouse.
Customer orders are placed, picked and packaged, and then shipped to the customer. A
fixed-order quantity inventory-control system (FQS) helps monitor and control these SKUs.
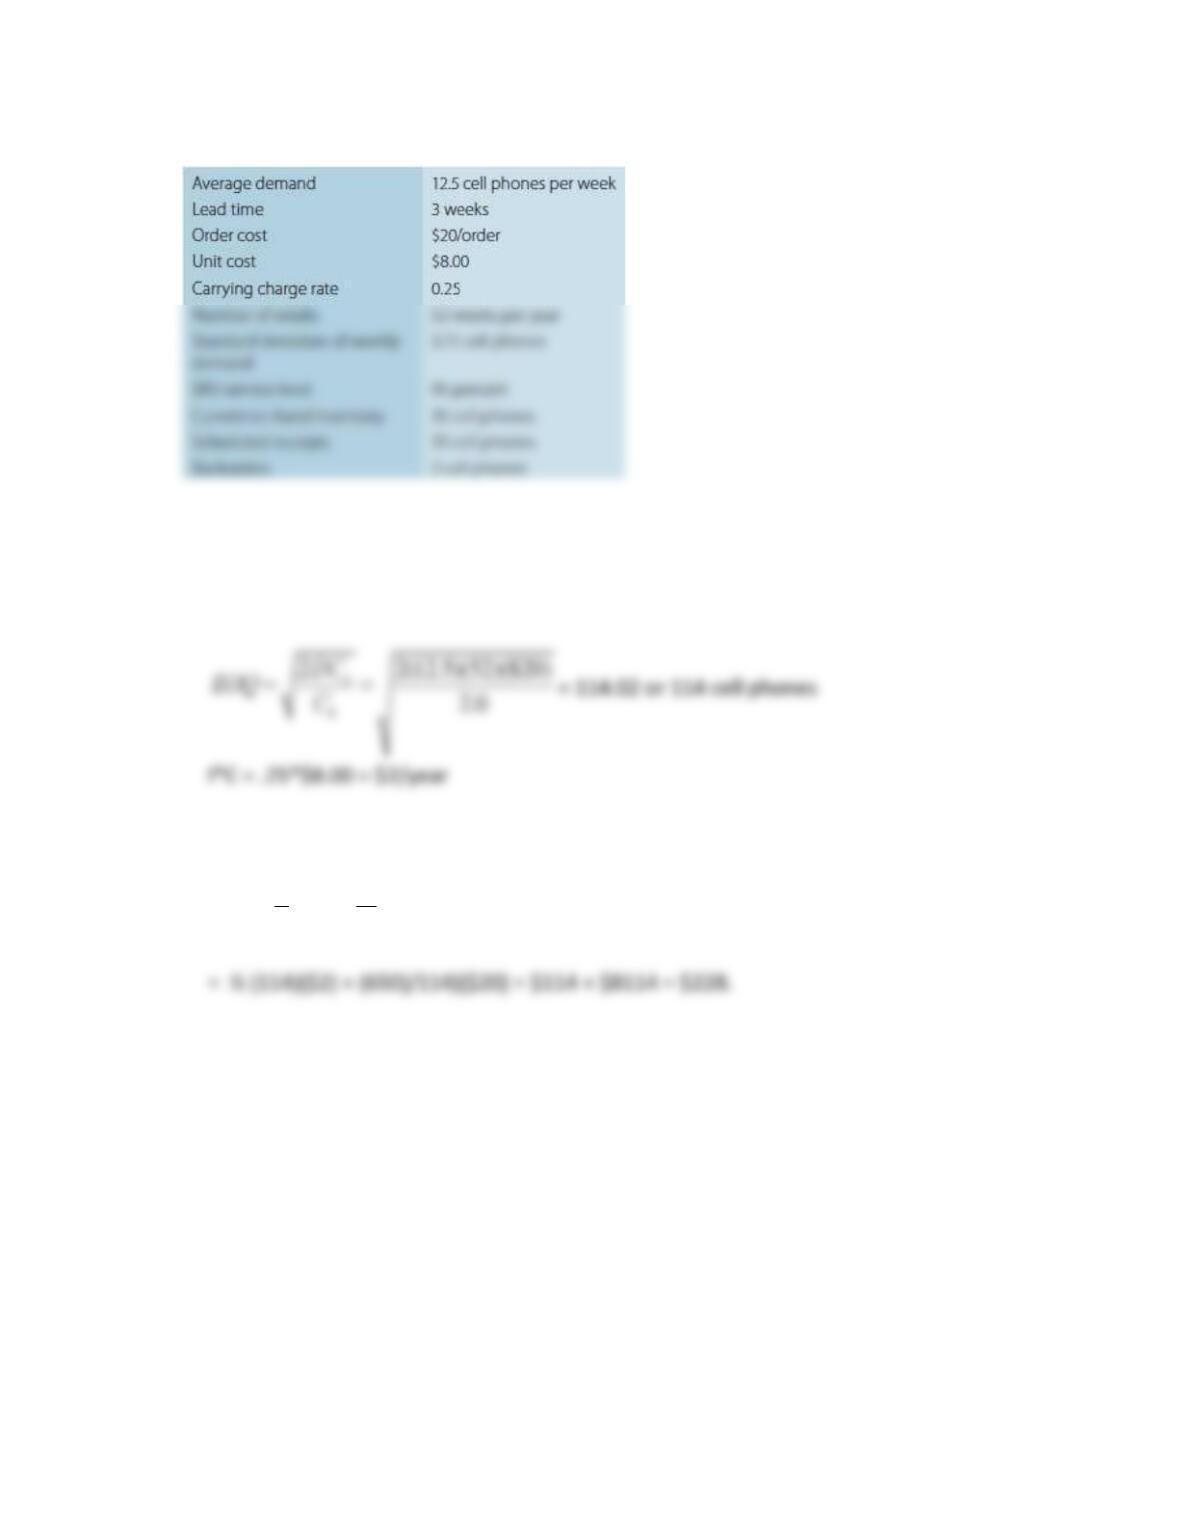
The following information is for one of the cell phones that they stock, sell, and ship.
42
Use the EOQ Model or FQS Safety Stock Excel templates in MindTap, as appropriate, to
answer the following:
a. What is the economic order quantity?
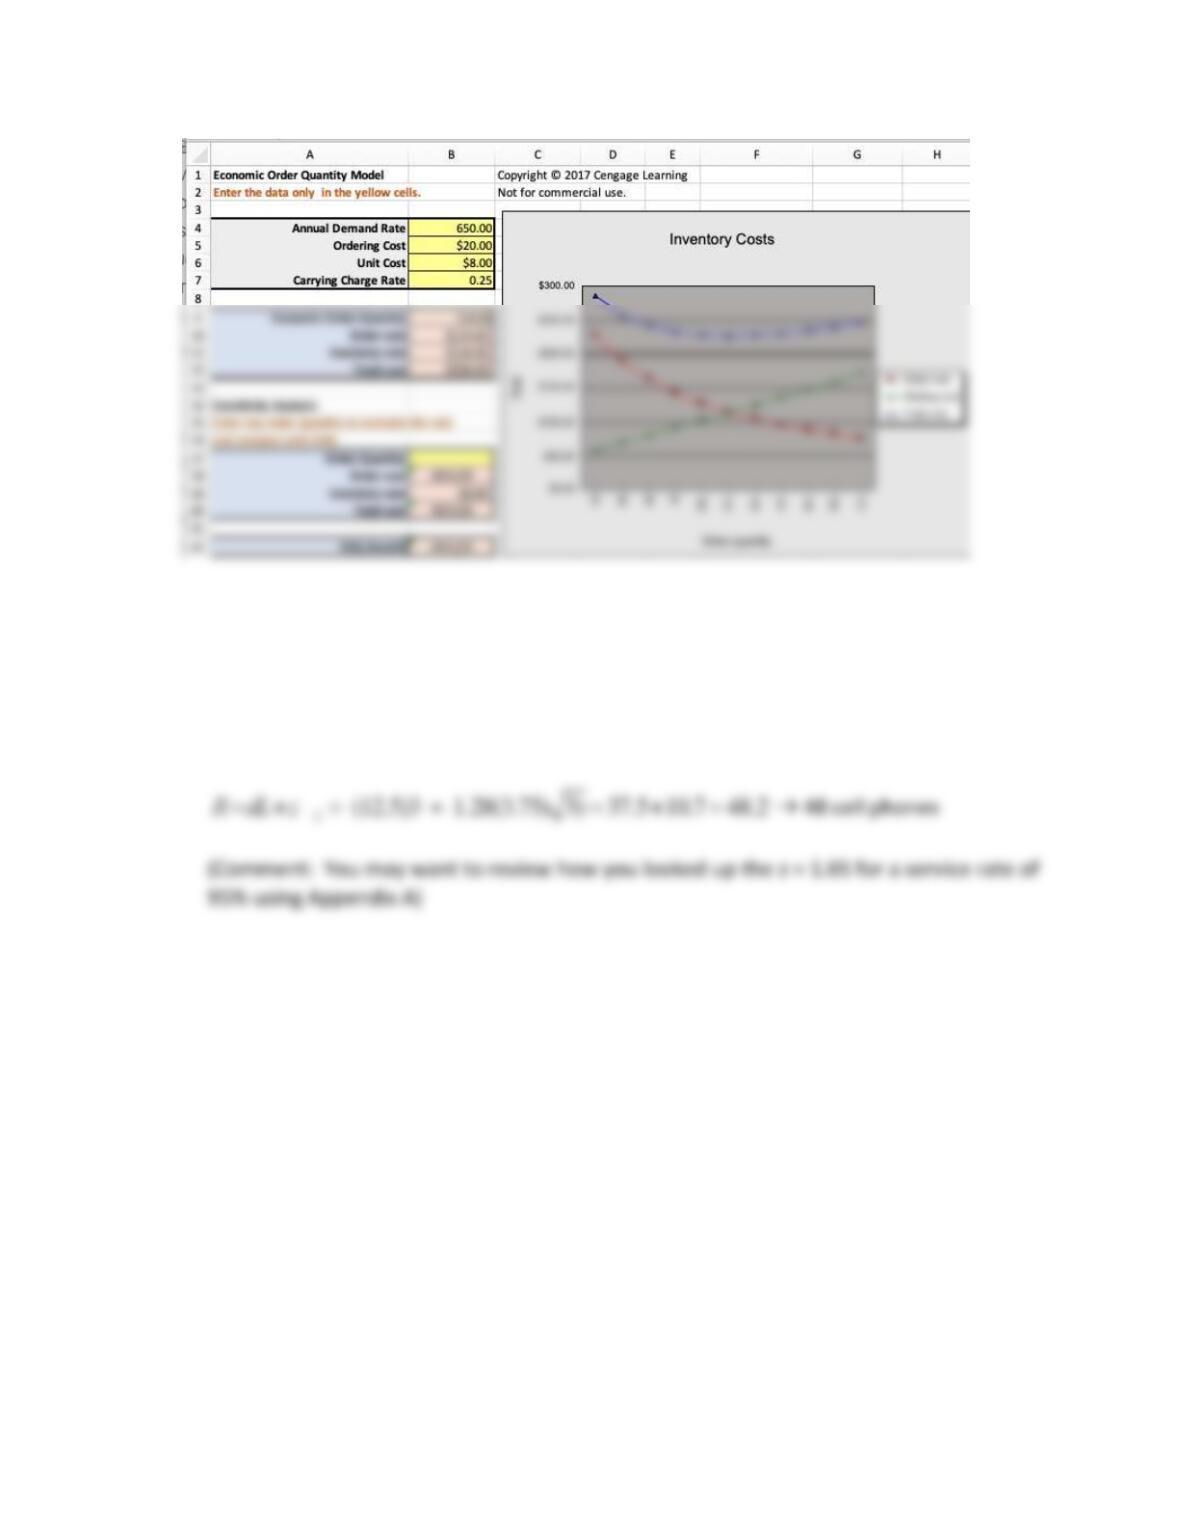
b. What are the total annual order and inventory-holding costs for the EOQ?
TC =1
2QCh+D
QCo
43
c. What is the reorder point without safety stock?
R=dL = (12.5)3 =37.5
→
38 cell phones
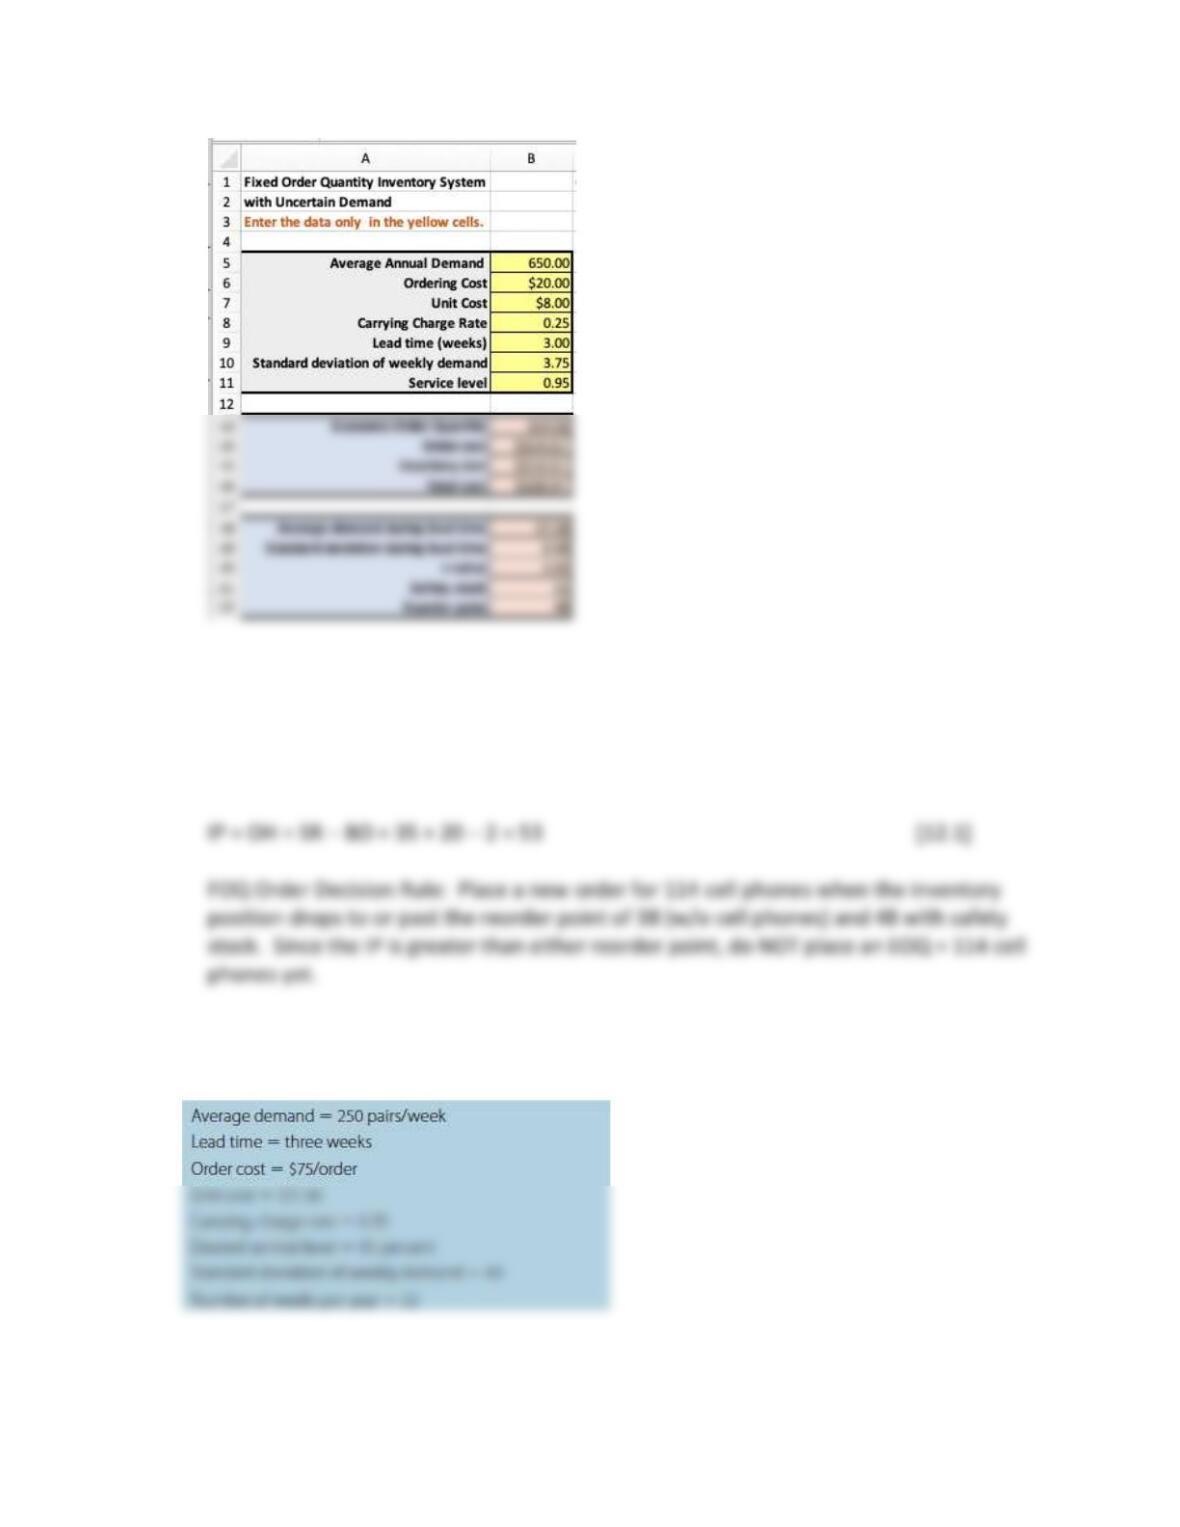
d. What is the reorder point with safety stock?
→
44
e. Based on the previous information, should a fixed-order quantity be placed, and if so,
for how many cell phones?
Inventory position (IP) is defined as the on-hand quantity (OH) plus any orders placed
but which have not arrived (called scheduled receipts, SR), minus any backorders (BO), or
72. Berta’s Shoe Company is considering a change of their current inventory-control system for
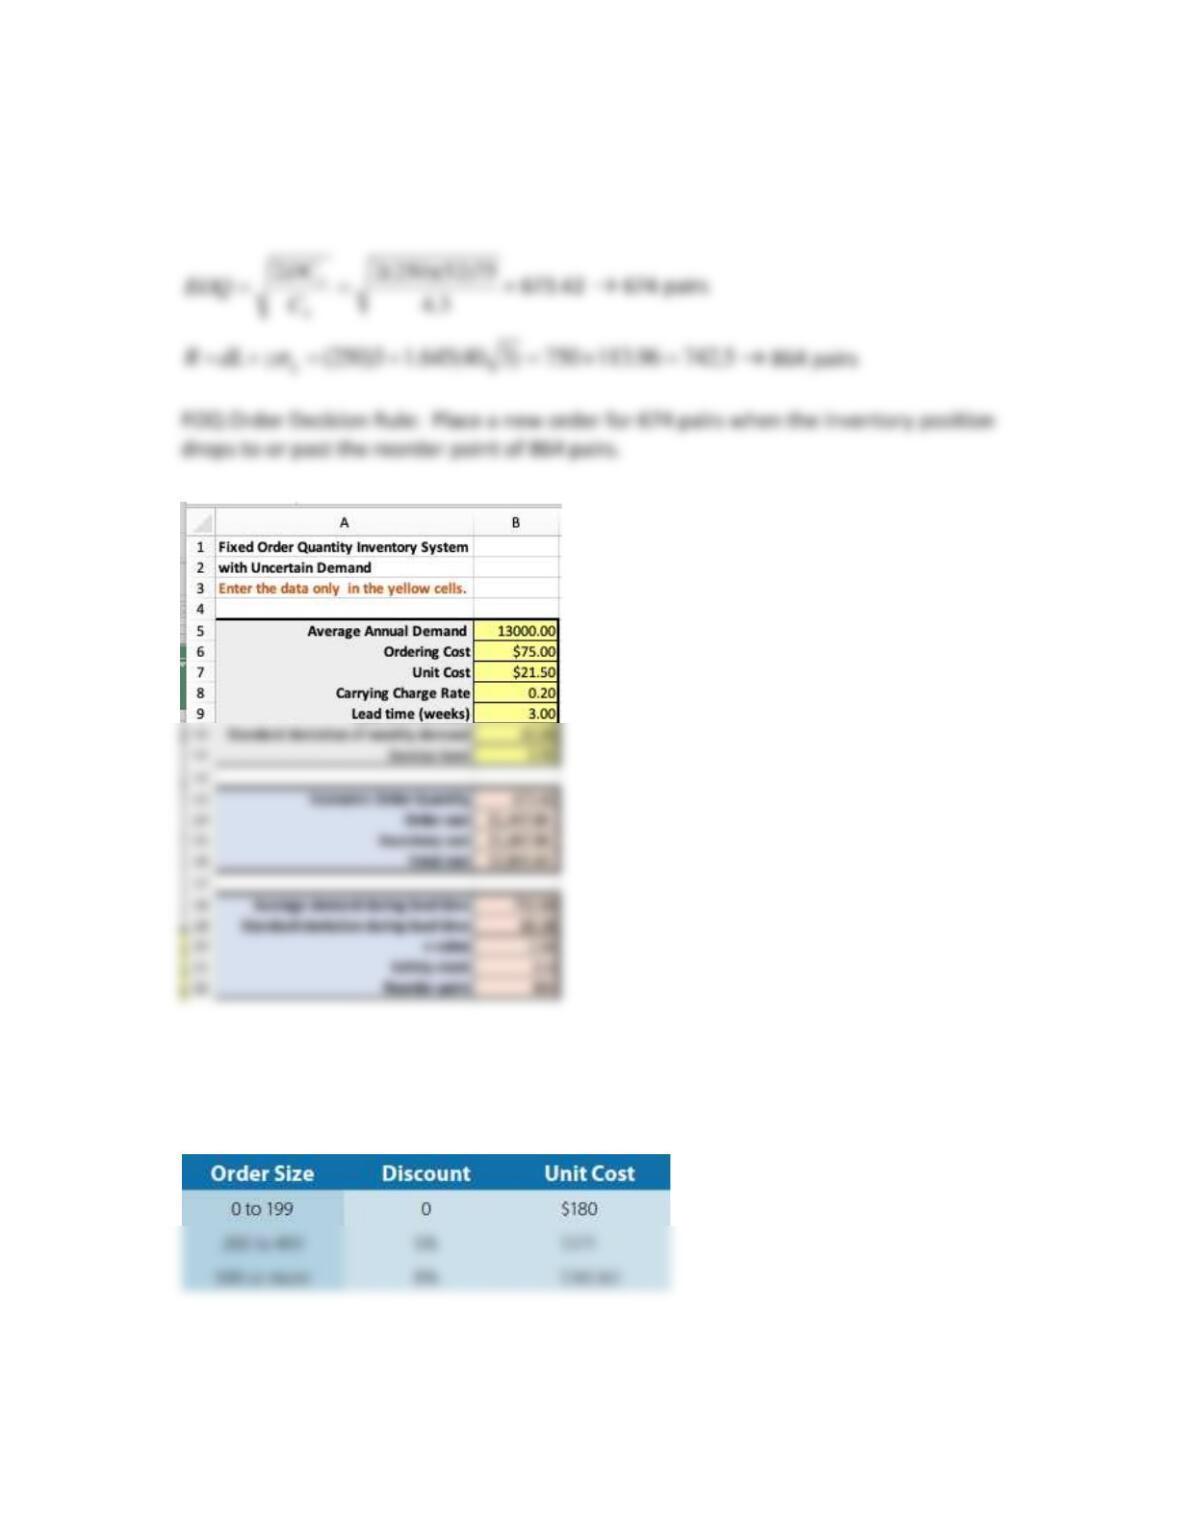
soccer shoes. The information regarding the shoes is given below.
45
The company decides to use a fixed-order-quantity system. Use the FQS Safety Stock Excel
template in MindTap to find the economic order quantity and reorder point to provide a 95
percent service level. Explain how the system will operate.
73. Handyman Hardware orders power mowers from a major Midwestern manufacturer. The
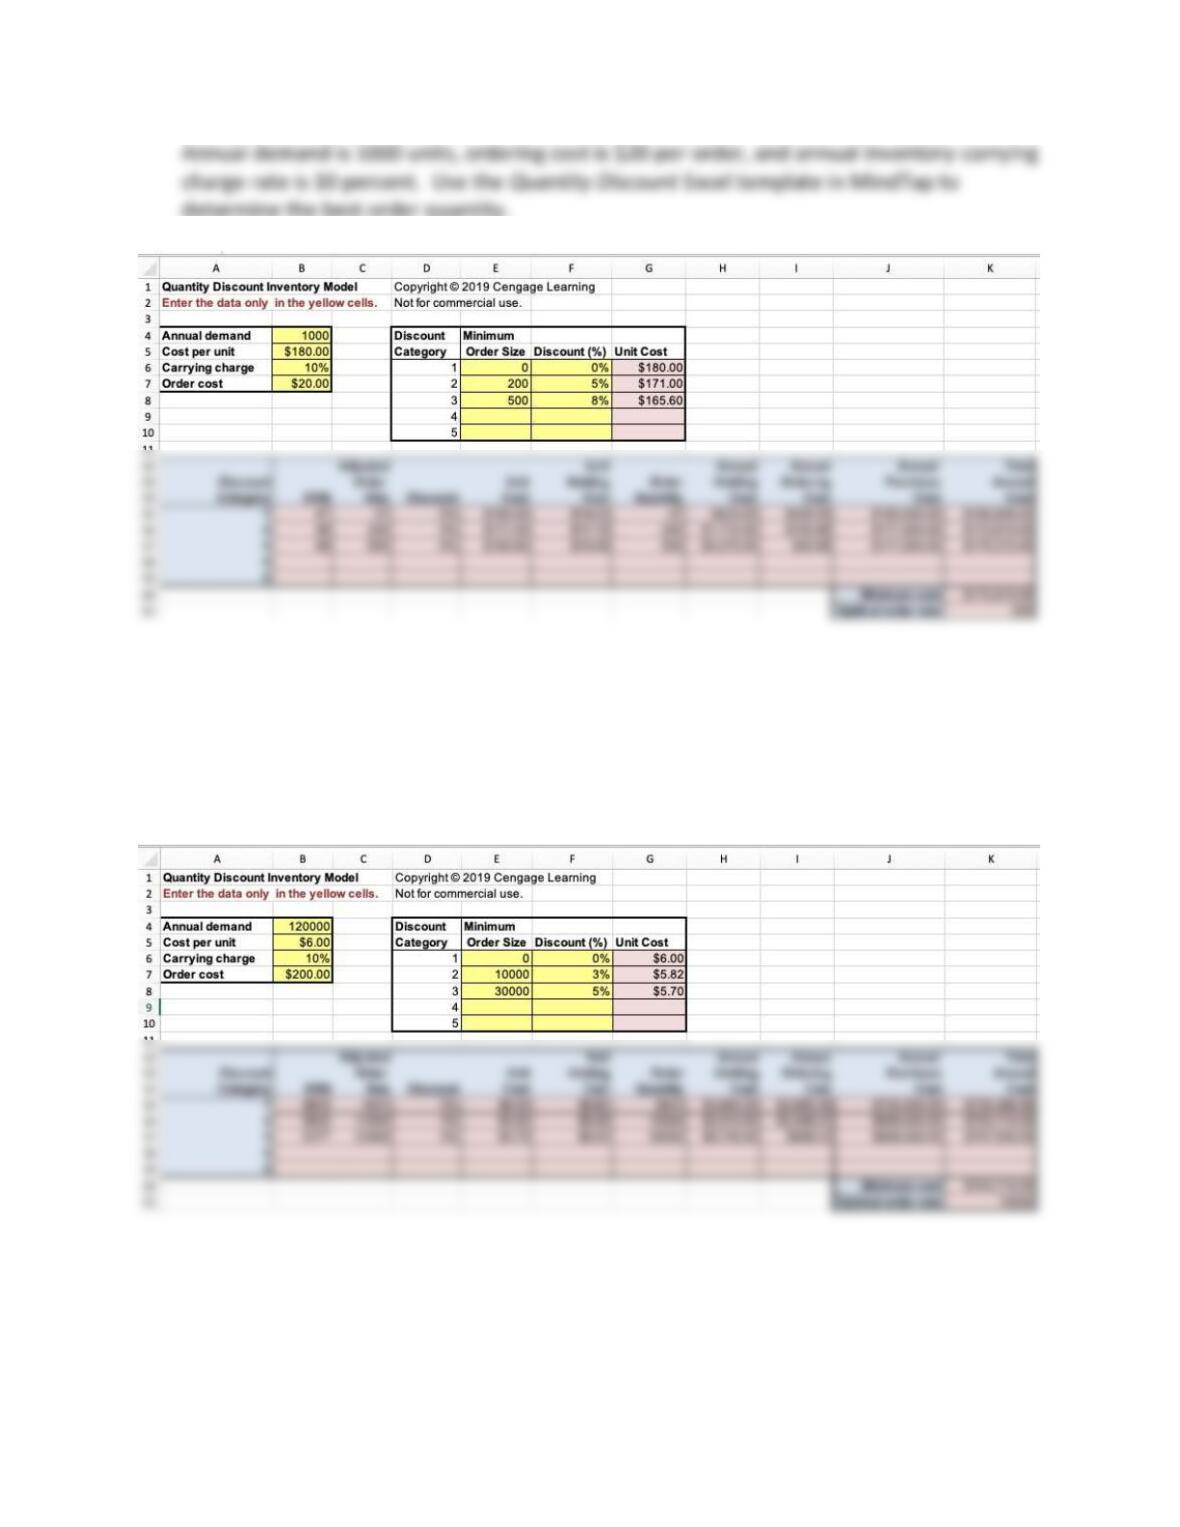
following quantity discount schedule applies to 21-inch, self-propelled, electric start power
mowers:
46
74. A manufacturer procures a subassembly from a supplier. The annual demand is 120,000
units, cost per unit is $6, inventory-carrying charge is 10 percent, and the order cost is
$200. For orders between 10,000 but less than 30,000, a three percent discount is applied,
and for orders exceeding 30,000, a five percent discount is applied. What is the optimal
order quantity? Use the Quantity Discount Excel template in MindTap to find your answer.
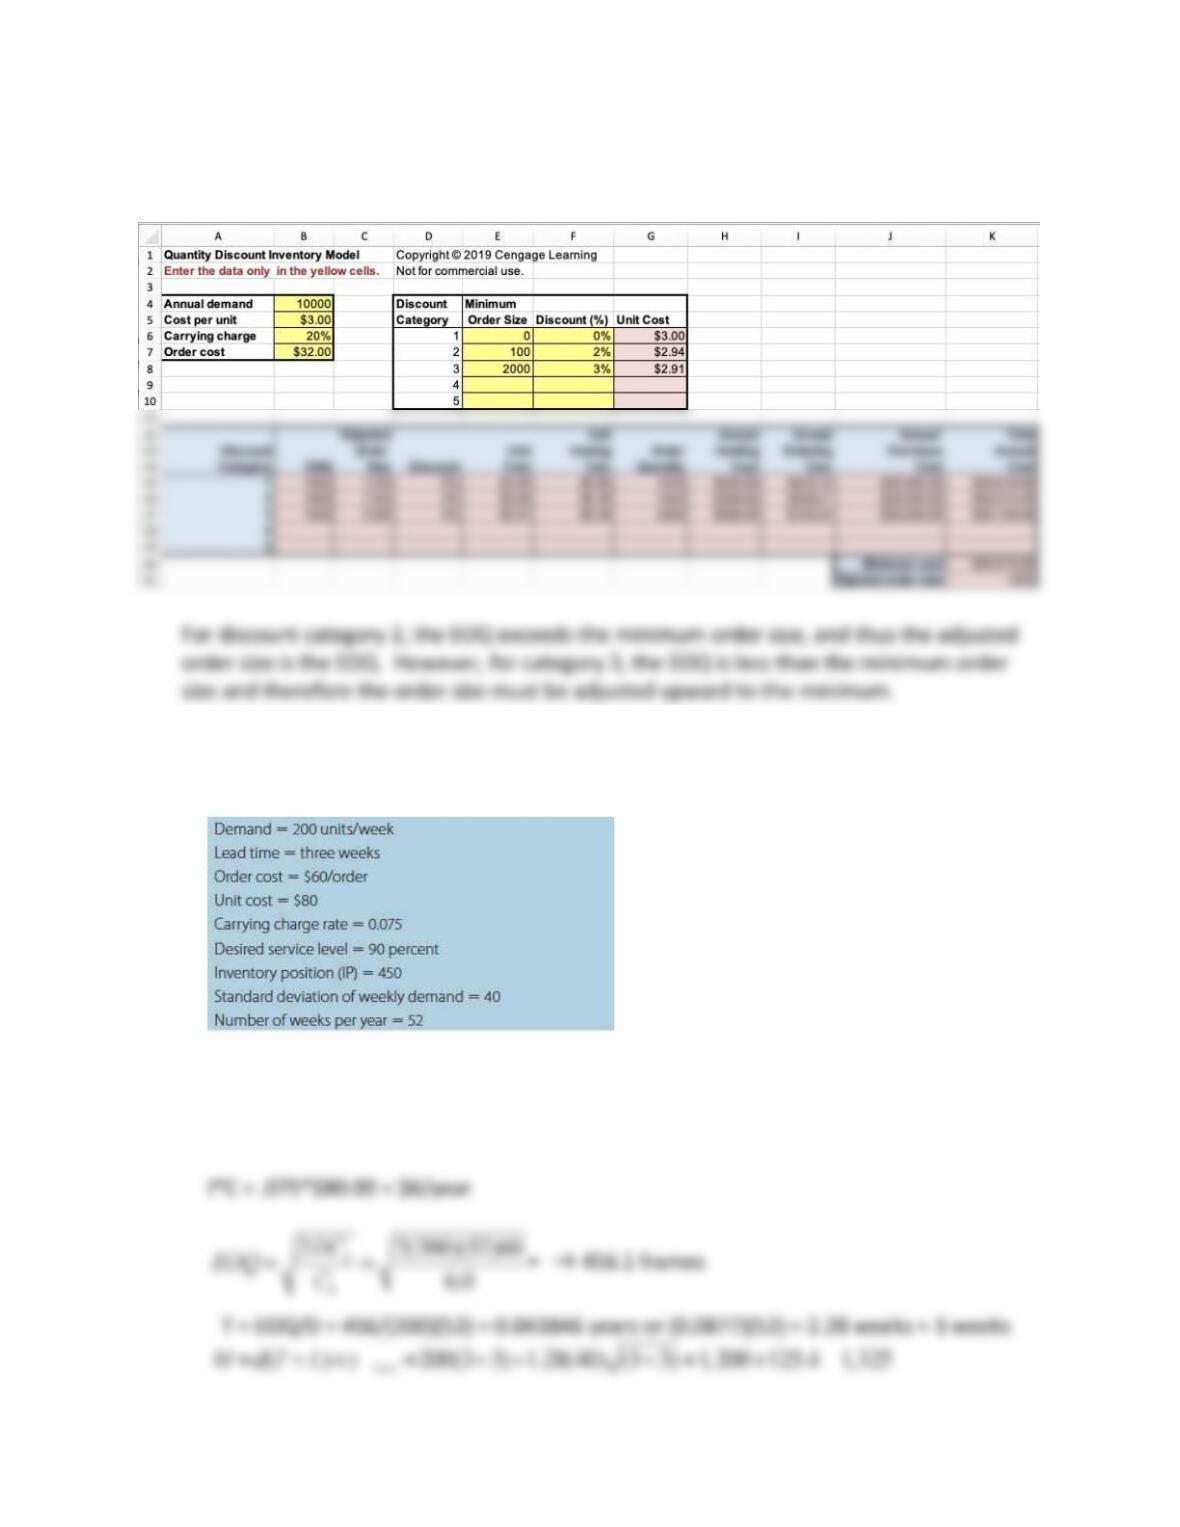
75. Find the optimal order quantity for an annual demand of 10,000 units, a cost per unit of
$3, an inventory-carrying charge rate of 20 percent, and an order cost of 32 percent. For
orders between 100 and 1999 units, the supplier gives a two percent discount, and for
orders of 2000 units or more, the supplier gives a three percent discount. Use the Quantity
47
Discount Excel template in MindTap to find the optimal order size and explain how the
adjusted order sizes for the discount categories were determined.
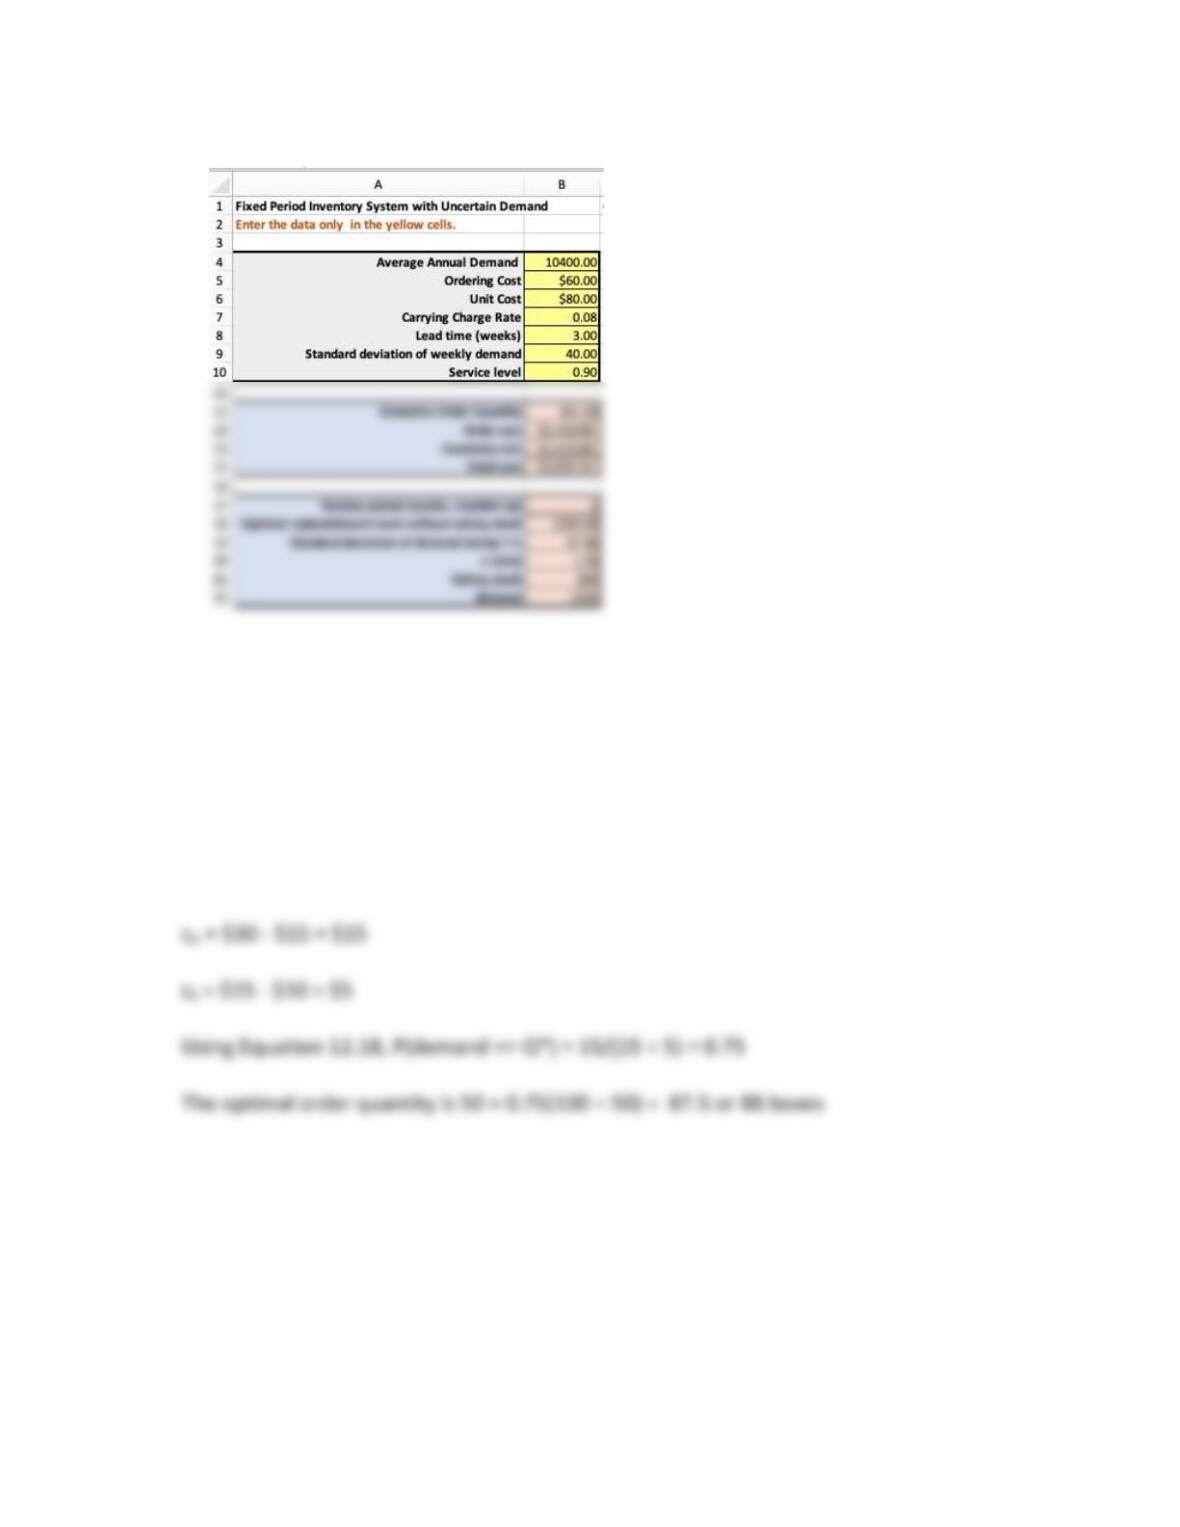
76. The Greyhound Company is considering changing its current inventory-control system
for electronic picture frames. The information regarding one e-frame is given below.
Use the FPS Safety Stock Excel template in MindTap to compute T and M for a fixed-
period T and M for a fixed period inventory system model with and without safety
stock. Explain how this system would operate.
48
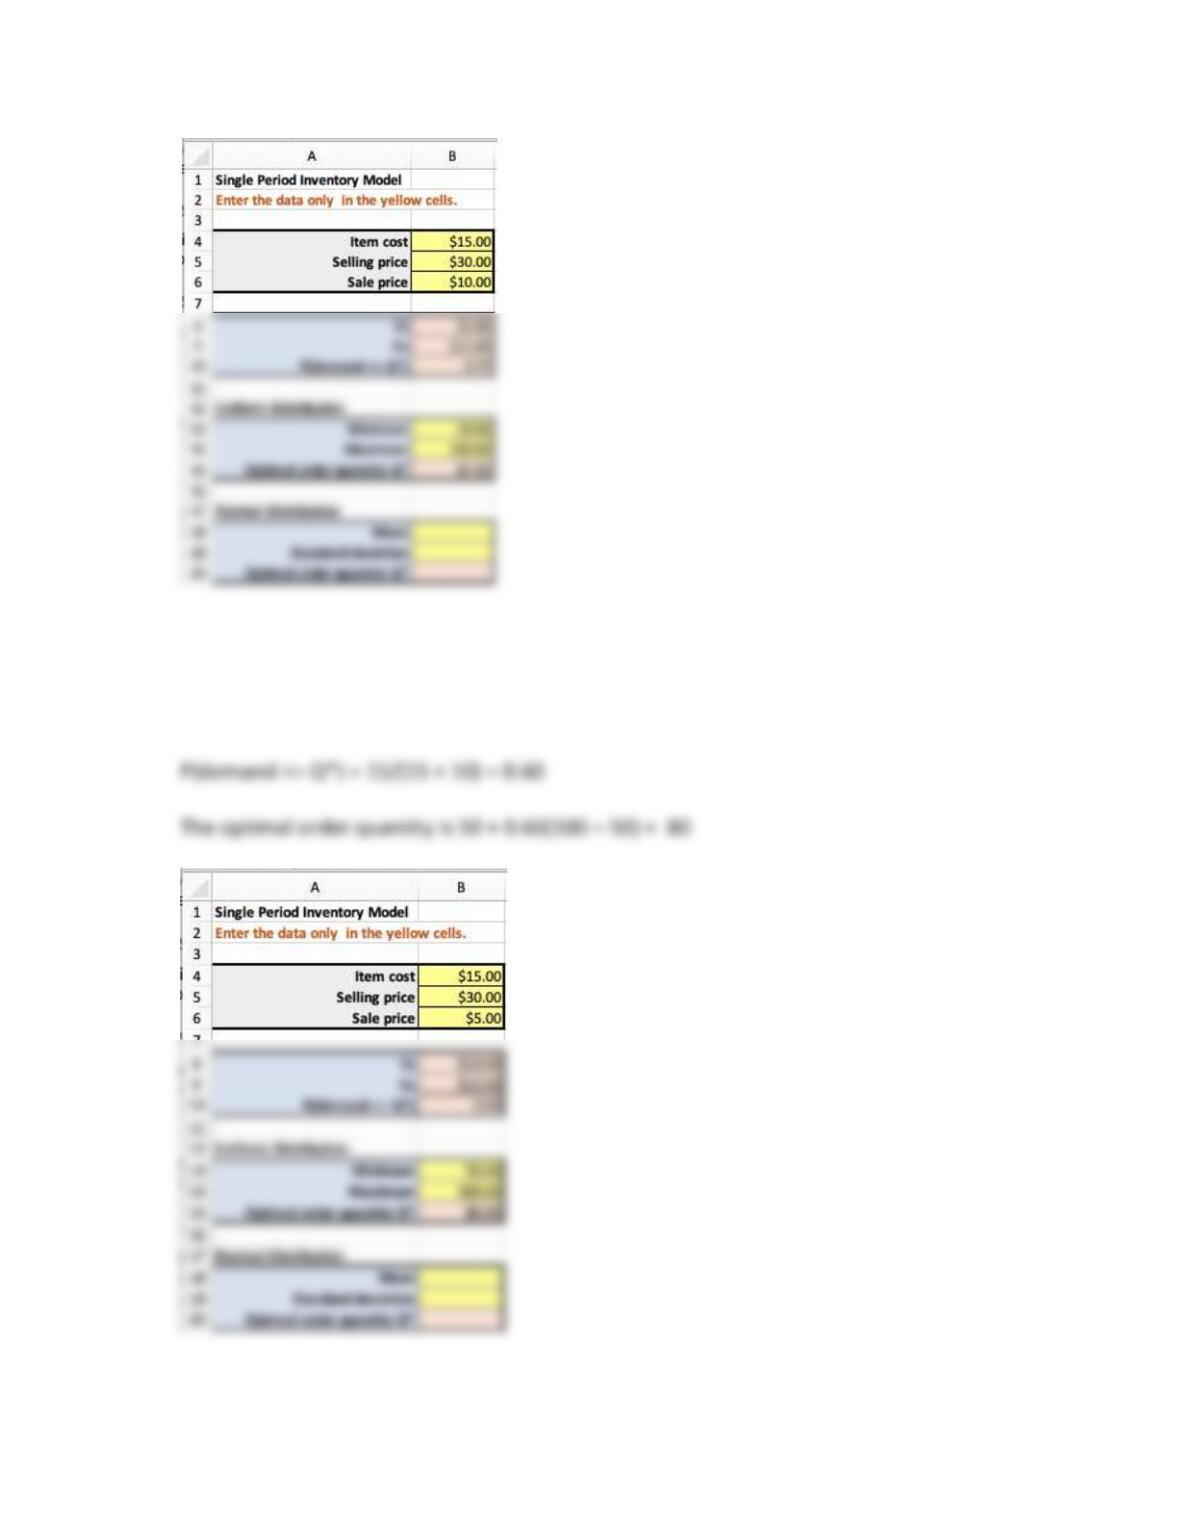
77. Suzie’s Sweetshop makes special boxes of Valentine’s Day chocolates. Each costs $15 in
material and labor and sell for $30. After Valentine’s Day, Suzie reduces the price to $10.00
and sells any remaining boxes. Historically, she has sold between 50 and 100 boxes.
Determine the optimal number of boxes to make using the Single Period Inventory Excel
template in MindTap. How would her decision change if she can only sell all remaining
boxes at a price of $5?
Assuming sales are between 50 and 100 boxes, we have a uniform distribution between 50
and 100. For a sale price of $10.00 we have:
49
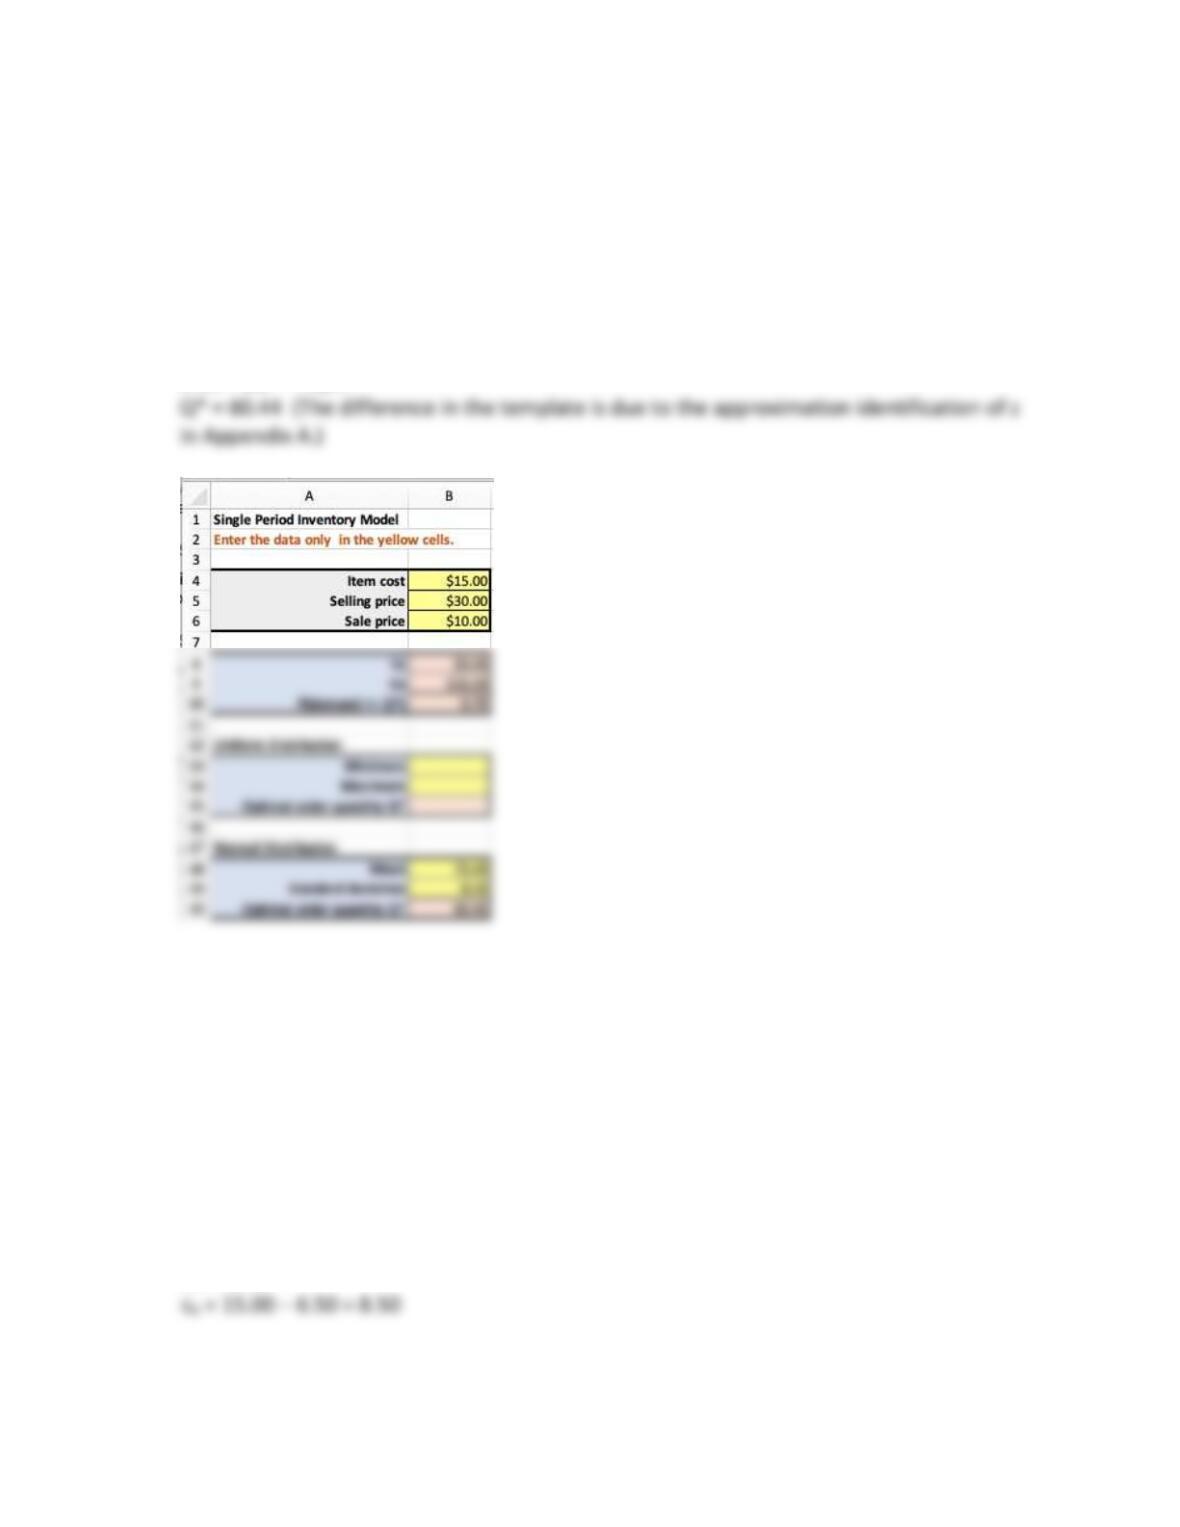
If the sale price is $5.00, we obtain:
cu = $30 – $15 = $15
cs = $15 – $5 = $10
50
78. For Suzie’s Sweetshop scenario in problem 77, suppose that demand is normally distributed
with a mean of 75 and a standard deviation of 8. How will her optimal order quantity
change? Use the Single Period Inventory Excel template in MindTap to find your answer.
P(demand <= Q*) = 15/(15 + 5) = 0.75.
z = 0.68 (approximately)
0.68 = (Q* – 75)/8
79. The J&B Card Shop sells calendars featuring a different colonial picture for each month.
The once-a-year order for each year’s calendar arrives in September. From past experience
the September-to-July demand for the calendars can be approximated by a normal
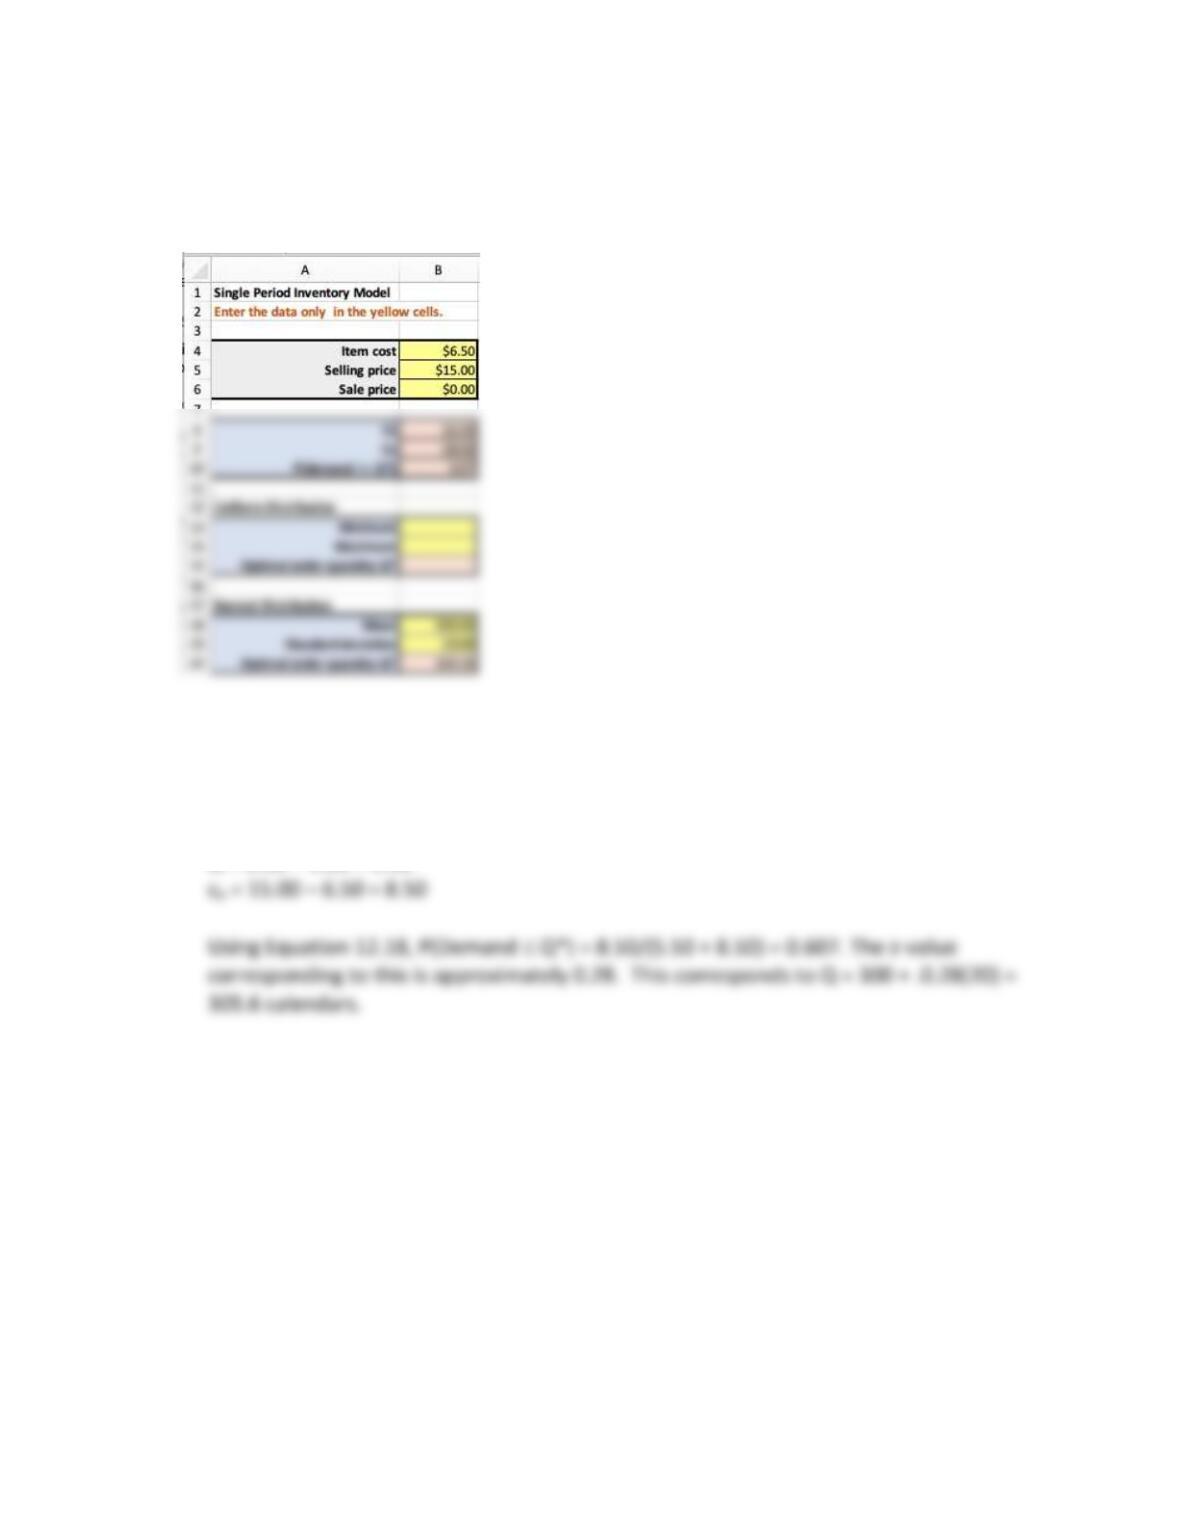
distribution with µ = 300 and standard deviation = 20. The calendars cost $6.50 each, and
J&B sells them for $15 each. Use the Single Period Inventory Excel template in MindTap to
answer the following:
a. Suppose that J&B throws out all unsold calendars at the end of July. How many
calendars should be ordered?
cs = 6.50,
51
Using Equation 12.18, P(Demand Q*) = 8.50/(8.50+6.50) = 0.567. The z value
corresponding to this is approximately 0.17. Order 300+ 0.17*20 = 303.4 or 304 calendars,
just slightly more than the average demand.
The template difference is due to numerical precision in the z value.
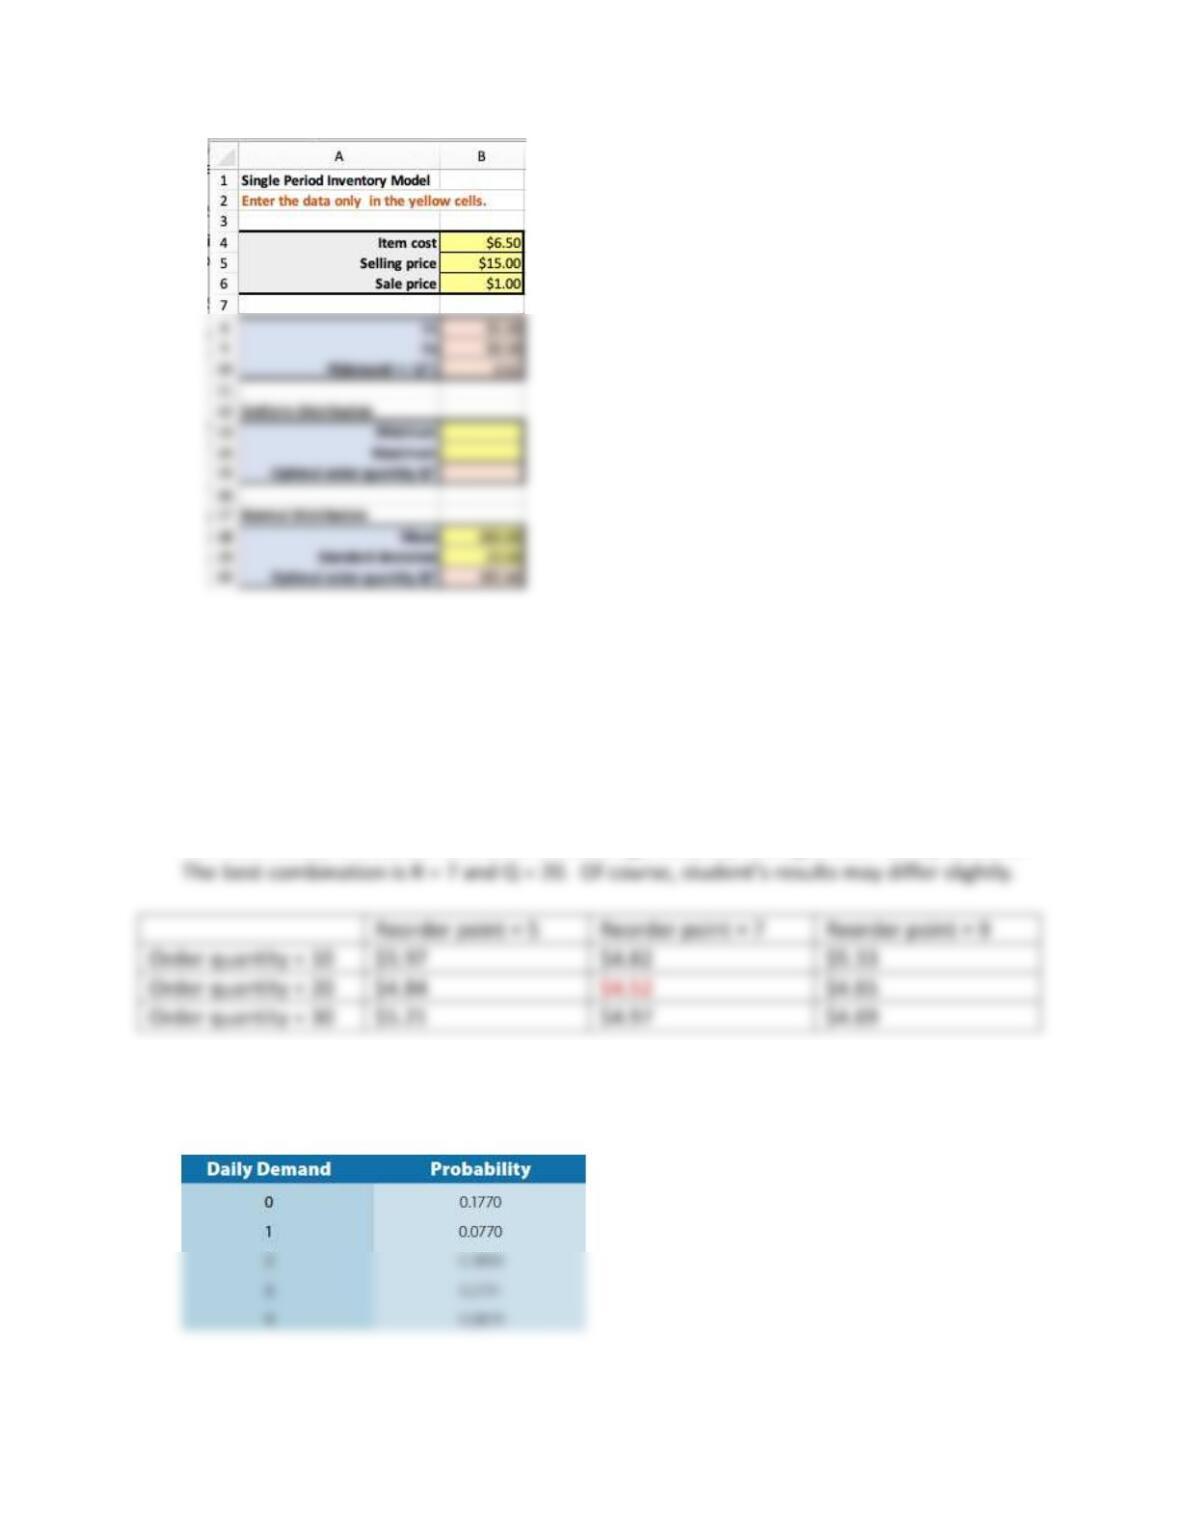
b. If J&B sells any surplus calendars for $1 at the end of July and can sell all of them at this
price, how many calendars should be ordered?
52
80. Use the Inventory Simulation Excel template in MindTap for the Scott Audio Systems
example in section 12-7 to determine the best order quantity-reorder point combination
with the smallest average cost/day for all combinations of reorder points 5, 7, and 9, and
order quantities 10, 20, and 30. What is the best combination? You need only change the
input values in the template but recalculate each combination ten times using a data table
to average out variations in the simulations. Once you set up the data table, it will
automatically update as the input values are changed.
The table below shows the results for the average cost/day averaged over 10 replications.
81. Daniel’s Auto Parts is a small wholesale distributor of automobile after-market items. For
one particular part, an analysis of historical sales resulted in the distribution of daily
demand shown below:
53
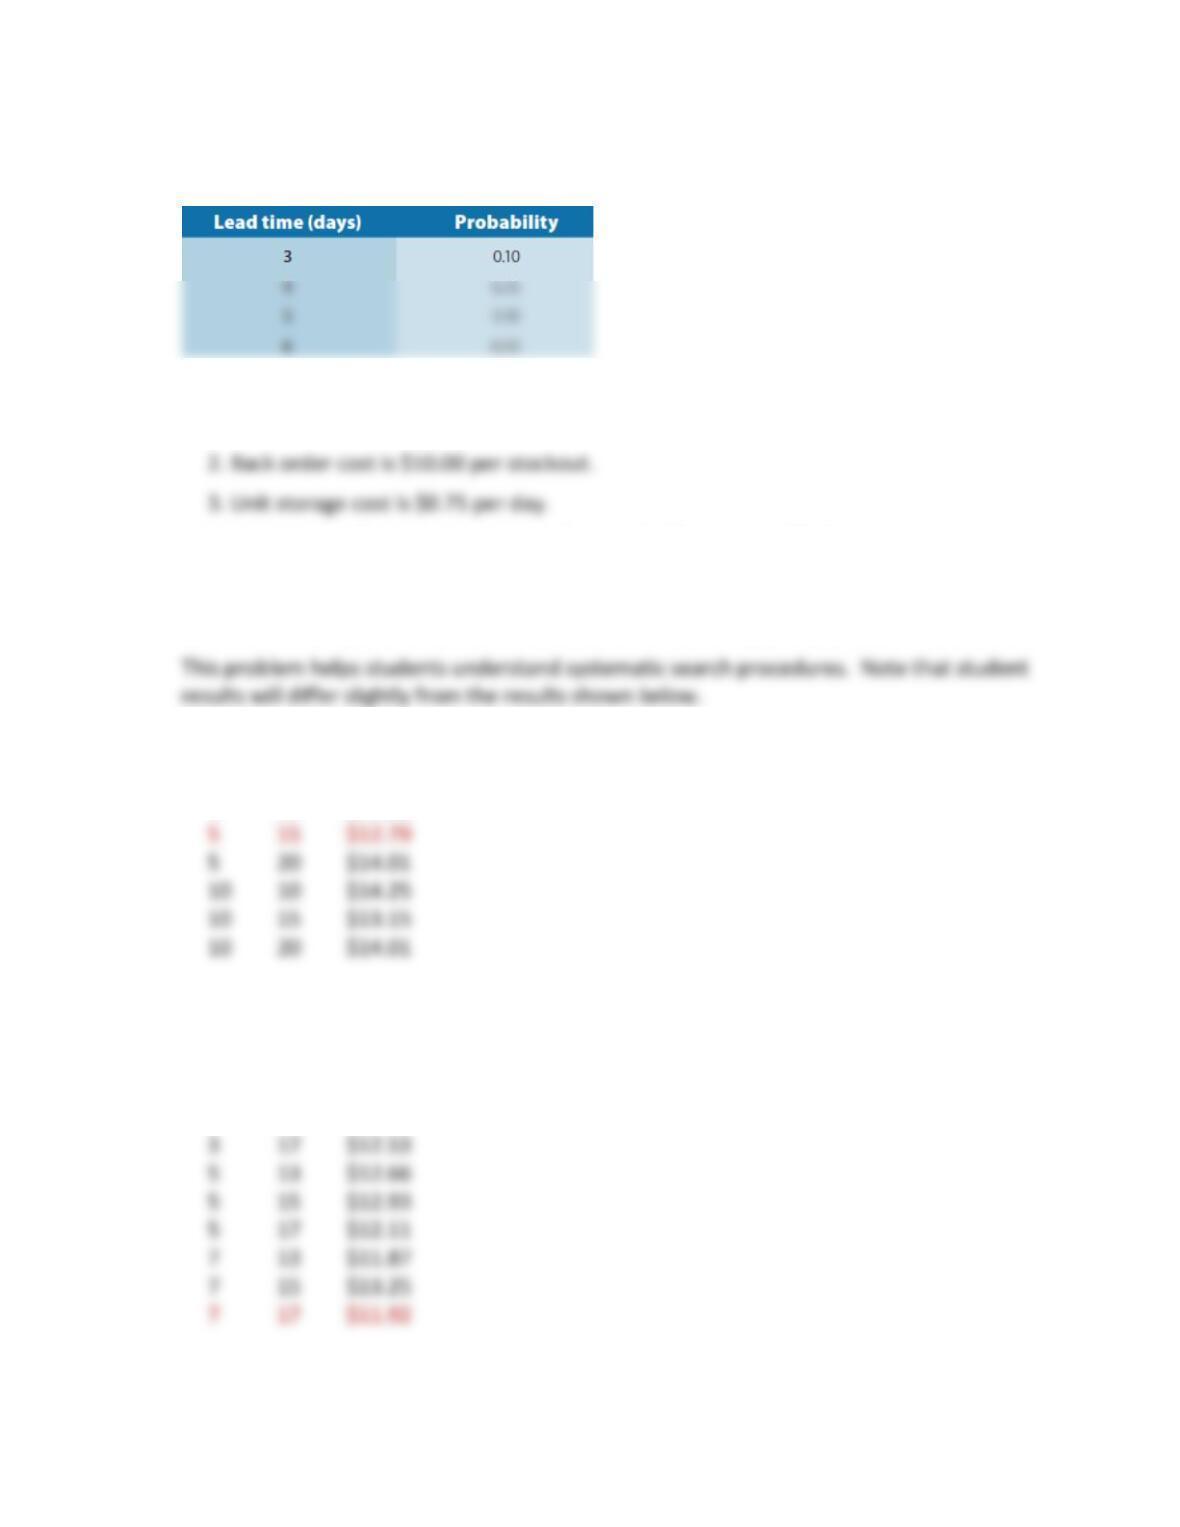
When a new supply of the part is ordered, the lead-time distribution is shown below (for
example, if the lead time is 3, the order arrives on the third day after the order is placed):
Other information obtained from company records includes the following:
1. Order cost is $25.00 per order.
Use the Inventory Simulation Excel template in MindTap to identify the best reorder point
and reorder level that will result in the lowest average cost/day using a data table with 20
replications. It will require some trial and error to hone in on the best parameters. Start
with the reorder point between five and ten, and the order quantity between ten and 20.
Using the template, we found the following results, starting with the basic parameter ranges:
R Q Average cost/day (averaged over 20 replications)
5 10 $16.66
Next, using a finer grid of values around the best initial combination, we found:
R Q Average cost/day (averaged over 20 replications)
3 13 $14.77
3 15 $12.60
Finally, searching around this best combination, we have: