Activity
Early
Early
Late
Late
Standard
Activity
time
Start
Finish
Start
Finish
Slack
Deviation
A
30
0
30
0
30
0
3.33333
B
60
30
90
60
120
30
10
C
65
30
95
30
95
0
8.333333
D
55
95
150
95
150
0
11.66667
E
30
90
120
120
150
30
1.666667
G
30
150
180
150
180
0
1.666667
H
20
180
200
180
200
0
3.333333
30
200
230
200
230
0
6.666667
10
200
210
219
229
19
K
1
210
211
229
230
19
L
20
230
260
230
260
0
6.666667
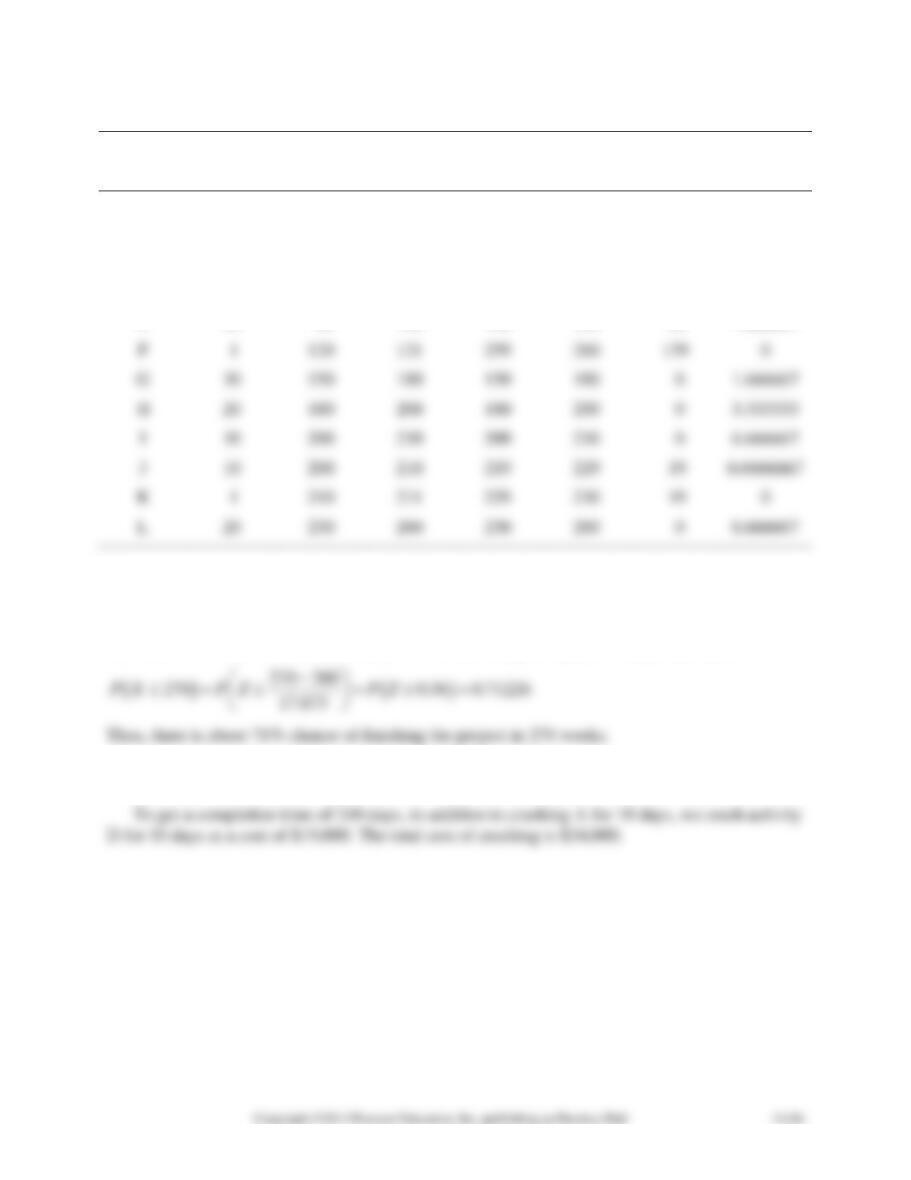
The project is expected to take 260 weeks. The critical path consists of activities A-C-D-G-H-I-
L.
2. To find the probabilities, we add the variances of the critical activities and find a project vari-
ance of 319.444. The standard deviation is 17.873. Letting X = project completion time,
3. To get a completion time of 250 days, we crash activity A for 10 days at a cost of $15,000.
This reduces the time to 250 days.

SOLUTION TO FAMILY PLANNING RESEARCH CENTER OF NIGERIA
CASE
This case covers three aspects of project management:
1. Critical path scheduling
2. Crashing
3. Personnel smoothing
The statement by Mr. Odaga that the project will take 94 days is a red herring. That is the sum of
all the task times that would be the length of the project only if all of the tasks were done serially
with none in parallel. Therefore, the assignment questions would be as follows:
Table 1
Latest and earliest starting times and slack
Activity
LS
ES
Slack
A. Identify faculty
8
0
8
B. Arrange transport
12
0
12
C. Identify material
0
0
0
D. Arrange accom-
modations
19
5
14
E. Identify team
13
5
8
F. Bring in team
20
12
8
G. Transport faculty
19
7
12
H. Print materials
5
5
0
I. Deliver materials
15
15
0
J. Train
22
22
0
K. Fieldwork
37
37
0
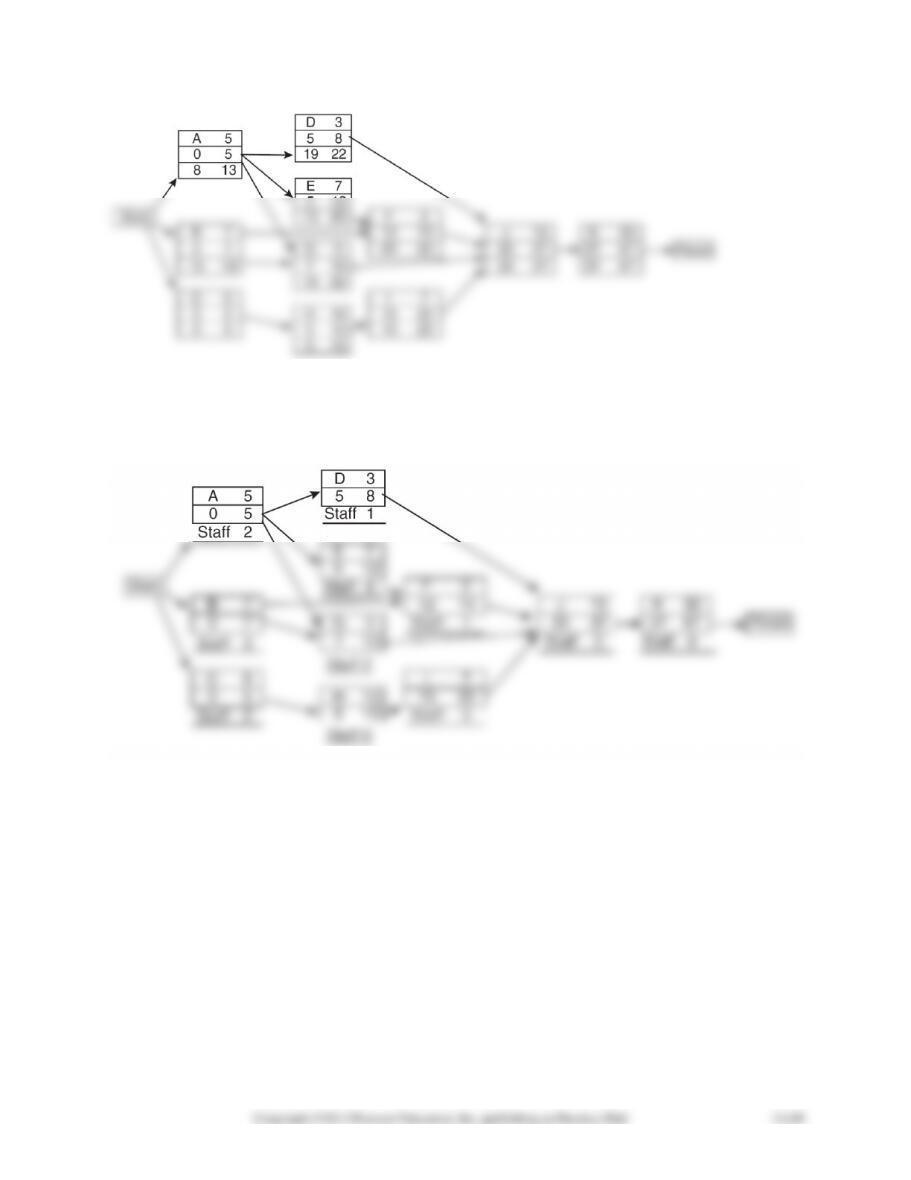
Figure 1 Network for Family Planning Research
Figure 2 Staffing Network for Family Planning Research
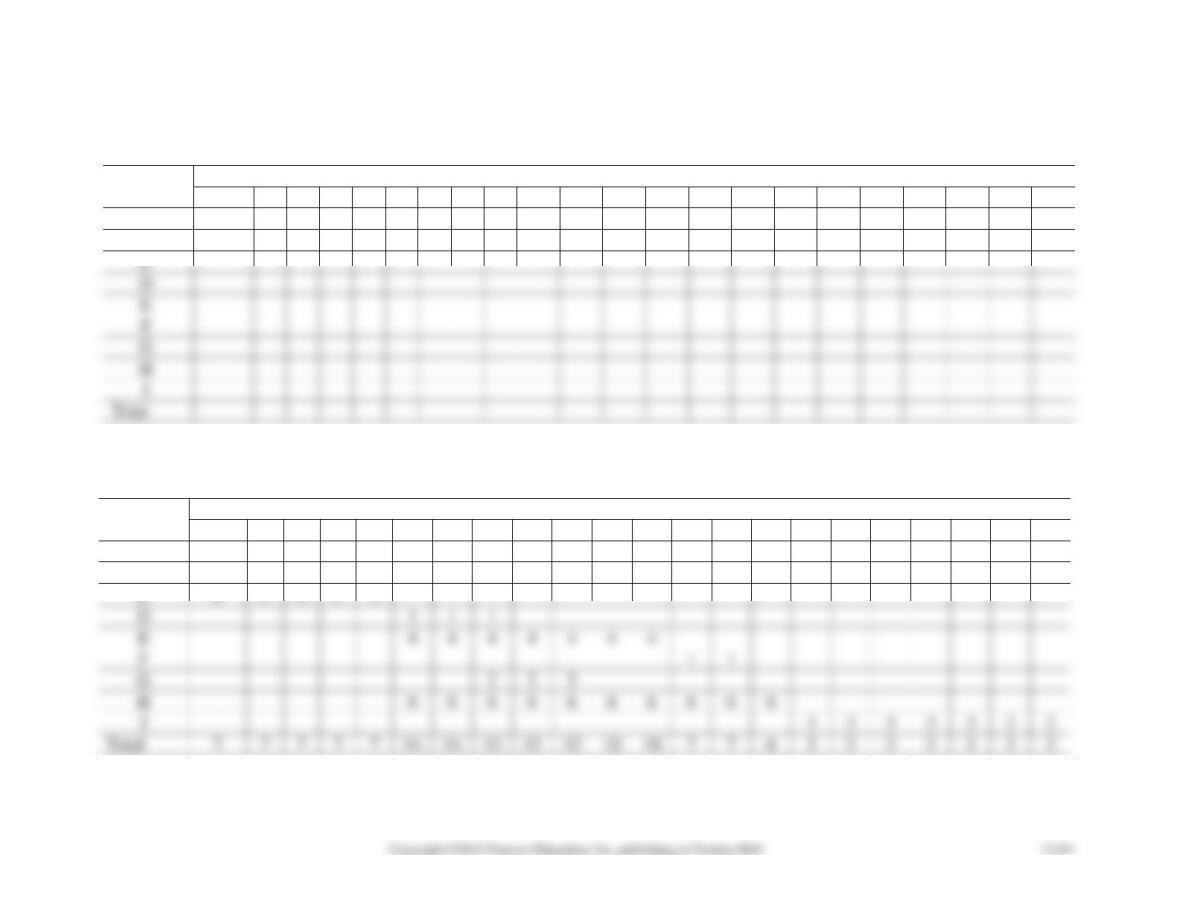
Table 2
Blank Staffing Chart
DAY
Activity
1
2
3
4
5
6
7
8
9
10
11
12
13
14
15
16
17
18
19
20
21
22
A
B
C
D
E
F
G
H
Total
Table 3
Chart Showing Each Day’s Manpower Requirements if All Activities Are Started at ES
DAY
Activity
1
2
3
4
5
6
7
8
9
10
11
12
13
14
15
16
17
18
19
20
21
22
A
2
2
2
2
2
B
3
3
3
3
3
3
3
C
2
2
2
2
2
D
1
1
1
4
4
4
4
4
4
4
1
1
G
2
2
2
H
6
6
6
6
6
6
6
6
6
6
3
3
3
3
3
3
3
Total
7
7
7
7
7
7
7
6
3
3
3
3
3
3
3
Table 4
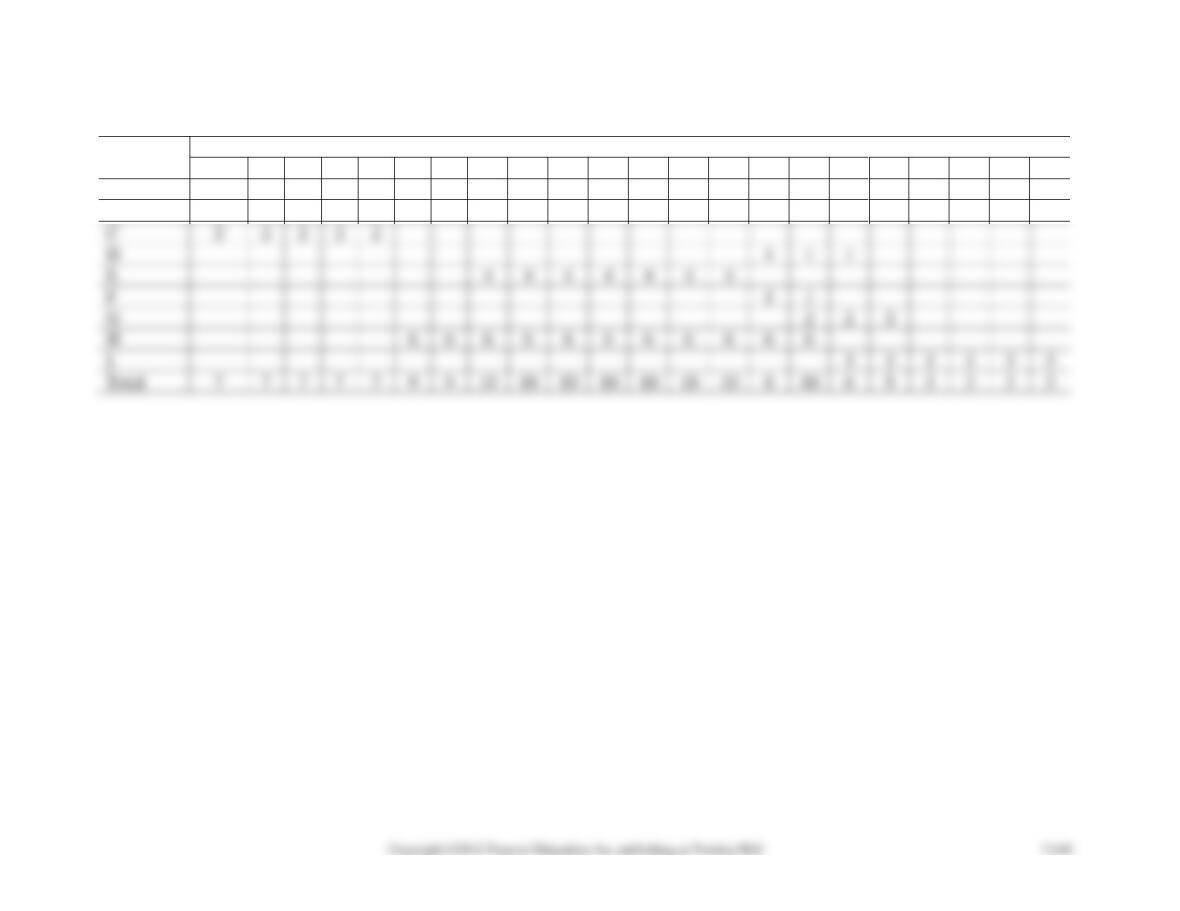
Minimum Number of Personnel Needed for 22-Day Completion Time
DAY
Activity
1
2
3
4
5
6
7
8
9
10
11
12
13
14
15
16
17
18
19
20
21
22
A
2
2
2
2
2
B
3
3
3
3
3
3
3
C
2
2
2
2
2
D
E
F
G
H
6
6
I
Total
7
7
7
7
7
9
9
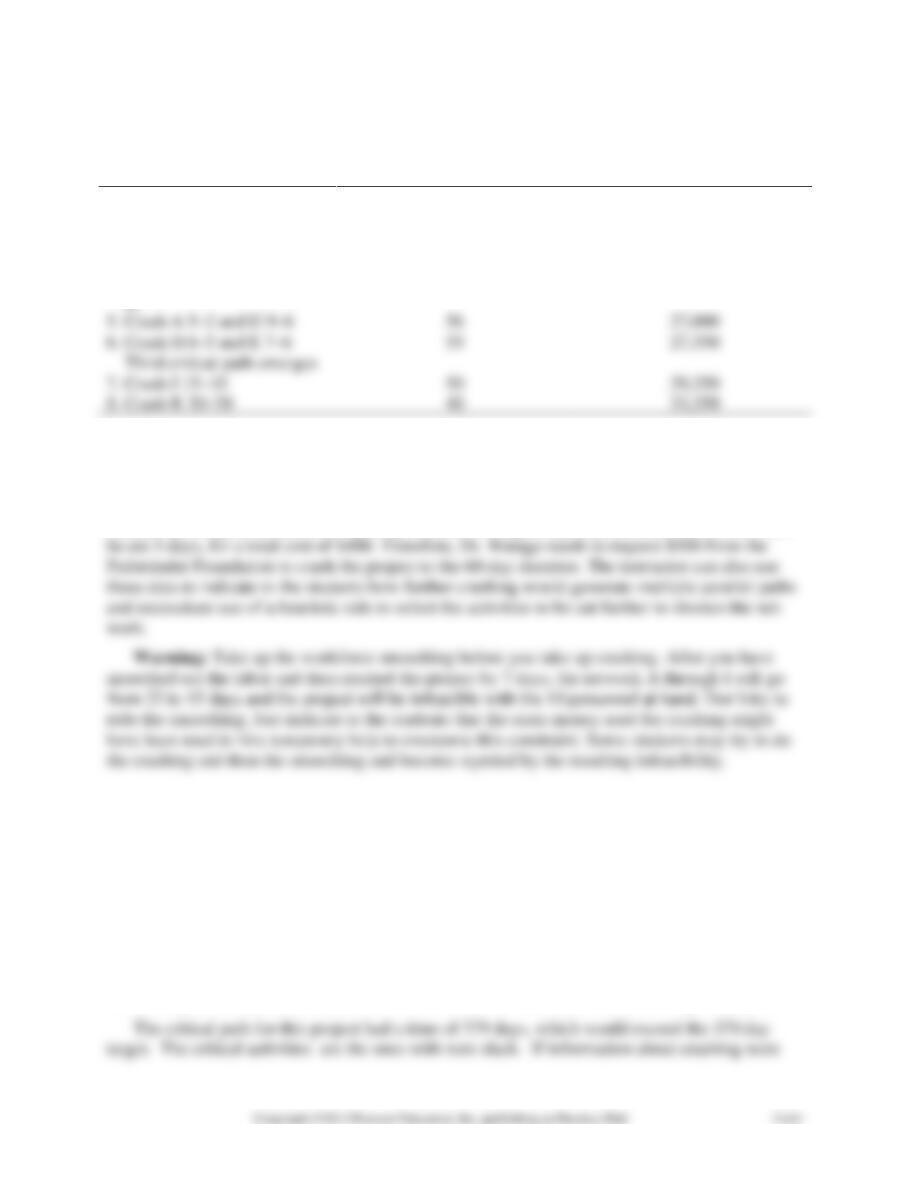
Table 5
Crashing Procedure
Step
Length (Days)
Total Cost
1. Original network
67
$25,400
2. Crash C 5–3
65
25,500
3. Crash I 7–2
60
25,900
4. Crash H 10–9
59
26,100
Second critical path emerg-
es
5. Crash A 5–2 and H 9–6
56
27,000
6. Crash H 6–5 and E 7–6
55
27,350
7. Crash J 15–10
50
29,350
8. Crash K 30–20
40
33,350
Crashing the schedule. Since the objective is a 60-rather than a 67-day schedule, the team
must investigate the possibilities of crashing activities on the critical path(s) to reduce project
duration using the data exhibited in the case. Table 5 shows the sequence of crashing to get to
various project lengths. Getting to 60 days is relatively easy and relatively cheap. Activity C is
reduced by 2 days at a cost of $50 per day. The next cheapest alternative is activity I, which can
SOLUTION TO INTERNET CASE
Solution to Cranston Construction Company Case
This case was based on a real construction project. The activities list for the Humanities
Building at the University of Northern Mississippi is shown in Table 1 that follows. The network
graph is shown in Figure 1. The project involved very high costs and was directly amenable to
critical path methods. The project extended over a period of approximately one year. In a project
of this length, weekly reports by the contractor would be necessary for controlling the project.
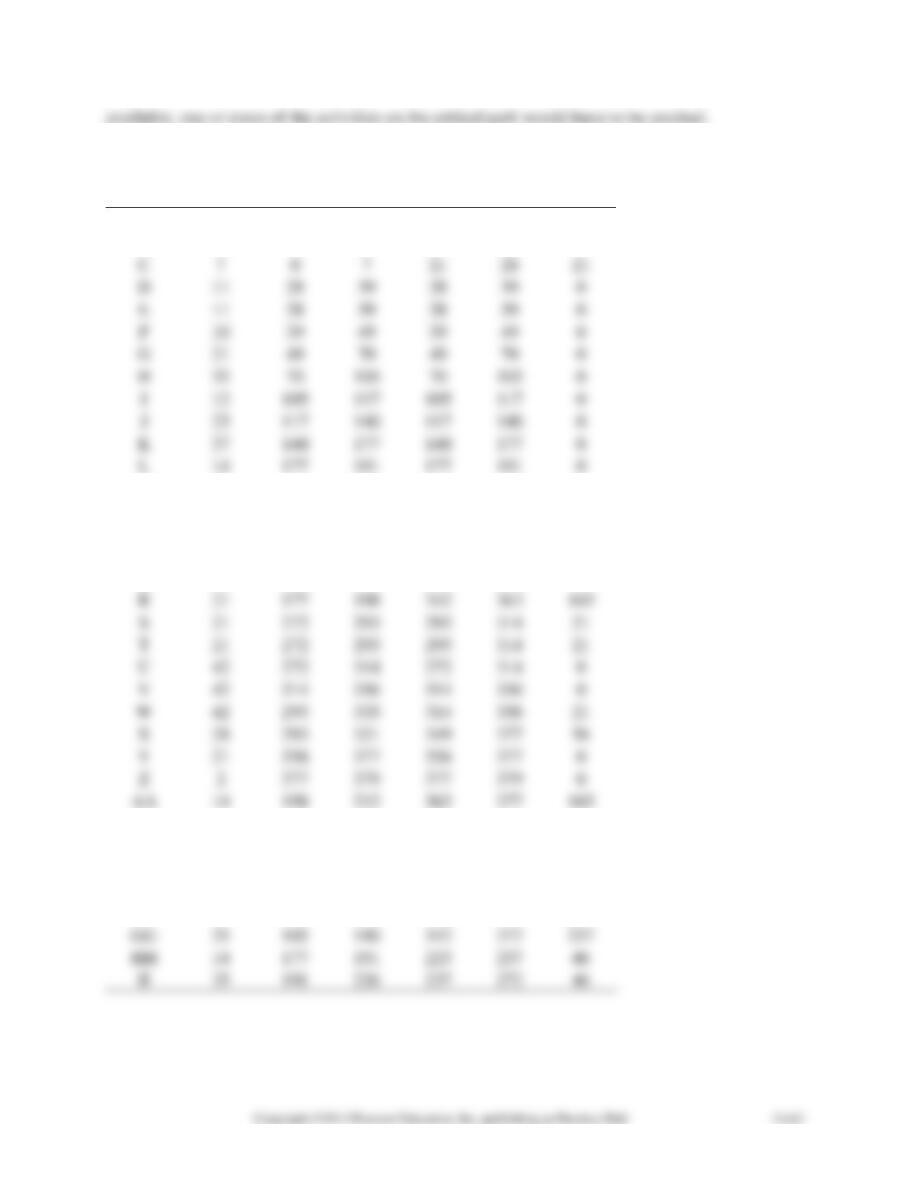
Table 1. Cranston Construction Times
Activity
Activity
time
Early
Start
Early
Finish
Late
Start
Late
Finish
Slack
A
28
0
28
0
28
0
B
21
0
21
7
28
7
C
7
0
7
21
28
21
D
11
28
39
28
39
0
E
11
28
39
28
39
0
F
10
39
49
39
49
0
G
21
49
70
49
70
0
H
35
70
105
70
105
0
12
105
117
105
117
0
23
117
140
117
140
0
K
37
140
177
140
177
0
L
14
177
191
177
191
0
M
23
191
214
191
214
0
N
37
214
251
214
251
0
O
14
251
265
258
272
7
P
21
251
272
251
272
0
Q
21
251
272
251
272
0
R
21
177
198
342
363
165
S
21
272
293
293
314
21
T
21
272
293
293
314
21
U
42
272
314
272
314
0
V
42
314
356
314
356
0
42
293
335
314
356
21
X
28
293
321
349
377
56
Y
21
356
377
356
377
0
Z
2
377
379
377
379
0
AA
14
198
212
363
377
165
BB
35
105
140
328
363
223
CC
14
140
154
363
377
223
DD
14
105
119
188
202
83
EE
35
119
154
202
237
83
FF
21
105
126
356
377
251
GG
35
105
140
342
377
237
HH
14
177
191
223
237
46
35
191
226
237
272
46
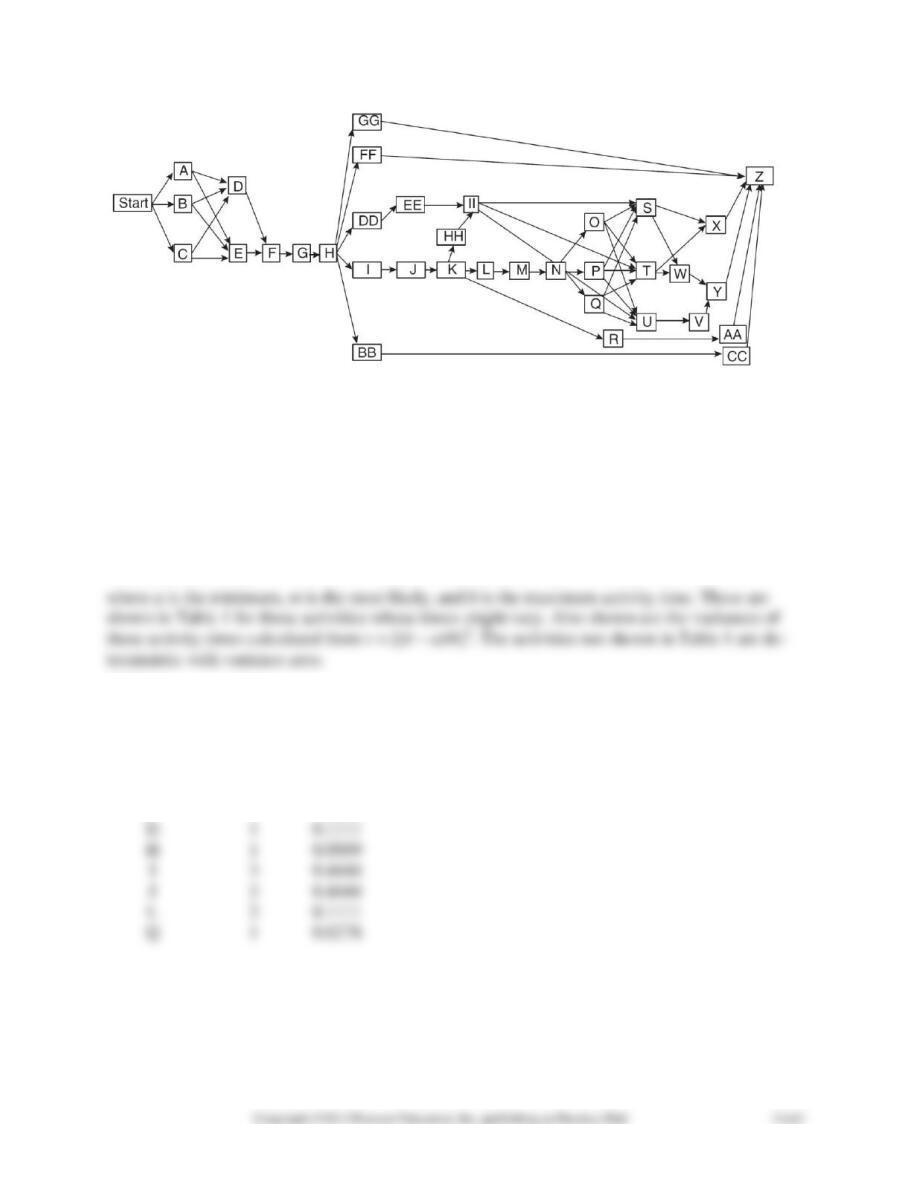
Figure 1 Network Graph for Cranston Case
SOLUTION TO ALPHA BETA GAMMA RECORD CASE
1. The PERT diagram is shown. The activity times are the averages calculated from the formula
t = (a + 4m + b)/6
Table 1
Mean and Variance for Variable Length Activities
Activity
Mean
Variance
A
2
0.1111
B
2
0.4444
C
1
0.0278
D
1
0.1111
H
1
0.0069
I
3
0.4444
J
3
0.4444
L
2
0.1111
Q
1
0.0278
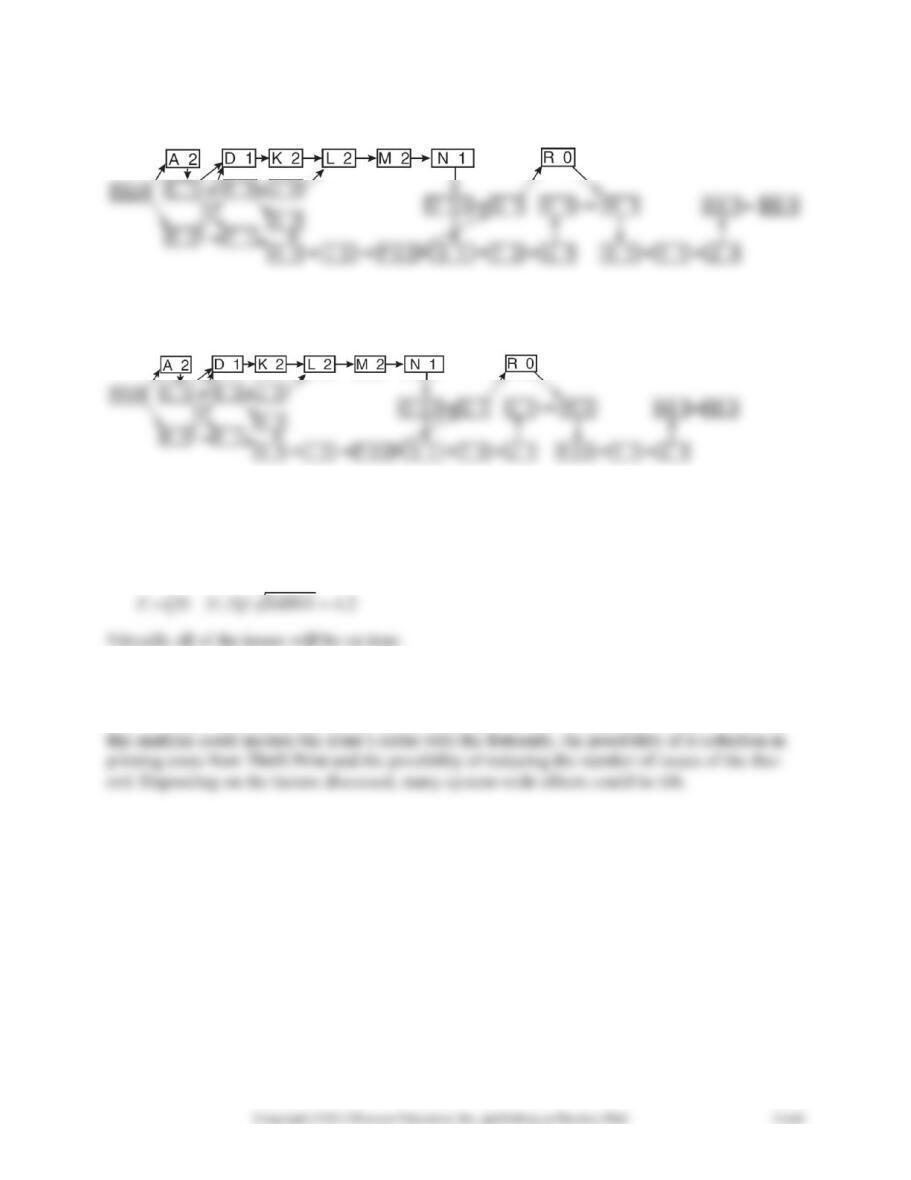
PERT Networks: Thrift Print and Kwik Print showing expected values
A. Thrift Print
Total Completion time = 31.5 days
B. Kwik Print
Total Completion time = 31 days
2. The critical path has an expected length of 31.5 with variance of 0.6944. This yields a stand-
ard normal variable
3. The second solution critical path has an expected length of 31.0 with variance 0.6944. This
yields a standard normal value of 4.8; virtually all of the issues will be on time.
4. This question is behavioral in nature and can be answered in a multitude of ways. Factors in

SOLUTION TO HAYGOOD BROTHERS CONSTRUCTION COMPANY CASE
Using the formulas to calculate the expected times and variances for the activities yields the re-
sults in the following table.
Activity
a
m
b
t
Variance
A
4
5
6
5
0.11
B
2
5
8
5
1
C
5
7
9
7
0.44
D
4
5
6
5
0.11
E
2
4
6
4
0.44
F
3
5
9
5.33
1
G
4
5
6
5
0.11
H
3
4
7
4.33
0.44
I
5
7
9
7
0.44
J
10
11
12
11
0.11
K
7
8
9
8
0.11
L
4
6
8
6
0.44
5
7
9
7
0.44
N
4
5
10
5.67
1
O
5
6
7
6
0.11
P
2
3
4
3
0.11
The earliest, latest and slack times are shown here.
Activity
t
ES
EF
LS
LF
Slack
A
5
0
5
0
5
0
B
5
5
10
5
10
0
C
7
10
17
10
17
0
D
5
10
15
23
28
13
E
4
17
21
17
21
0
F
5.33
21
26.33
33.67
39
12.67
G
5
21
26
34
39
13
H
4.33
21
25.33
34.67
39
13.67
I
7
21
28
21
28
0
J
11
28
39
28
39
0
K
8
39
47
44.33
52.33
5.33
L
6
39
45
39
45
0
7
45
52
45
52
0
N
5.67
47
52.67
52.33
58
5.33
O
6
52
58
52
58
0
P
3
58
61
58
61
0
The critical path is A–B–C–E–I–J–L–M–O–P (61 days). This path has a variance of 3.667 and a
standard deviation of 1.92.
Solution to Shale Oil Company Internet Case Study
1. Determine the expected shutdown time, and the probability the shutdown will be completed
one week earlier.
2. What are the probabilities that Shale finishes the maintenance project one day, two days, three
days, four days, five days, or six days earlier?
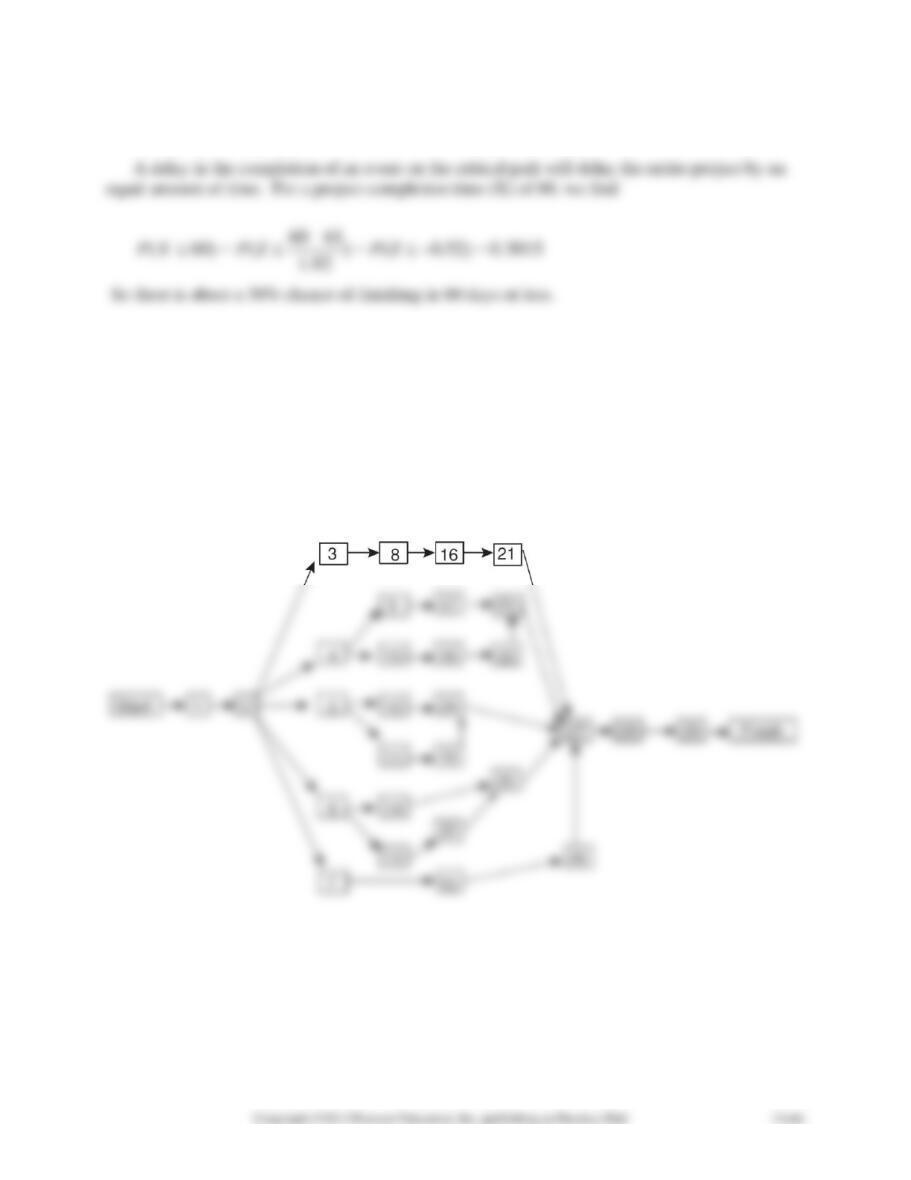
From the precedence data supplied in the problem, we can develop the following network:
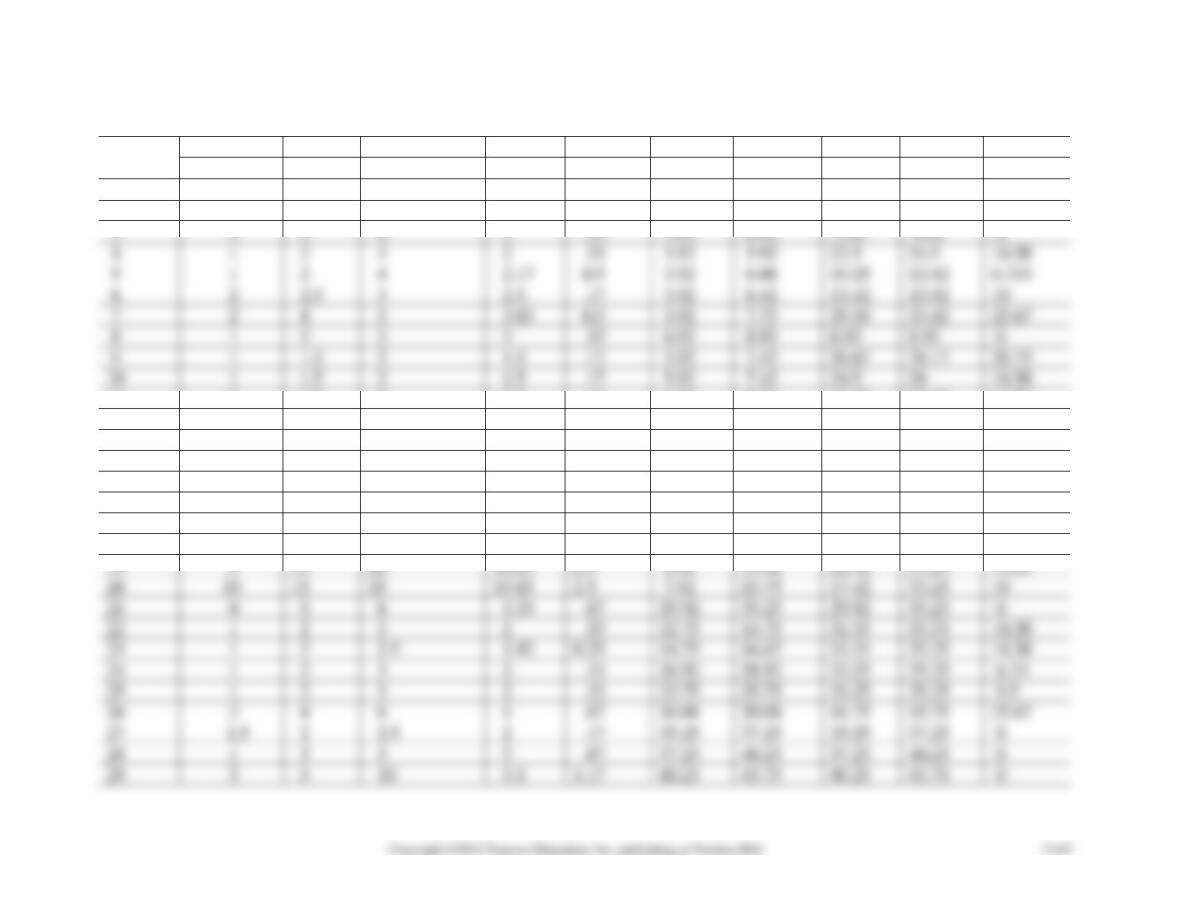
The following table indicates the expected times, variances, and slacks needed to complete the rest of the problem.
Task
Most
Optimistic
likely
Pessimistic
E(t)
ES
EF
LS
LF
Slack
1
1
2
2.5
1.92
0.25
0
1.92
0
1.92
0
2
1.5
2
2.5
2
.17
1.92
3.92
1.92
3.92
0
3
2
3
4
3
.33
3.92
6.92
3.92
6.92
0
4
1
2
3
2
.33
3.92
5.92
22.5
24.5
18.58
5
1
2
4
2.17
0.5
3.92
6.08
10.25
12.42
6.333
6
2
2.5
3
2.5
.17
3.92
6.42
13.42
15.92
10
7
2
4
5
3.83
0.5
3.92
7.75
29.58
33.42
25.67
8
1
2
3
2
.33
6.92
8.92
6.92
8.92
0
9
1
1.5
2
1.5
.17
5.92
7.42
26.67
28.17
20.75
10
1
1.5
2
1.5
.17
5.92
7.42
24.5
26
18.58
11
2
2.5
3
2.5
.17
6.08
8.58
19.92
22.42
13.83
12
15
20
30
20.83
2.5
6.08
26.92
12.42
33.25
6.33
13
1
1.5
2
1.5
.17
6.42
7.92
15.92
17.42
10
14
3
5
8
5.17
.83
6.42
11.58
28.08
33.25
21.67
15
3
8
15
8.33
2
7.75
16.08
33.42
41.75
25.67
16
14
21
28
21
2.33
8.92
29.92
8.92
29.92
0
17
1
5
10
5.17
1.5
7.42
12.58
28.17
33.33
20.75
18
2
5
10
5.33
1.33
7.42
12.75
26
31.33
18.58
19
5
10
20
10.83
2.5
8.58
19.42
22.42
33.25
13.83
20
10
15
25
15.83
2.5
7.92
23.75
17.42
33.25
10
21
4
5
8
5.33
.67
29.92
35.25
29.92
35.25
0
22
1
2
3
2
.33
12.75
14.75
31.33
33.33
18.58
23
1
2
2.5
1.92
0.25
14.75
16.67
33.33
35.25
18.58
24
1
2
3
2
.33
26.92
28.92
33.25
35.25
6.33
25
1
2
3
2
.33
23.75
25.75
33.25
35.25
9.5
26
2
4
6
4
.67
16.08
20.08
41.75
45.75
25.67
27
1.5
2
2.5
2
.17
35.25
37.25
35.25
37.25
0
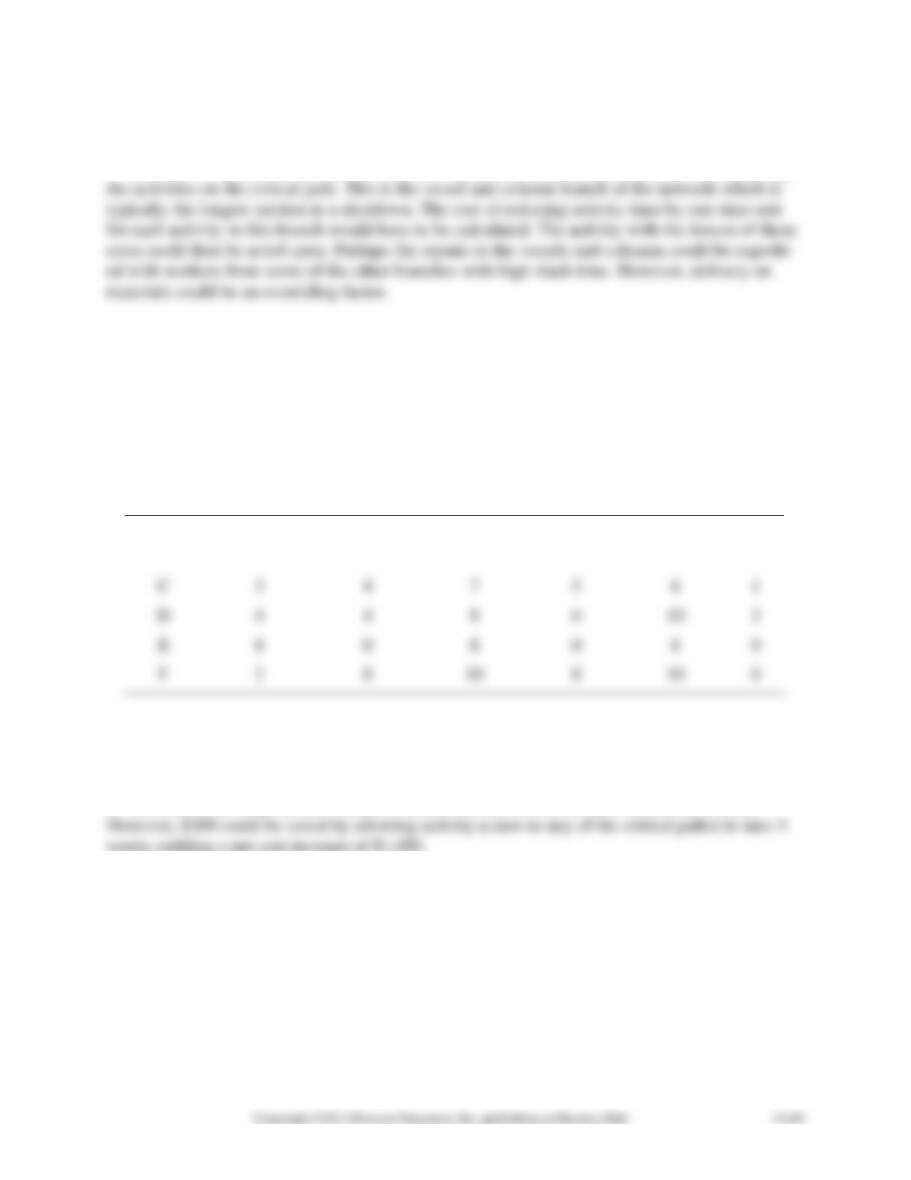
From the table, we can see that the expected shutdown time is 45.75 or 46 days. There are 9 ac-
tivities on the critical path.
Activities on the critical path
Task
2
1
0.25
0.0625
2
0.17
0.0289
3
0.33
0.1089
8
0.33
0.1089
16
2.33
5.4289
21
0.67
0.4489
27
0.17
0.0289
28
0.67
0.4489
29
1.17
1.3689
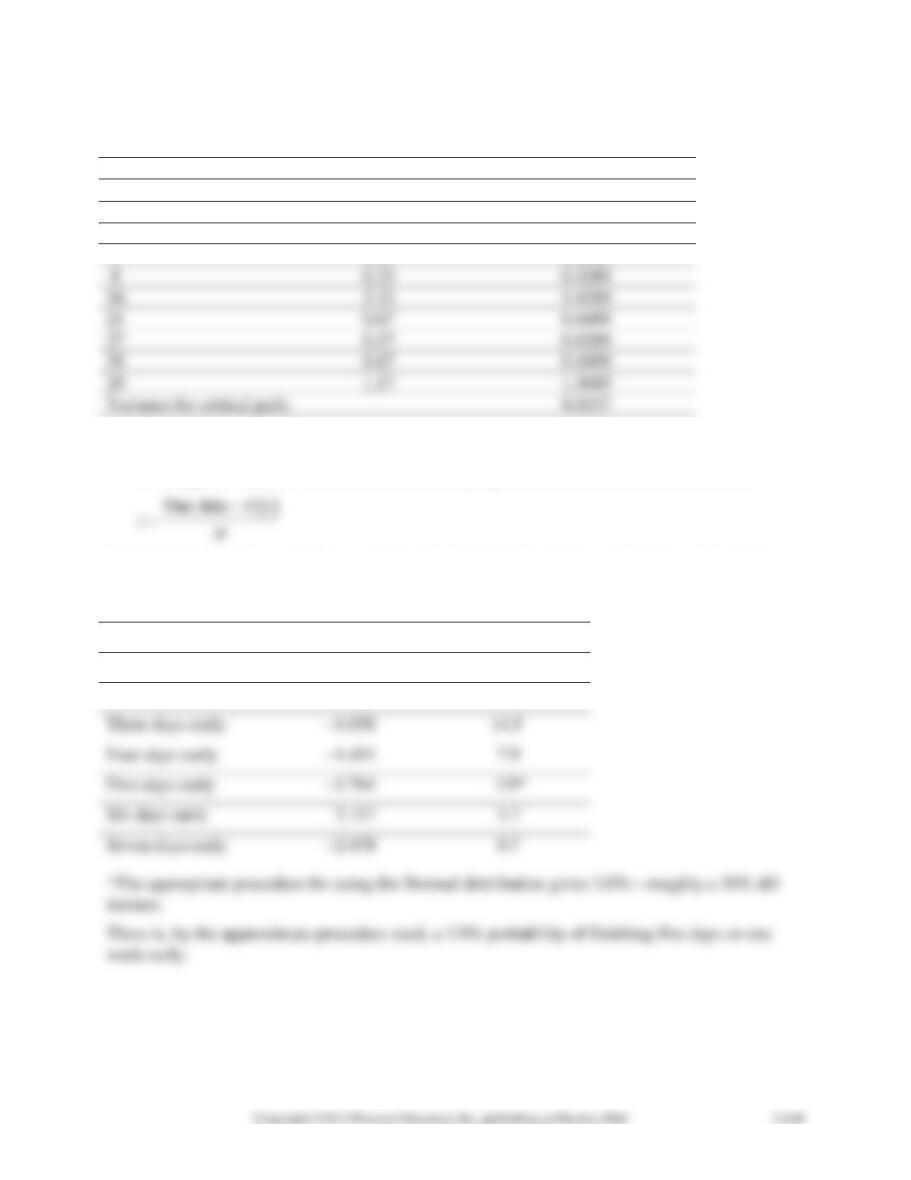
Variance for critical path:
8.0337
Therefore,
= 2.834.
As an approximation, we can use the customary equation for the Normal Distribution:
(Note: This might be a good time to discuss the difference between a continuous and a discrete
probability distribution, and the appropriate procedure for using a continuous distribution as an
approximation to a discrete, if you have not already done so.)
Finish Time
Z
Probability
One day early
–0.353
36.3%
Two days early
–0.706
24.0
Three days early
–1.058
14.5
Four days early
–1.411
Five days early
–1.764
Six days early
–2.117
Seven days early
–2.470
3. Shale Oil is considering increasing the budget to shorten the shutdown. How do you suggest
the company proceed?
In order to shorten the shutdown, Shale Oil would have to determine the costs of decreasing
SOLUTION TO BAY COMMUNITY HOSPITAL INTERNET CASE
STUDY
1. The earliest and latest times are shown in the table below. The minimum time to complete the
project base on the original numbers is 10. The critical path is E-F.
Activity
Activity time
Early Start
Early Finish
Late Start
Late Finish
Slack
A
2
0
2
3
5
3
B
4
0
4
1
5
1
C
3
4
7
5
8
1
E
8
0
8
0
8
0
2
8
10
8
10
0
2. If activity E on the critical path is reduced by one week using express truck, the completion
time becomes 9 weeks with two critical paths: E, F and B, C, F. The completion time can be re-
duced to 8 weeks by resorting to air shipment in activity e and using overtime in activity C.
3. The cost of air shipment ($750) and overtime ($600) would increase the cost by $1,350.