CHAPTER 12
Project Management
TEACHING SUGGESTIONS
Teaching Suggestion 12.1: Importance of PERT.
PERT has rebounded and, due to PC software such as Microsoft Project, become a highly used
Teaching Suggestion 12.2: Getting Students Involved with PERT.
PERT is a technique that students can apply immediately. For example, students can be asked to
semester.
Teaching Suggestion 12.3: Constructing a Network.
One of the most difficult tasks of PERT or CPM is to develop an accurate network that reflects
the true situation. Students should be given practice in this important aspect of network analysis
Teaching Suggestion 12.4: Using the Beta Distribution.
PERT uses the beta distribution in estimating expected times and variances for each activity. As
a matter of fact, it is questionable whether the beta distribution is appropriate. Students should be
Teaching Suggestion 12.5: Finding the Critical Path.
Finding the critical path is not too difficult if the steps given in this chapter are followed. Stu-
Teaching Suggestion 12.6: Project Crashing.
ALTERNATIVE EXAMPLES
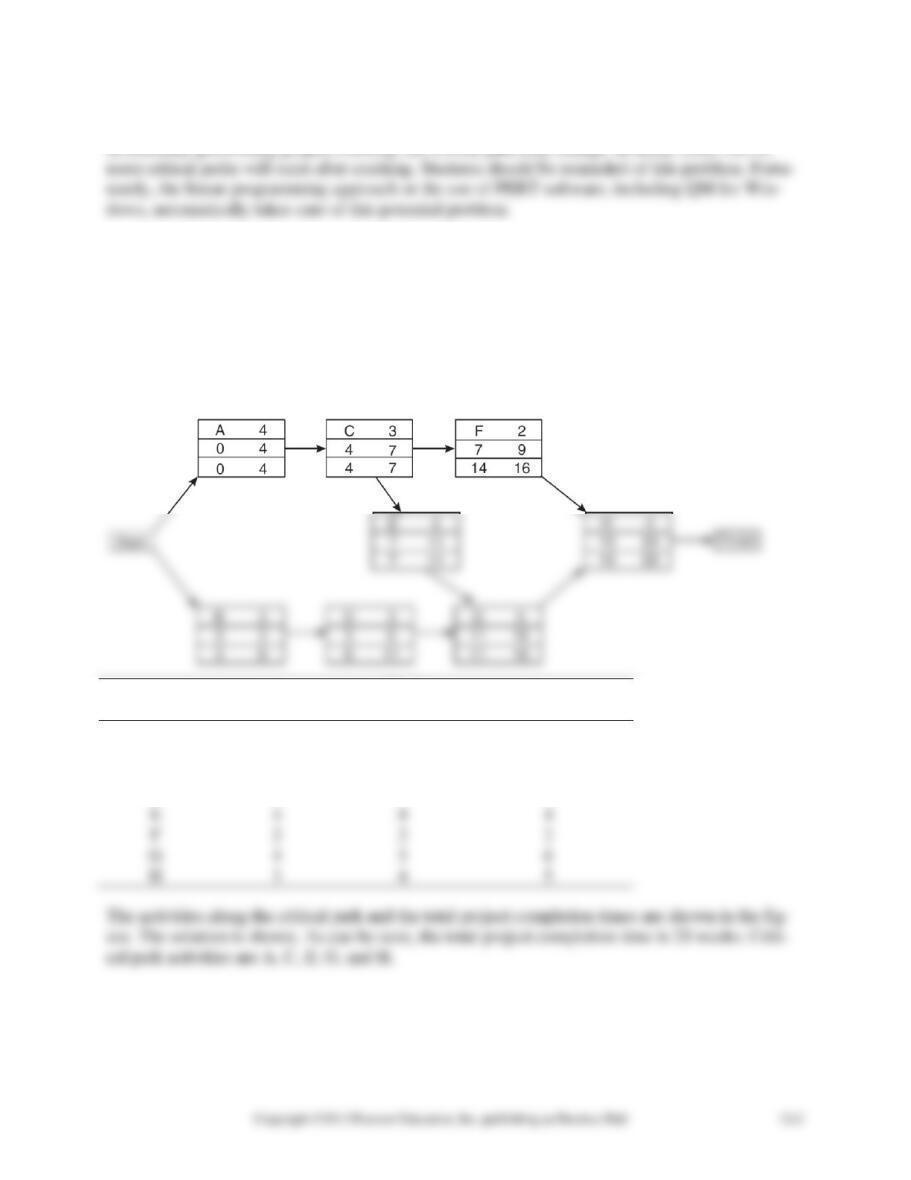
Alternative Example 12.1: Sid Orland is involved in planning a scientific research project. The
activities are displayed in the following diagram. Optimistic, most likely, and pessimistic time
estimates are displayed in the following table.
Figure for Alternative Example 12.1
Most
Activity
Optimistic
Likely
Pessimistic
A
3
4
5
B
3
3
3
C
2
3
4
D
1
3
5
E
4
4
4
2
2
2
G
4
5
6
H
3
4
5
Activity
Mean
S.D.
Variance
A*
4
0.333
0.111
B
3
0.000
0.000
C*
3
0.333
0.111
D
3
0.667
0.444
4
0.000
0.000
F
2
0.000
0.000
G*
5
0.333
0.111
H*
4
0.333
0.111
*Critical Path Activities
Expected Completion Time: 20
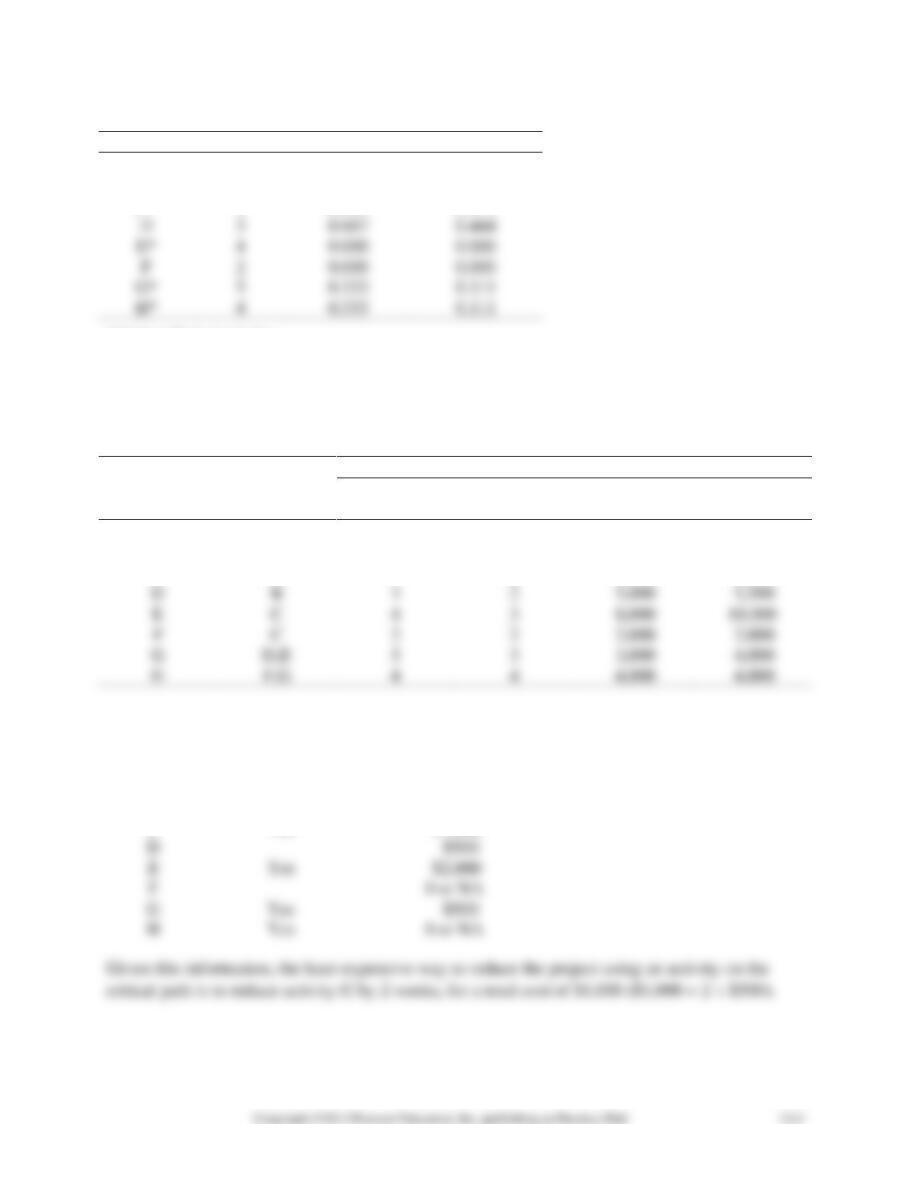
Alternative Example 12.2: Sid Orland would like to reduce the project completion time for the
problem in Alternative Example 12-1 by 2 weeks. The normal and crash times and costs are pre-
sented in the table.
TIME
COST
Activity
Immediate
Predecessor
Normal
Crash
Normal
Crash
A
—
4
3
$2,000
$3,000
B
—
3
3
3,000
3,000
C
A
3
2
5,000
6,000
D
B
3
2
5,000
5,500
F
C
2
2
2,000
2,000
G
D,E
5
3
3,000
4,000
H
F,G
4
4
4,000
4,000
From the table, the crash cost per week can be determined for each activity. This information is
displayed in the following table.
Activity
Critical Path?
Crash Cost per Week
A
Yes
$1,000
B
0 or NA
C
Yes
$1,000
D
Yes
$2,000
0 or NA
G
Yes
H
Yes
0 or NA
SOLUTIONS TO DISCUSSION QUESTIONS AND PROBLEMS
12-1. PERT and CPM can answer a number of questions about a project or the activities within
a project. These techniques can determine the earliest start, earliest finish, latest start, and the
12-2. There are several major differences between PERT and CPM. With PERT, three estimates
of activity time and completion are made. These are the optimistic, most likely, and pessimistic
12-3. An activity is a task that requires a fixed amount of time and resources to complete. An
12-4. Expected activity times and variances can be computed by making the assumption that ac-
tivity times follow a beta distribution. Three time estimates are used to determine the expected
activity time and variance for each activity.
12-5. The critical path consists of those activities that will cause a delay in the entire project if
they themselves are delayed. These critical path activities have zero slack. If they are delayed,
12-6. The earliest activity start time is the earliest time that an activity can be started while all
predecessor activities are completely finished. The earliest activity start times are determined
12-7. Slack is the amount of time that an activity can be delayed without delaying the entire pro-
ject. If the slack is zero, the activity cannot be delayed at all without delaying the entire project.
For any activity, slack can be determined by subtracting the earliest start from the latest start
time, or by subtracting the earliest finish from the latest finish time.
12-8. We can determine the probability that a project will be completed by a certain date by
knowing the expected project completion time and variance. The expected project completion
12-9. PERT/Cost is used to monitor and control project cost in addition to the time it takes to
complete a particular project. This can be done by making a budget for the entire project using
12-10. Crashing is the process of reducing the total time it takes to complete a project by ex-
pending additional resources. In performing crashing by hand, it is necessary to identify those
12-11. Linear programming is very useful in CPM crashing because it is a commonly used tech-
nique and many computer programs exist that can easily be used to crash a network. In addition,
there are many sensitivity and ranging techniques that are available with linear programming.
12-12.
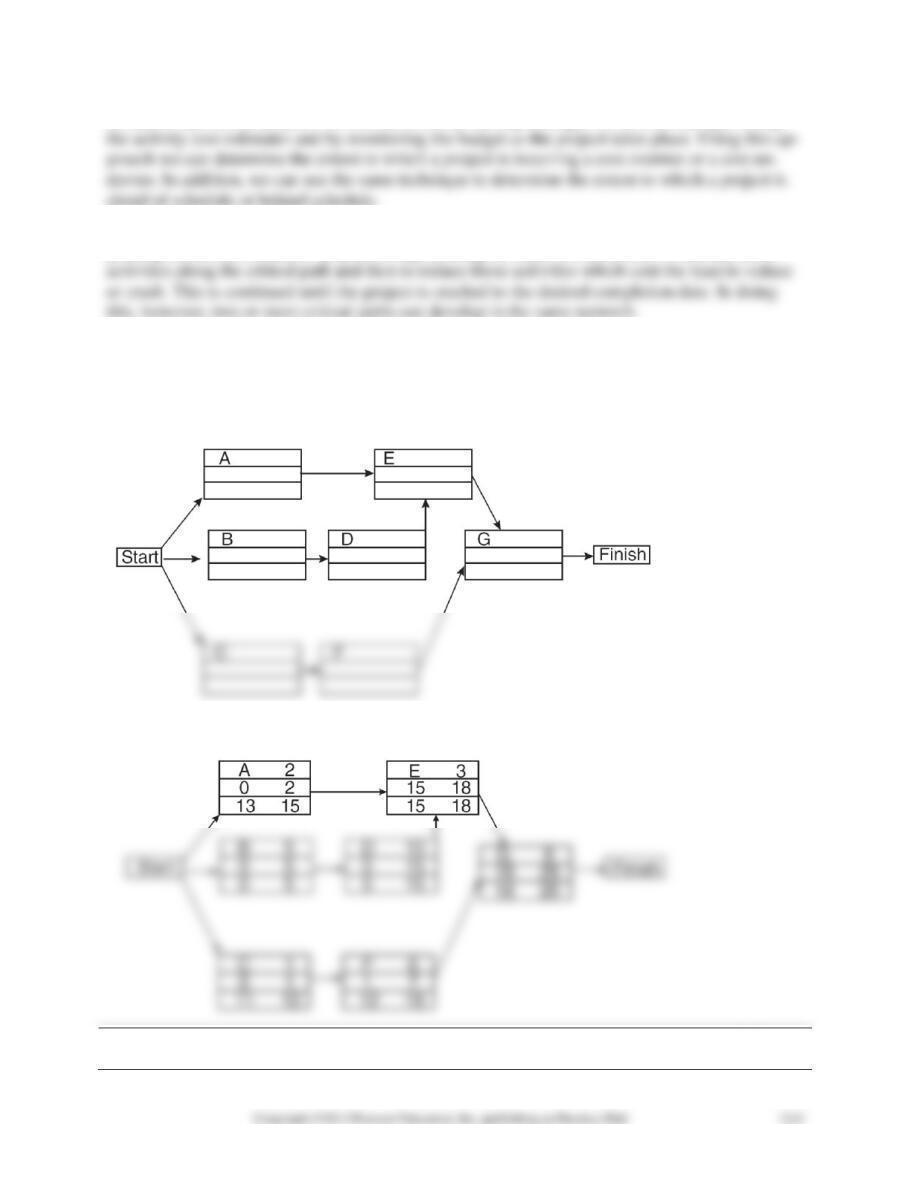
12-13.
Critical
Activity
ES
EF
LS
LF
Stack
Activity
A
0
2
13
15
13
No
B
0
5
0
5
0
Yes
C
0
1
11
12
11
No
D
5
15
5
15
0
Yes
E
15
18
15
18
0
Yes
F
1
7
12
18
11
No
G
18
26
18
26
0
Yes
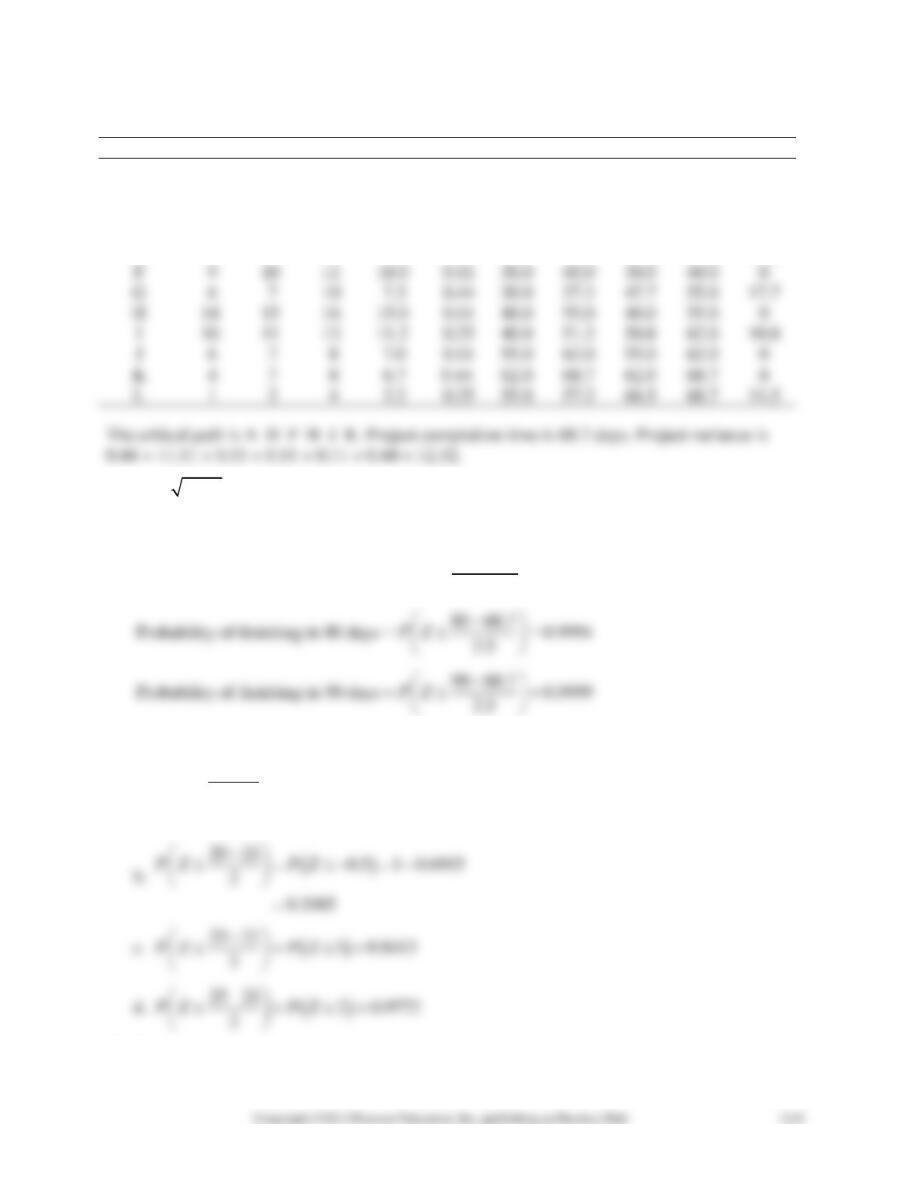
The critical path is B–D–E–G. Project completion time is 26 days.
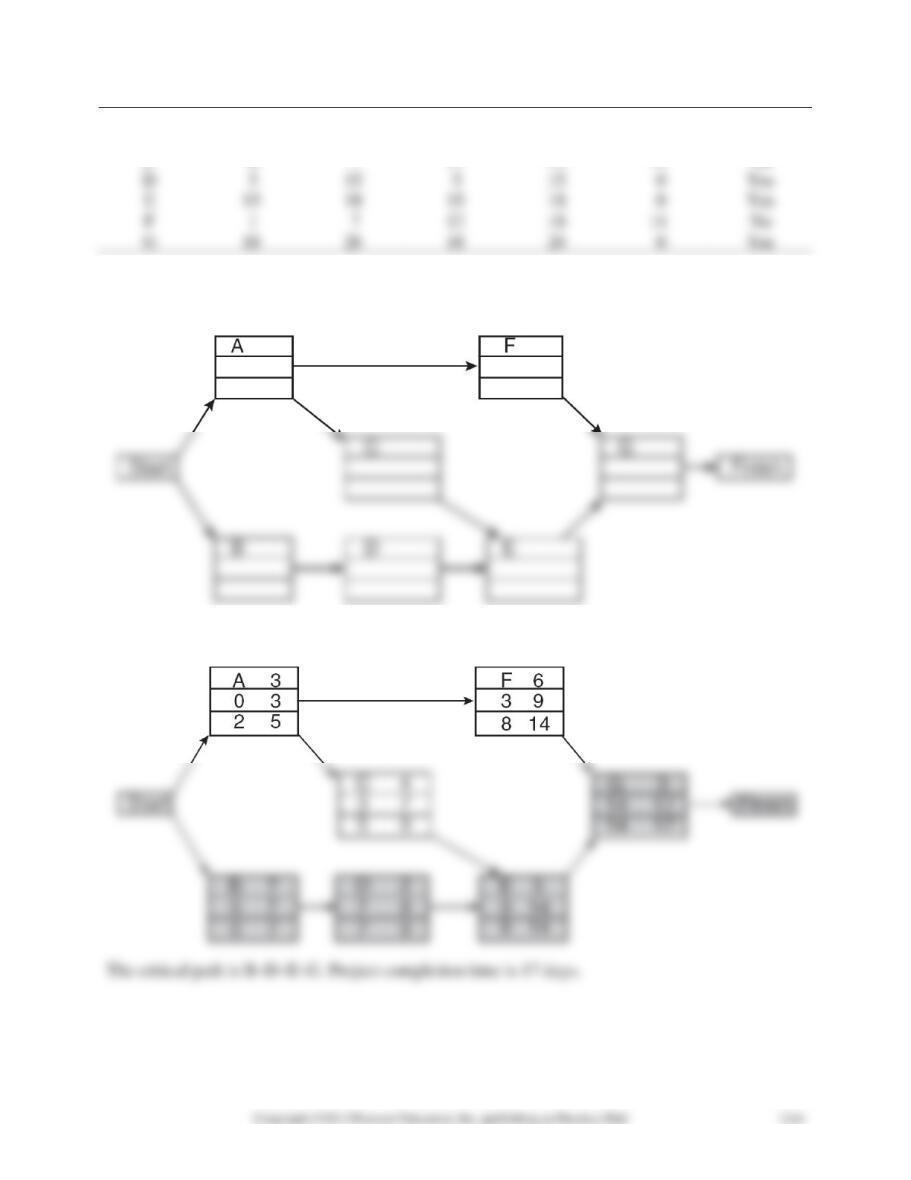
12-14.
12-15.
12-16.
12-17.
Time
Critical
Activity
(Weeks)
ES
EF
LS
LF
S
Activity
A
6
0
6
0
6
0
Yes
B
5
0
5
0
5
0
Yes
C
3
6
9
6
9
0
Yes
D
2
6
8
4
E
4
5
9
5
9
0
Yes
F
6
5
6
1
G
9
9
0
Yes
H
7
1
12-18.
= 40,
2 = 9,
= 3
a.
( ) ( )
40 40
40 0 0.50
3
P X P Z P Z
−
= = =
b.
( ) ( )
40 40
40 0 1 ( 0)
3
P X P Z P Z P Z
−
= = = −
12.19.
Activity
a
m
b
t
V
ES
EF
LS
LF
S
A
8
10
12
10.0
0.44
0
10.0
0
10.0
0
B
6
7
9
7.2
0.25
0
7.2
22.8
30.0
22.3
C
3
3
4
3.2
0.03
0
3.2
19.8
23.0
19.8
D
10
20
30
20.0
11.11
10.0
30.0
10.0
30.0
0
E
6
7
8
7.0
0.11
3.2
10.2
23.0
30.0
19.8
F
9
10
11
10.0
0.11
30.0
40.0
30.0
40.0
0
G
6
7
10
7.3
0.44
30.0
37.3
47.7
55.0
17.7
H
14
15
16
15.0
0.11
40.0
55.0
40.0
55.0
0
10
11
13
11.2
0.25
40.0
51.2
50.8
62.0
10.8
6
7
8
7.0
0.11
55.0
62.0
55.0
62.0
0
K
4
7
8
6.7
62.0
68.7
62.0
68.7
0
L
1
2
4
2.2
0.25
55.0
57.2
66.5
68.7
11.5
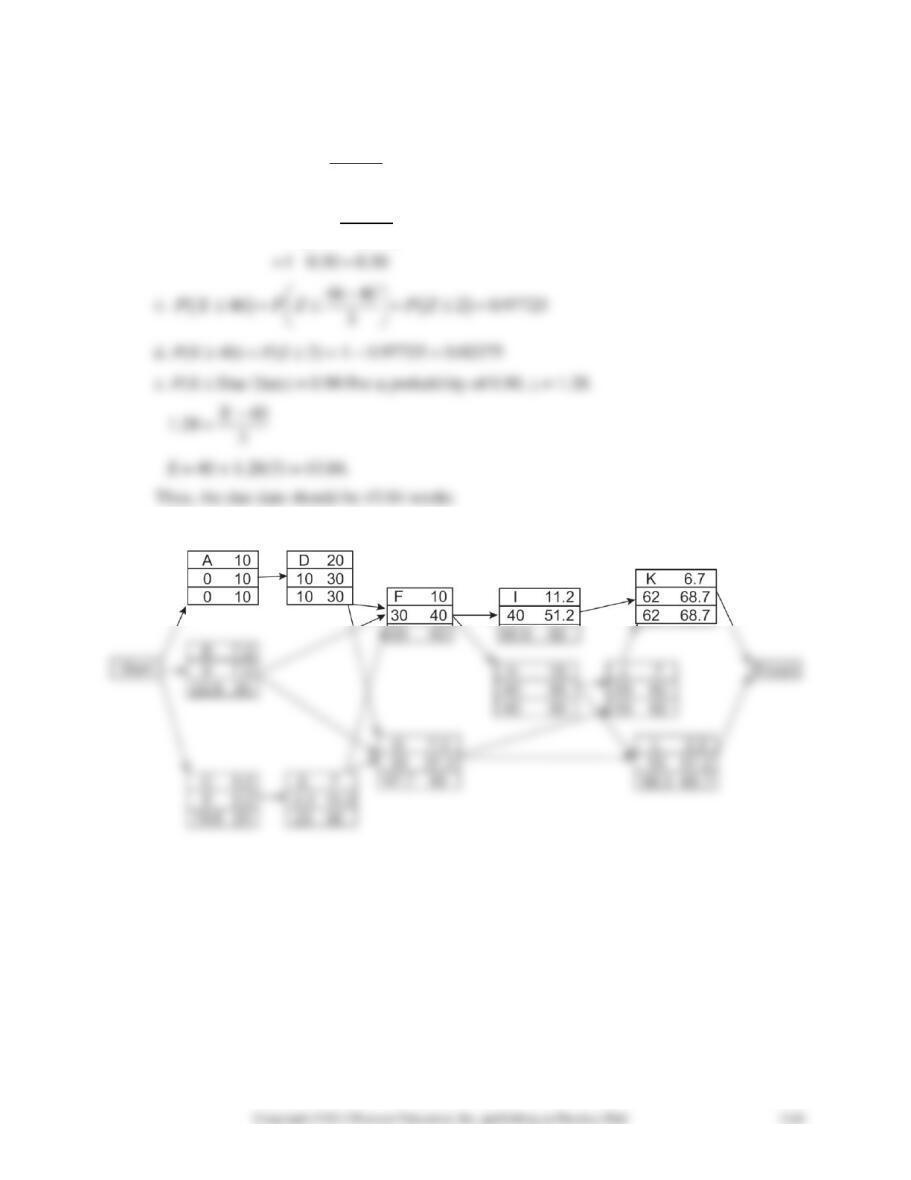
12.32 3.5
t
==
68.7
t
=
70 68.7
Probability of finishing in 70 days 0.644
3.5
PZ −
= =
12-20. Assuming normal distribution for project completion time:
a.
( )
17 21 2 1 0.9772
2
0.0228
P Z P Z
−
= − = −
=
12-21.
Total
Value of
Budgeted
Percentage of
Work
Actual
Activity
Activity
Cost
Completion
Completed
Cost
Difference
A
$22,000
100
$22,000
$20,000
–$2,000
B
30,000
100
30,000
36,000
6,000
C
26,000
100
26,000
26,000
0
D
48,000
100
48,000
44,000
–4,000
E
56,000
50
28,000
25,000
–3,000
F
30,000
60
18,000
15,000
–3,000
G
80,000
10
–3,000
H
16,000
10
–600
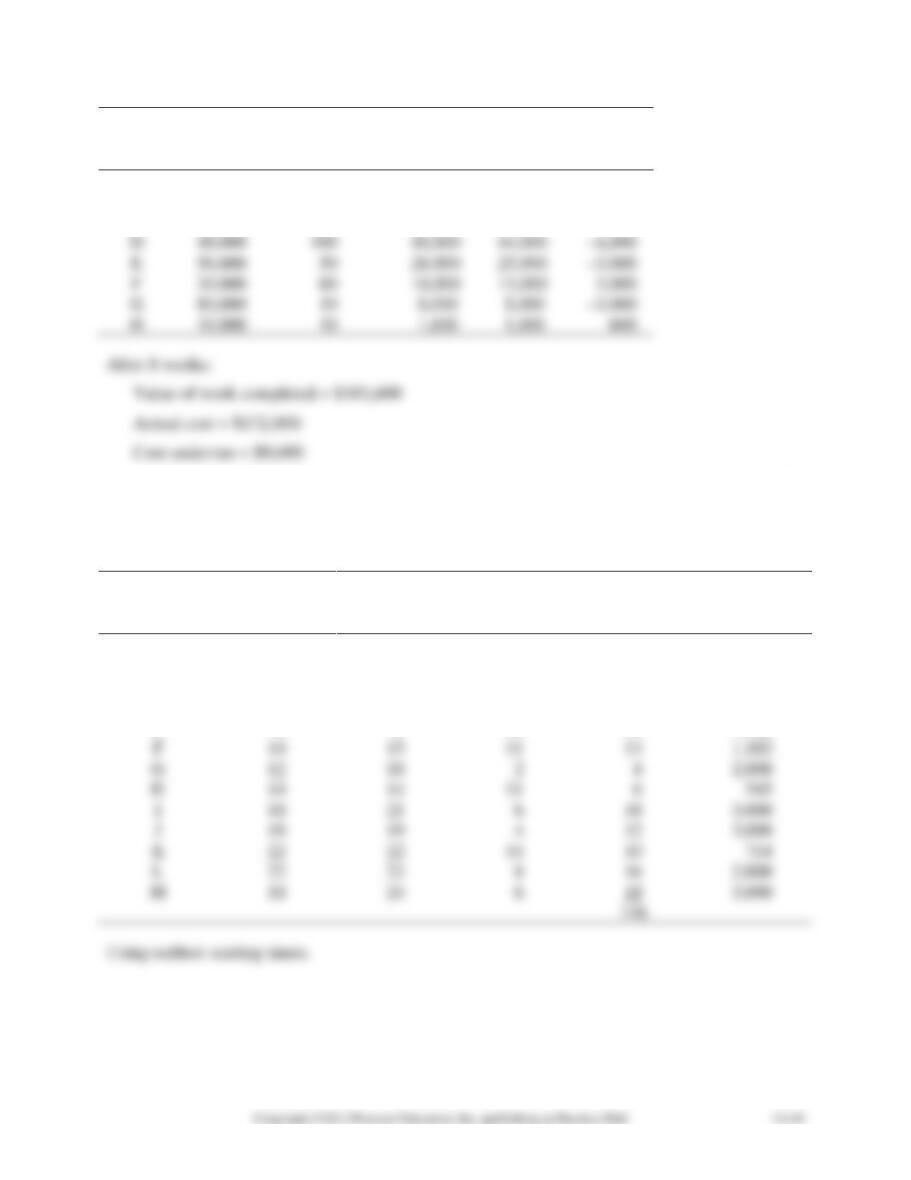
Using Table 12.6, $212,000 should have been spent using ES times. Using Table 12.7, with LS
times, $182,000 should have been spent. Hence the project is behind schedule but there is a cost
underrun on the whole.
12.22.
Total
Cost
Cost
Per
Activity
ES
LS
t
($1,000’s)
Month
A
0
0
6
10
$1,667
B
1
4
2
14
7,000
C
3
3
7
5
714
D
4
9
3
6
2,000
E
6
6
10
14
1,400
F
14
15
11
13
1,182
G
12
18
2
4
2,000
H
14
14
11
6
545
18
21
6
18
3,000
18
19
4
12
3,000
K
22
22
14
10
714
L
22
23
8
16
2,000
18
24
6
18
3,000
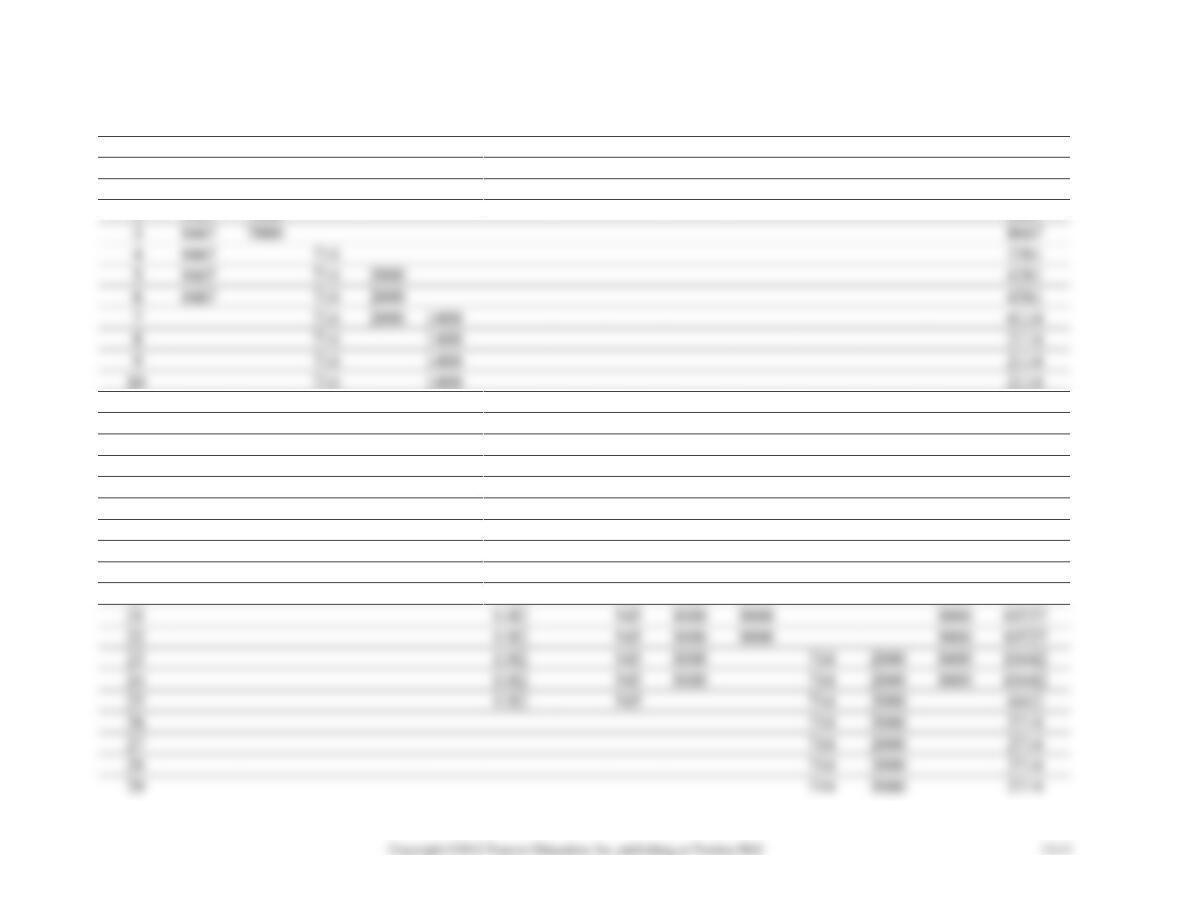
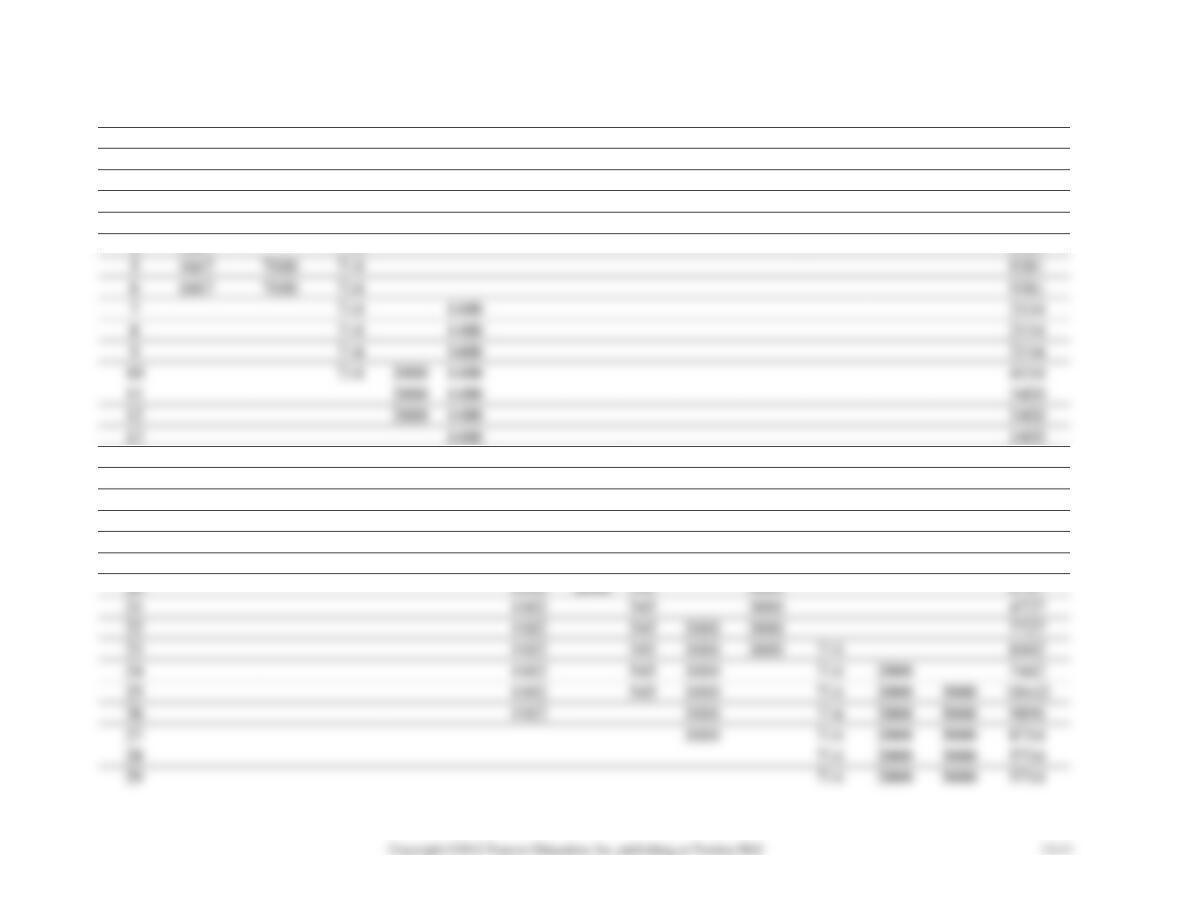
12-22. a. Monthly budget using earliest starting times:
ACTIVITY
Month
A
B
C
D
E
F
G
H
I
J
K
L
M
Total
1
1667
1667
2
1667
7000
8667
3
1667
7000
8667
4
1667
714
2381
5
1667
714
2000
4381
6
1667
714
2000
4381
7
714
2000
1400
4114
8
714
1400
2114
9
714
1400
2114
10
714
1400
2114
11
1400
1400
12
1400
1400
13
1400
2000
3400
14
1400
2000
3400
15
1400
1182
545
3127
16
1400
1182
545
3127
17
1182
545
1727
18
1182
545
1727
19
1182
545
3000
3000
3000
10727
20
1182
545
3000
3000
3000
10727
21
1182
545
3000
3000
3000
10727
22
1182
545
3000
3000
3000
10727
23
1182
545
3000
714
2000
3000
10442
24
1182
545
3000
714
2000
3000
10442
25
1182
545
714
2000
4442
26
714
2000
2714
27
714
2000
2714
30
714
2000
2714
31
714
714
32
714
714
33
714
714
34
714
714
35
714
714
36
714
714
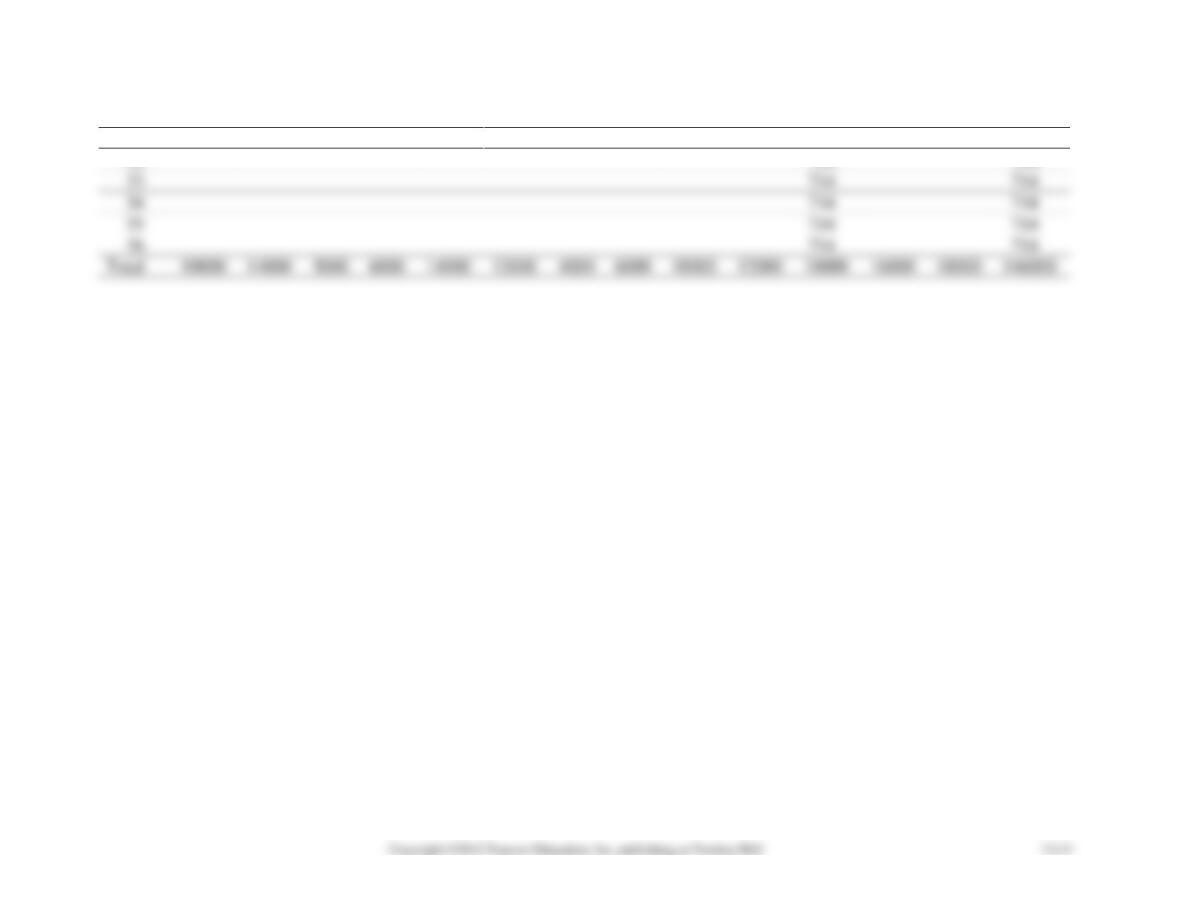
Total
10000
14000
5000
6000
14000
13000
4000
6000
18000
12000
10000
16000
18000
146000
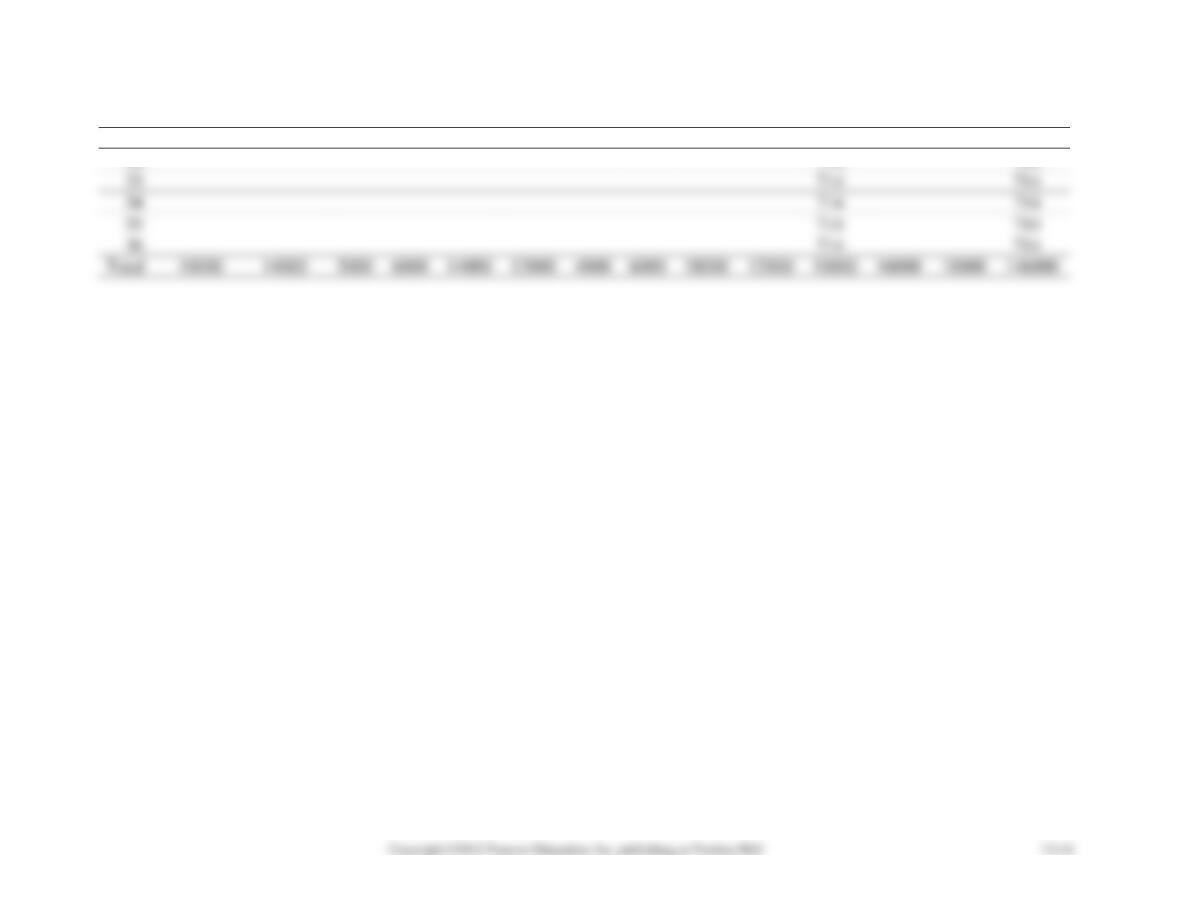
b. Monthly budget using latest starting times:
ACTIVITY
Month
A
B
C
D
E
F
G
H
I
J
K
L
M
Total
1
1667
1667
2
1667
1667
3
1667
1667
4
1667
714
2381
5
1667
7000
714
9381
6
1667
7000
714
9381
7
714
1400
2114
8
714
1400
2114
9
714
1400
2114
10
714
2000
1400
4114
11
2000
1400
3400
12
2000
1400
3400
13
1400
1400
14
1400
1400
15
1400
545
1945
16
1400
1182
545
3127
17
1182
545
1727
18
1182
545
1727
19
1182
2000
545
3727
20
1182
2000
545
3000
6727
21
1182
545
3000
4727
22
1182
545
3000
3000
7727
23
1182
545
3000
3000
714
8442
24
1182
545
3000
714
2000
7442
25
1182
545
3000
714
2000
3000
10442
26
1182
3000
714
2000
3000
9896
27
3000
714
2000
3000
8714
30
714
2000
3000
5714
31
714
2000
2714
32
714
714
33
714
714
34
714
714
35
714
714
36
714
714
Total
10000
14000
5000
6000
14000
13000
4000
6000
18000
12000
10000
16000
18000
146000
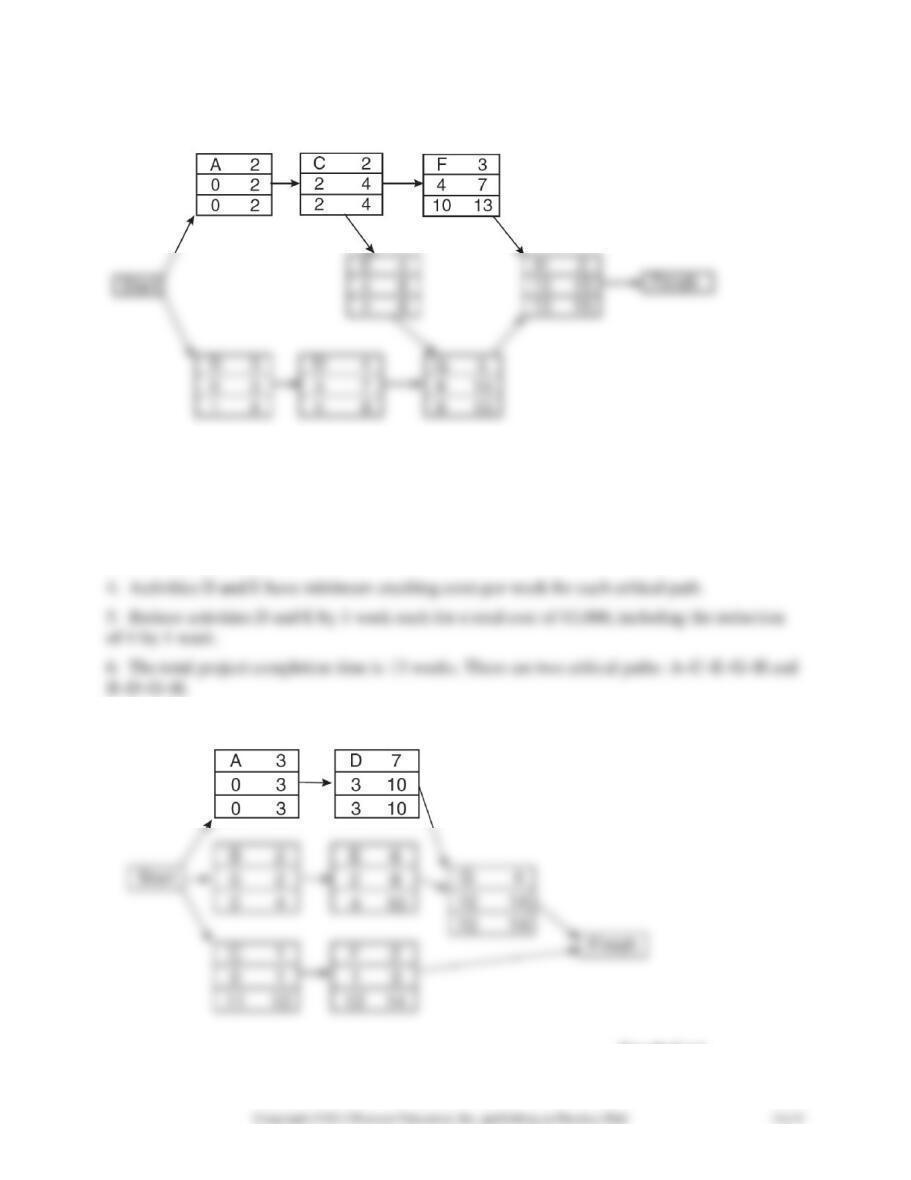
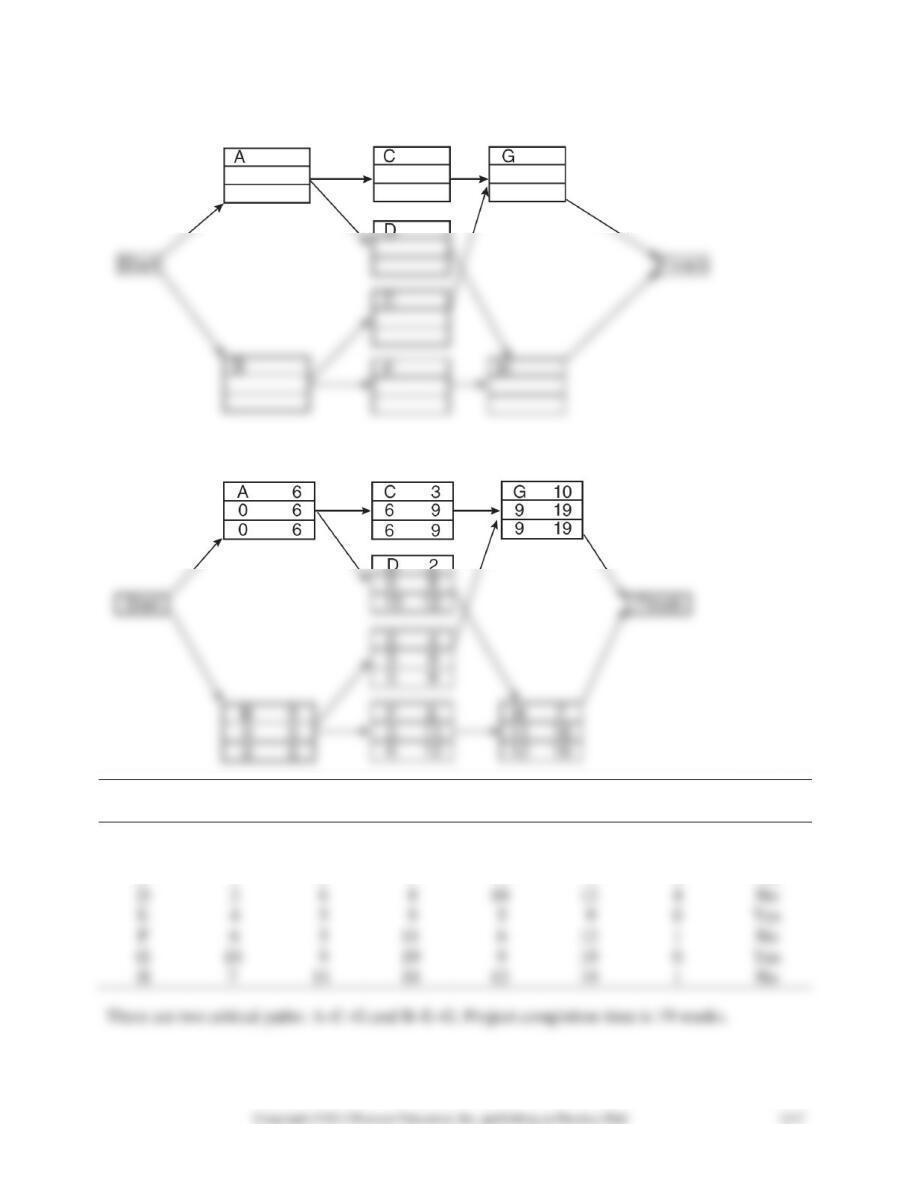
12-23.
The critical path is A–C–E–G–H. Total time is 15 weeks.
1. Activities A, C, and E all have minimum crash costs per week of $1,000.
2. Reduce activity E by 1 week for a total cost of $1,000. There are now two critical paths.
3. The total project completion time is now 14 weeks and the new critical paths are B–D–G–H
and A–C–E–G–H.
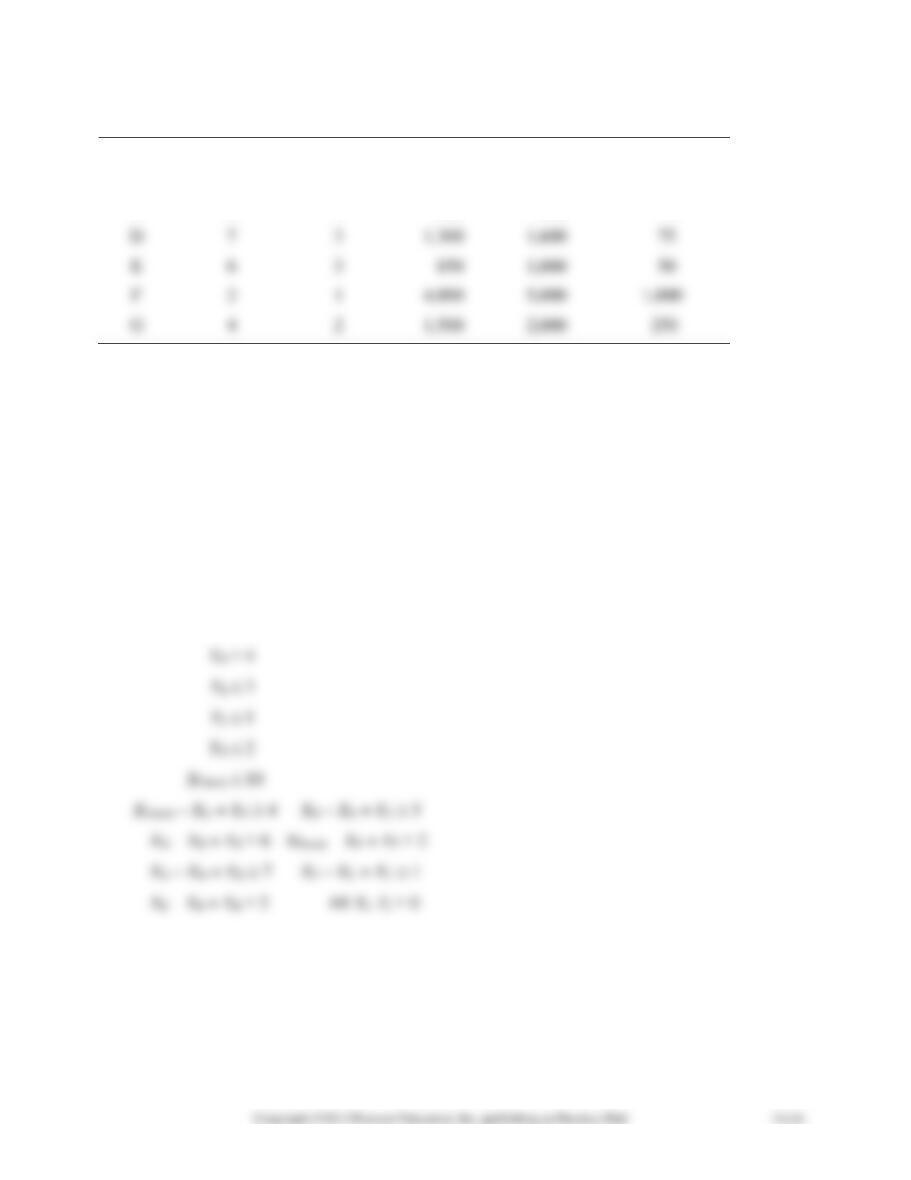
12-24.
Crash Cost
Activity
Normal time
Crash time
Normal cost
Crash cost
per Week
A
3
2
1,000
1,600
$ 600
B
2
1
2,000
2,700
700
C
1
1
300
300
0
D
7
3
1,300
1,600
75
E
6
3
850
1,000
50
F
2
1
4,000
5,000
G
4
2
1,500
2,000
Project completion time is 14. This project has to be crashed to 10. This is done by the following
linear programming formulation:
If Xi is the start time for activity i where i = C, D, E, F, G, and Finish, and Yj is the amount of
time reduced for activity j, where j = A, B, C, D, E, F, G.
Minimize Z = 600YA + 700YB + 0YC + 75YD
+ 50YE + 1,000YF + 250YG
subject to
YA 1
YB 1
YC 0
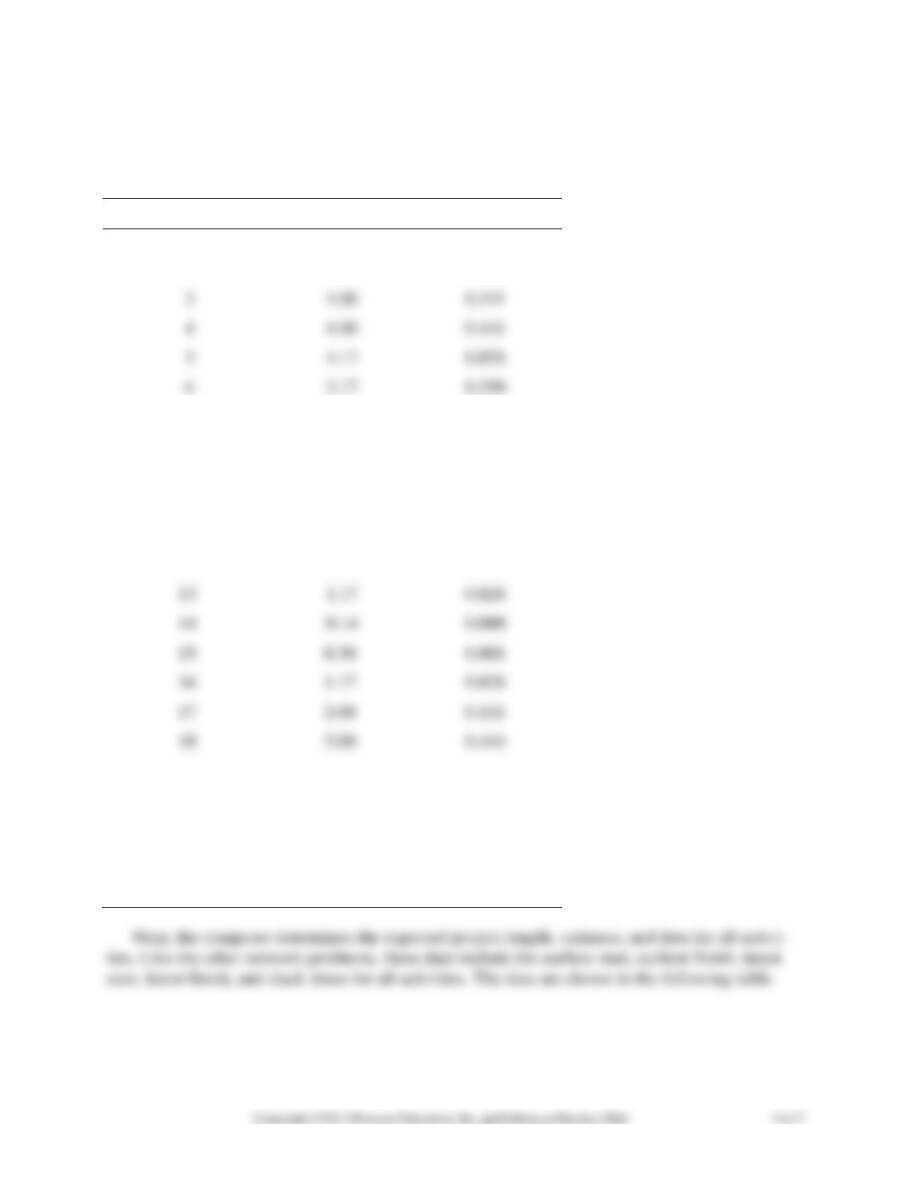
12-25. The Bender Construction Co. problem is one involving 23 separate activities. These ac-
tivities, their immediate predecessors, and time estimates were given in the problem. The first
results of the computer program are the expected time and variance estimates for each activity.
These data are shown in the following table.
Activity
Time
Variance
1
3.67
0.444
2
3.00
0.111
3
4.00
0.111
4
8.00
0.111
0.028
6
2.17
0.250
7
5.00
0.111
8
2.17
0.250
9
3.83
0.028
10
1.17
0.028
11
20.67
1.778
12
2.00
0.111
13
1.17
0.028
14
0.14
0.000
15
0.30
0.001
16
1.17
0.028
17
2.00
0.111
18
5.00
0.444
19
0.12
0.000
20
0.14
0.000
21
3.33
0.444
22
0.12
0.000
23
0.17
0.001
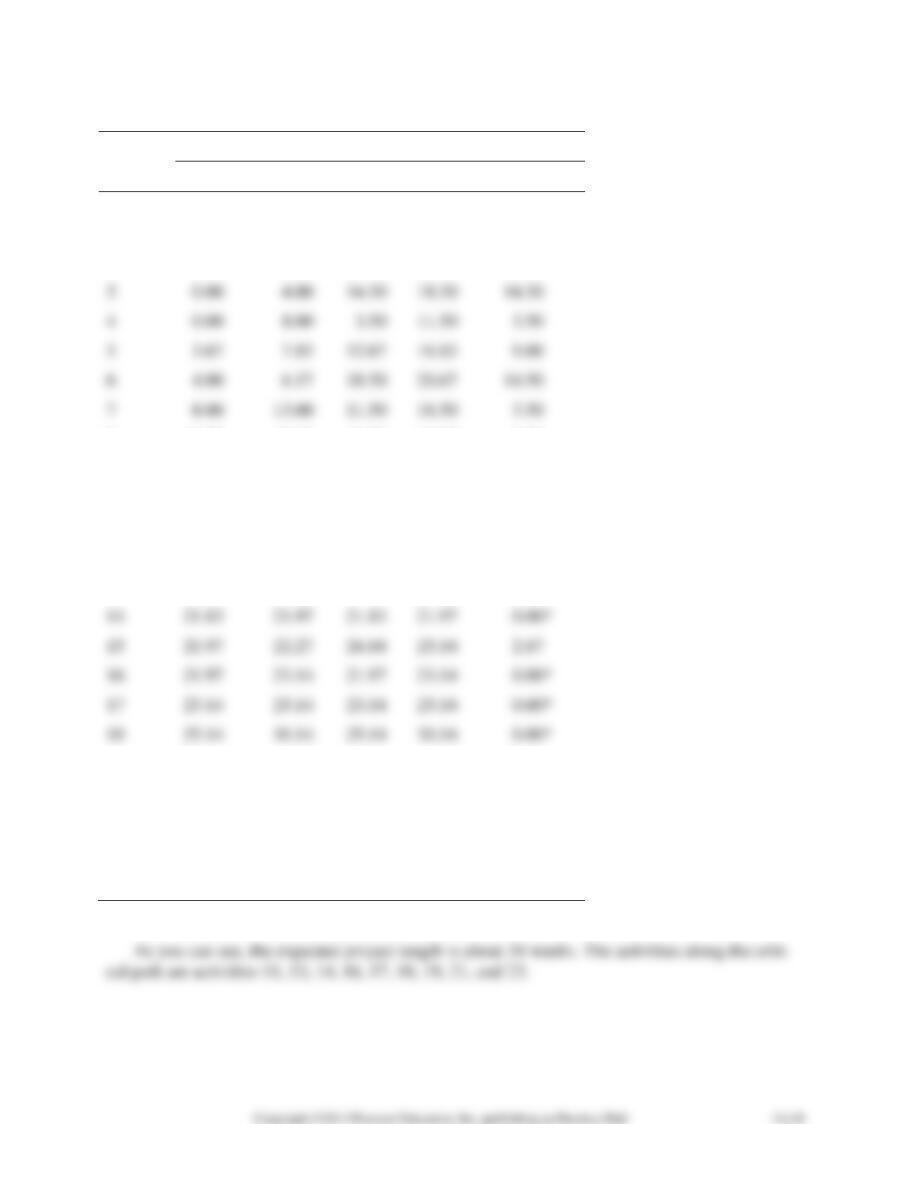
ACTIVITY TIME
Activity
S–F
ES
EF
LS
LF
Slack
1
0.00
3.67
9.00
12.67
9.00
2
0.00
3.00
16.50
19.50
16.50
3
0.00
4.00
14.50
18.50
14.50
4
0.00
8.00
3.50
11.50
3.50
5
3.67
7.83
12.67
16.83
9.00
6
4.00
6.17
18.50
20.67
14.50
7
8.00
13.00
11.50
16.50
3.50
8
13.00
15.17
16.50
18.67
3.50
9
7.83
11.67
16.83
20.67
9.00
10
3.00
4.17
19.50
20.67
16.50
11
0.00
20.67
0.00
20.67
0.00*
12
15.17
17.17
18.67
20.67
3.50
13
20.67
21.83
20.67
21.83
0.00*
15
21.97
22.27
24.84
25.14
2.87
16
21.97
23.14
21.97
23.14
0.00*
17
23.14
25.14
23.14
25.14
0.00*
18
25.14
30.14
25.14
30.14
0.00*
19
30.14
30.25
30.14
30.25
0.00*
20
30.25
30.39
33.33
33.47
3.08
21
30.25
33.59
30.25
33.59
0.00*
22
30.39
30.51
33.47
33.59
3.08
23
33.59
33.77
33.59
33.77
0.00*
*Indicates critical path activity.
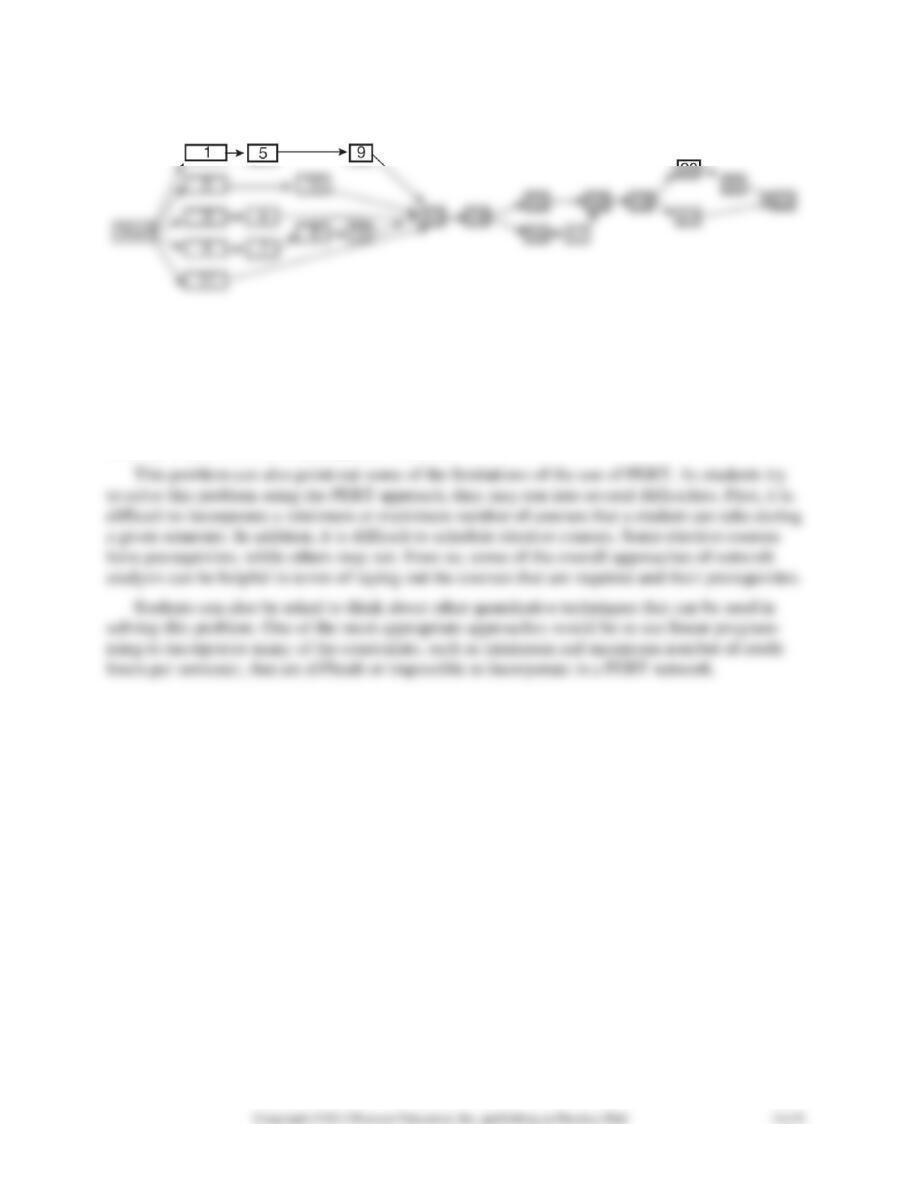
Figure for Problem 12-25: Activities for Bender Constructions
12-26. The overall purpose of Problem 12-26 is to have students use a network approach in at-
tempting to solve a problem that almost all students face. The first step is for students to list all
courses that they must take, including possible electives, to get a degree from their particular col-
lege or university. For every course, students should list all the immediate predecessors. Then
students are asked to attempt to develop a network diagram that shows these courses and their
immediate predecessors or prerequisite courses.
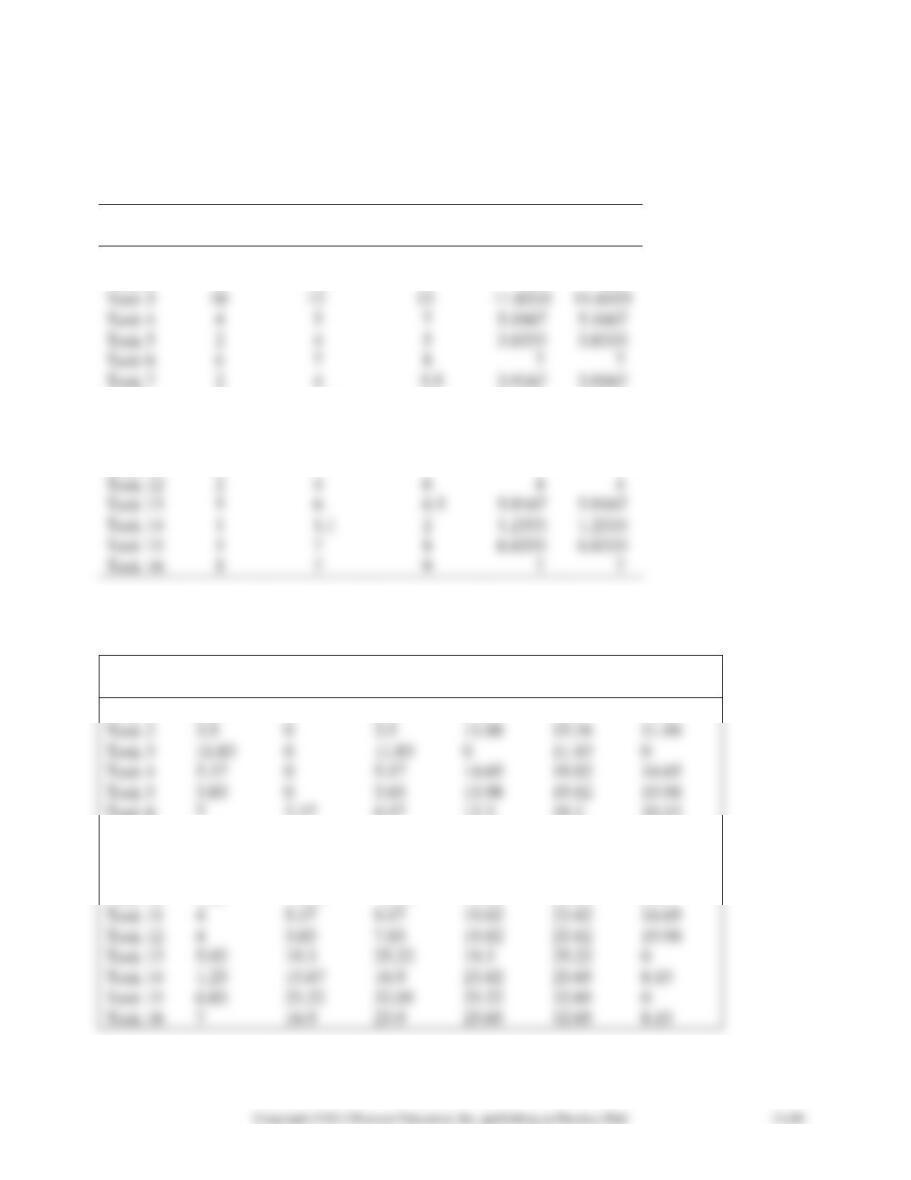
12-27. a. This project management problem can be solved using the PERT model discussed in
the chapter.
Task time computations
Optimistic
Most
Pessimistic
Activity
Activity
Time
Likely Time
Time
Time
Variance
Task 1
1
2
4
2.1667
2.1667
Task 2
3
3.5
4
3.5
3.5
Task 3
10
12
13
11.8333
11.8333
Task 4
4
5
7
5.1667
5.1667
Task 5
2
4
5
3.8333
3.8333
Task 6
6
7
8
7
7
Task 7
2
4
5.5
3.9167
3.9167
Task 8
5
7.7
9
7.4667
7.4667
Task 9
9.9
10
12
10.3167
10.3167
Task 10
2
4
5
3.8333
3.8333
Task 11
2
4
6
4
4
Task 12
2
4
6
4
4
Task 13
5
6
6.5
5.9167
5.9167
Task 14
1
1.1
2
1.2333
1.2333
Task 15
5
7
8
6.8333
6.8333
Task 16
5
7
9
7
7
The results are in the table. As you can see, the total project completion time is about 32 weeks.
The critical path consists of Tasks 3, 8, 13, and 15.
Activity
Activity
time
Early
Start
Early Fin-
ish
Latest
Start
Latest
Finish
Slack
Task 1
2.17
0
2.17
10.13
12.3
10.13
Task 2
3.5
0
3.5
11.88
15.38
11.88
Task 3
11.83
0
11.83
0
11.83
0
Task 4
5.17
0
5.17
14.65
19.82
14.65
Task 5
3.83
0
3.83
15.98
19.82
15.98
Task 6
7
2.17
9.17
12.3
19.3
10.13
Task 7
3.92
3.5
7.42
15.38
19.3
11.88
Task 8
7.47
11.83
19.3
11.83
19.3
0
Task 9
10.32
11.83
22.15
14.9
25.22
3.07
Task 10
3.83
11.83
15.67
19.98
23.82
8.15
Task 11
4
5.17
9.17
19.82
23.82
14.65
Task 12
4
3.83
7.83
19.82
23.82
15.98
Task 13
5.92
19.3
25.22
19.3
25.22
0
Task 14
1.23
15.67
16.9
23.82
25.05
8.15
Task 15
6.83
25.22
32.05
25.22
32.05
0
Task 16
7
16.9
23.9
25.05
32.05
8.15
Project completion time = 32.05