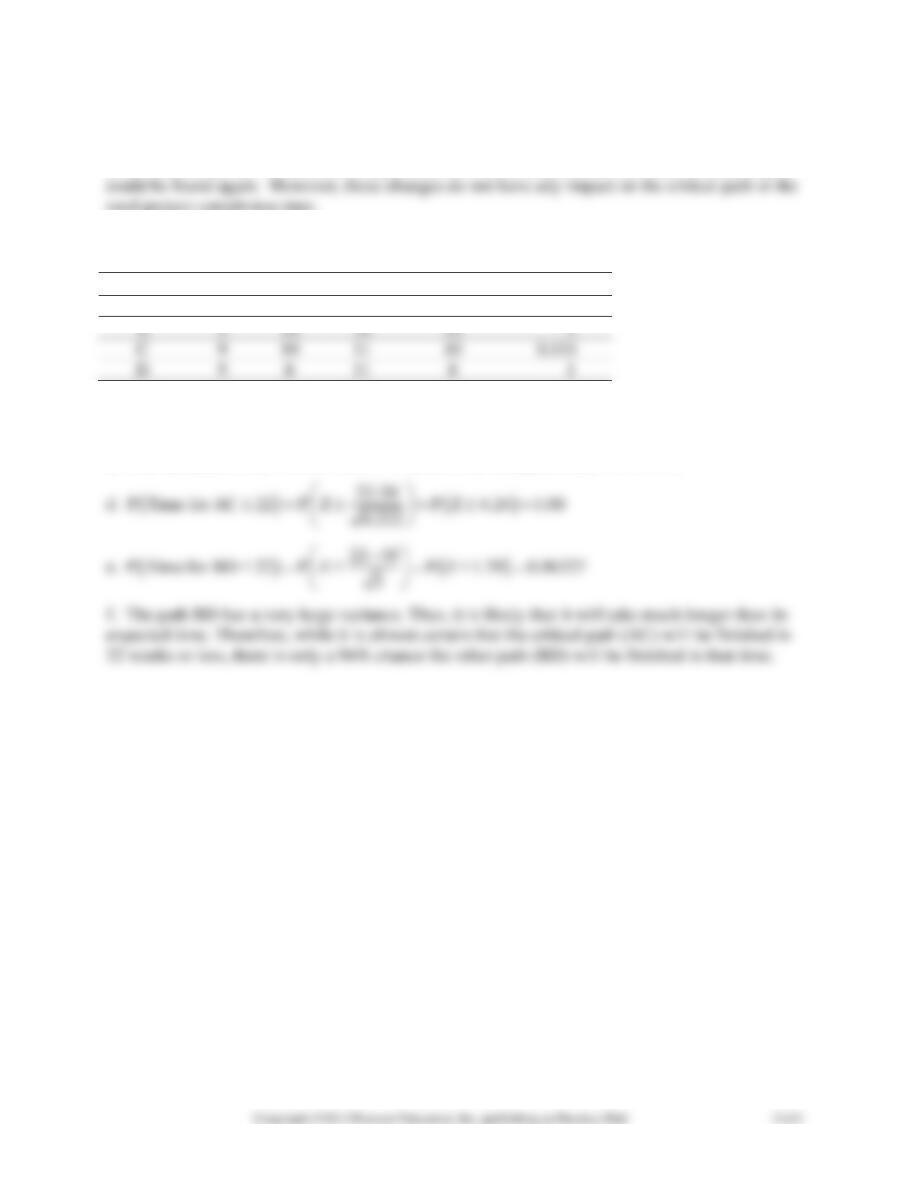
Project standard deviation = 1.003466
b. If Task 9 and 10 were not necessary, a time of 0 could be given for each and the critical path
total project completion time.
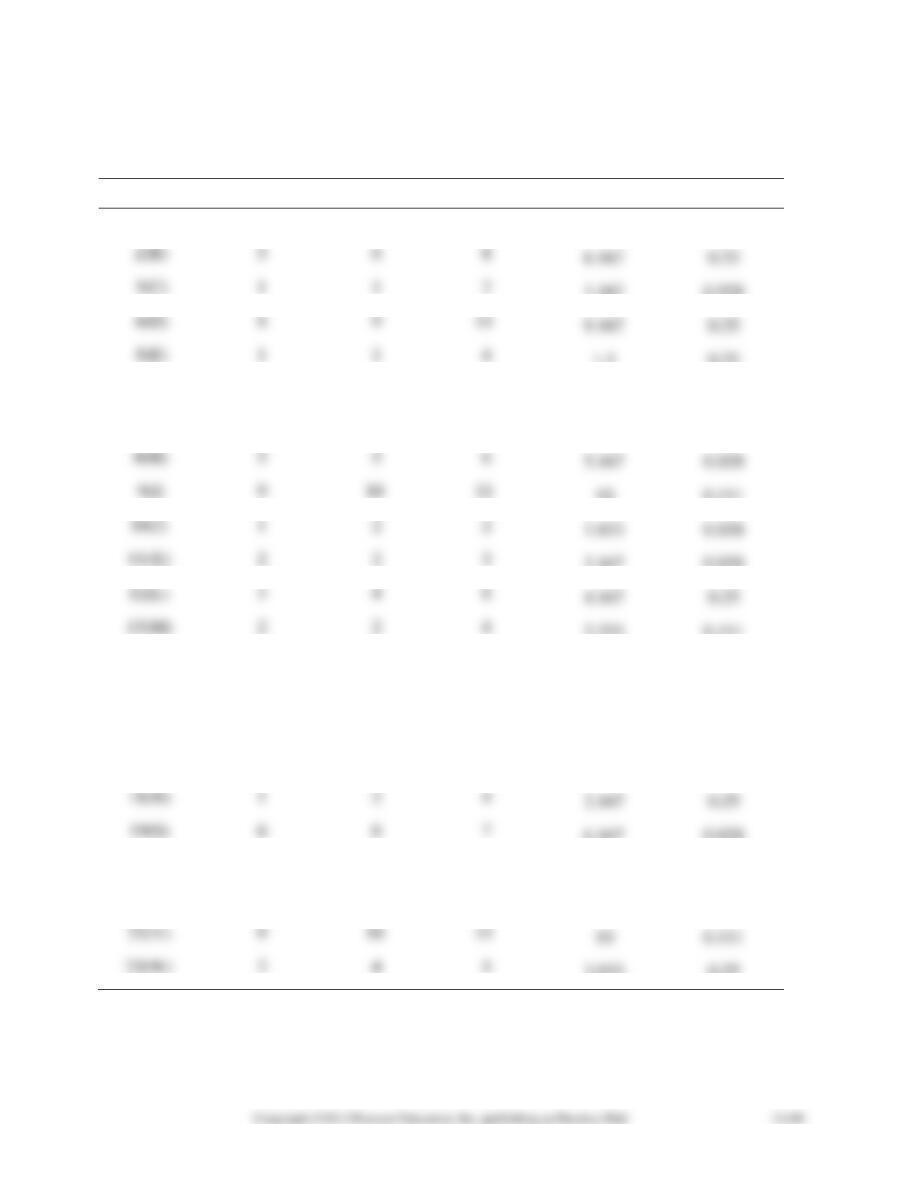
12-28. a.
Activity
a
m
b
t
2
A
9
10
11
10
0.111
B
4
10
16
10
C
9
10
11
10
0.111
D
5
11
b. The critical path is AC with an expected completion time of 20. The expected completion
time of BD is 18.
c. The variance of AC = 0.111 + 0.111 = 0.222. The variance of BD = 4 + 1 = 5.
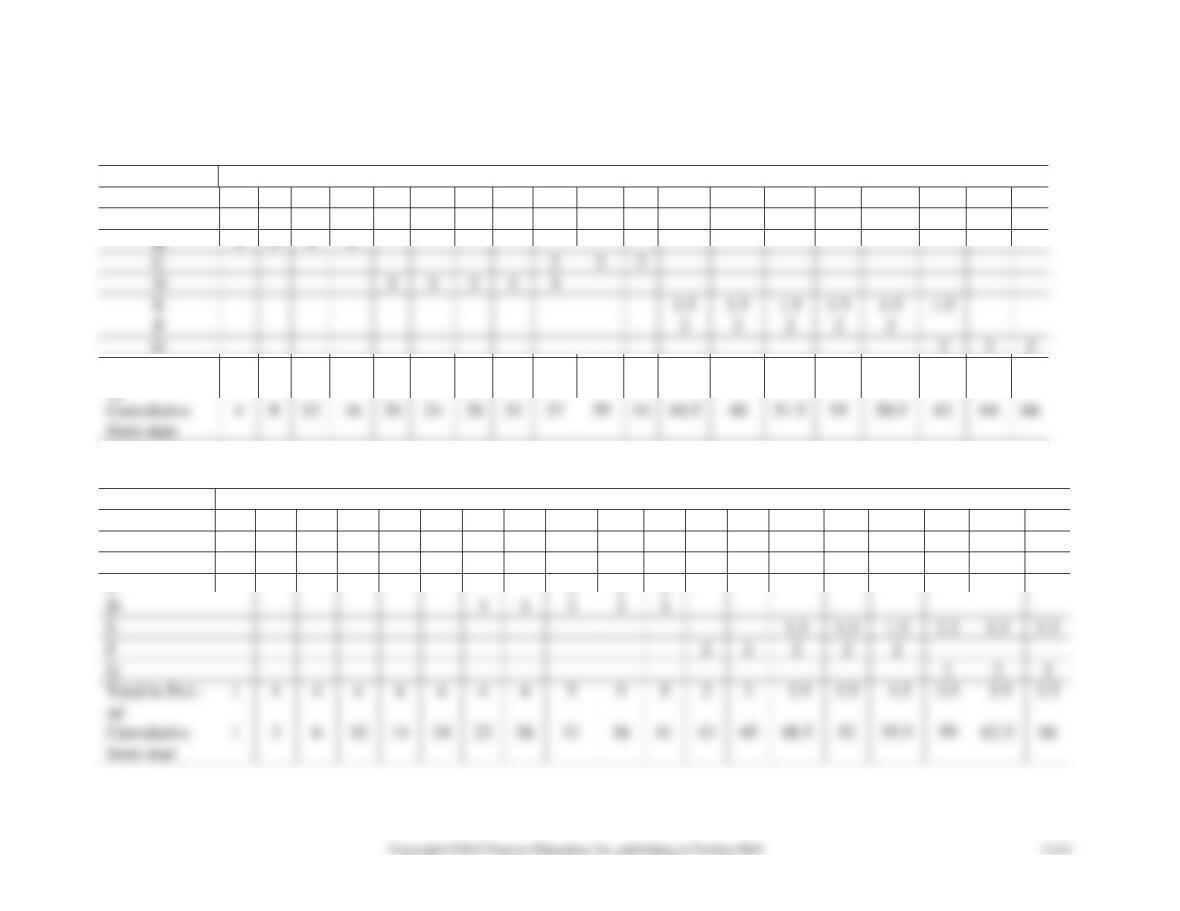
12-29 a.
Budget schedule based on earliest times. Costs are in $1,000s
WEEK
ACTIVITY
1
2
3
4
5
6
7
8
9
10
11
12
13
14
15
16
17
18
19
A
1
1
1
1
1
1
1
1
B
3
3
3
3
C
2
2
2
D
3
3
3
3
3
E
1.5
1.5
1.5
1.5
1.5
1.5
2
2
2
2
2
G
2
2
2
Total in Peri-
od
4
4
4
4
4
4
4
4
5
2
2
3.5
3.5
3.5
3.5
3.5
3.5
2
2
Cumulative
from start
4
8
16
20
24
32
37
39
41
48
55
58.5
62
64
b. Budget schedule based on latest times. Costs are in $1,000s.
WEEK
ACTIVITY
1
2
3
4
5
6
7
8
9
10
11
12
13
14
15
16
17
18
19
A
1
1
1
1
1
1
1
1
B
3
3
3
3
C
2
2
2
D
3
3
3
3
3
E
1.5
1.5
1.5
1.5
F
2
2
2
2
2
G
2
2
2
Total in Peri-
od
1
1
4
4
4
4
4
4
5
2
2
3.5
3.5
3.5
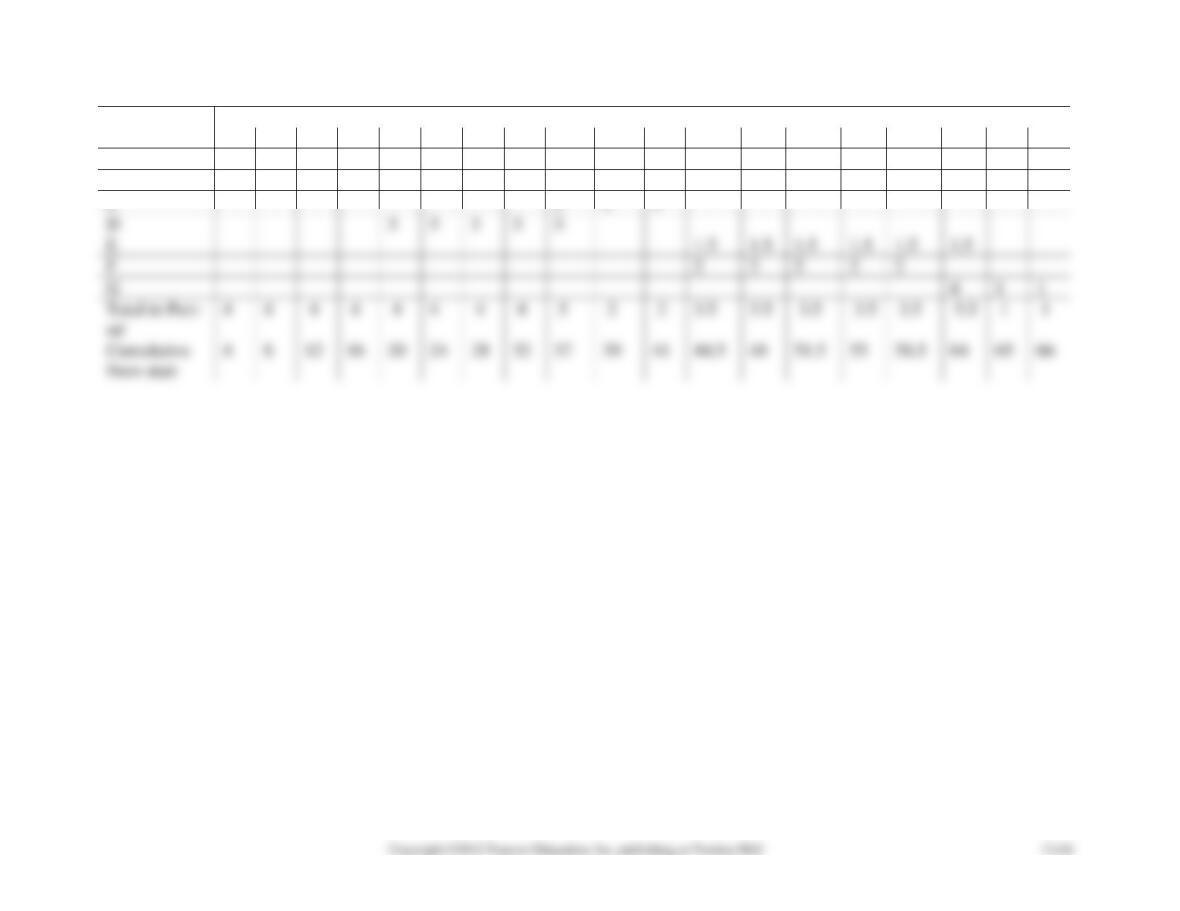
c. Budget schedule based on earliest times. Costs are in $1,000s.
WEEK
ACTIVITY
1
2
3
4
5
6
7
8
9
10
11
12
13
14
15
16
17
18
19
A
1
1
1
1
1
1
1
1
B
3
3
3
3
C
2
2
2
D
3
3
3
3
3
E
1.5
1.5
1.5
1.5
1.5
1.5
F
2
2
2
2
2
G
4
1
1
od
from start
12-30. The total time to complete the project is 17 weeks. The critical path is A-E-G-H.
12-31. a. Crash G 1 week at an additional cost of $700.
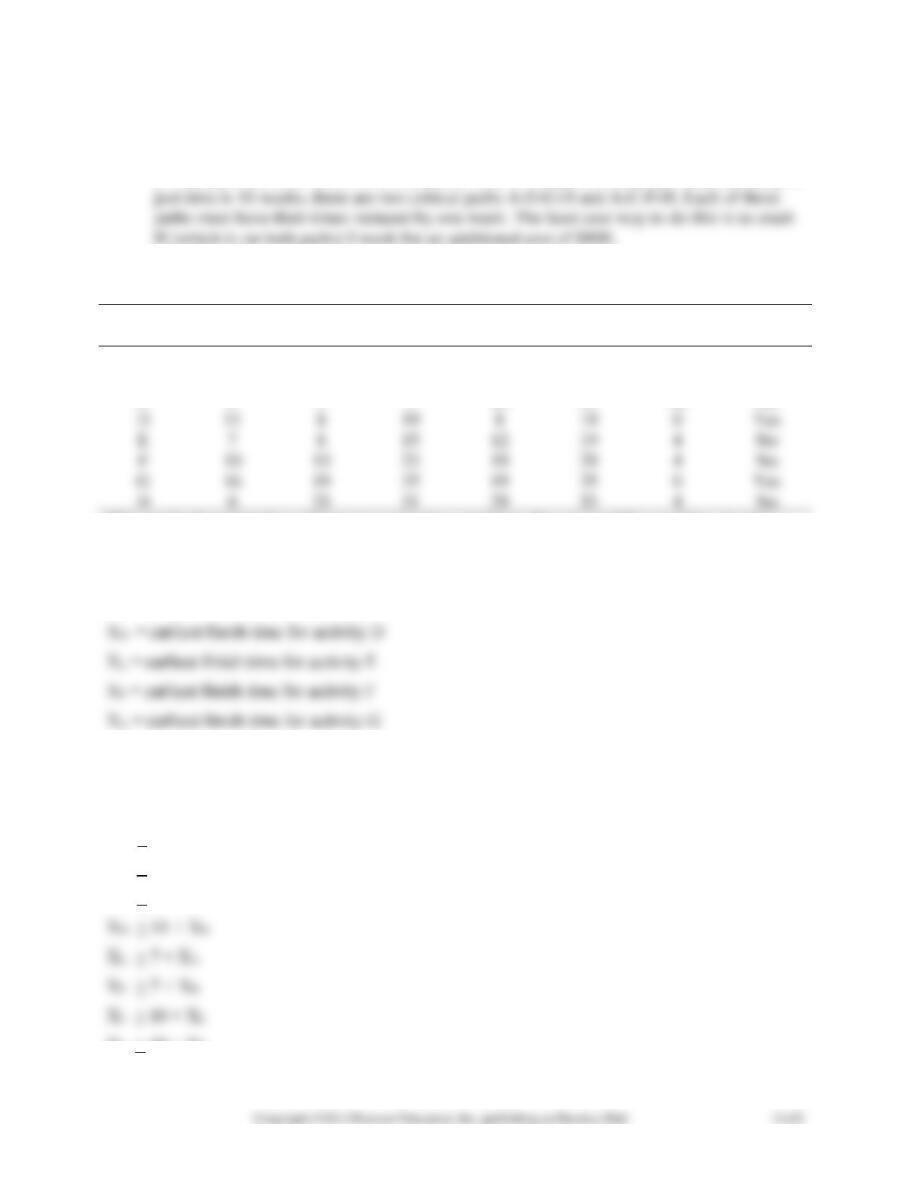
b. The paths are A-E-G-H, A-C-F-H, and B-D-G-H. When G is crashed 1 week so the pro-
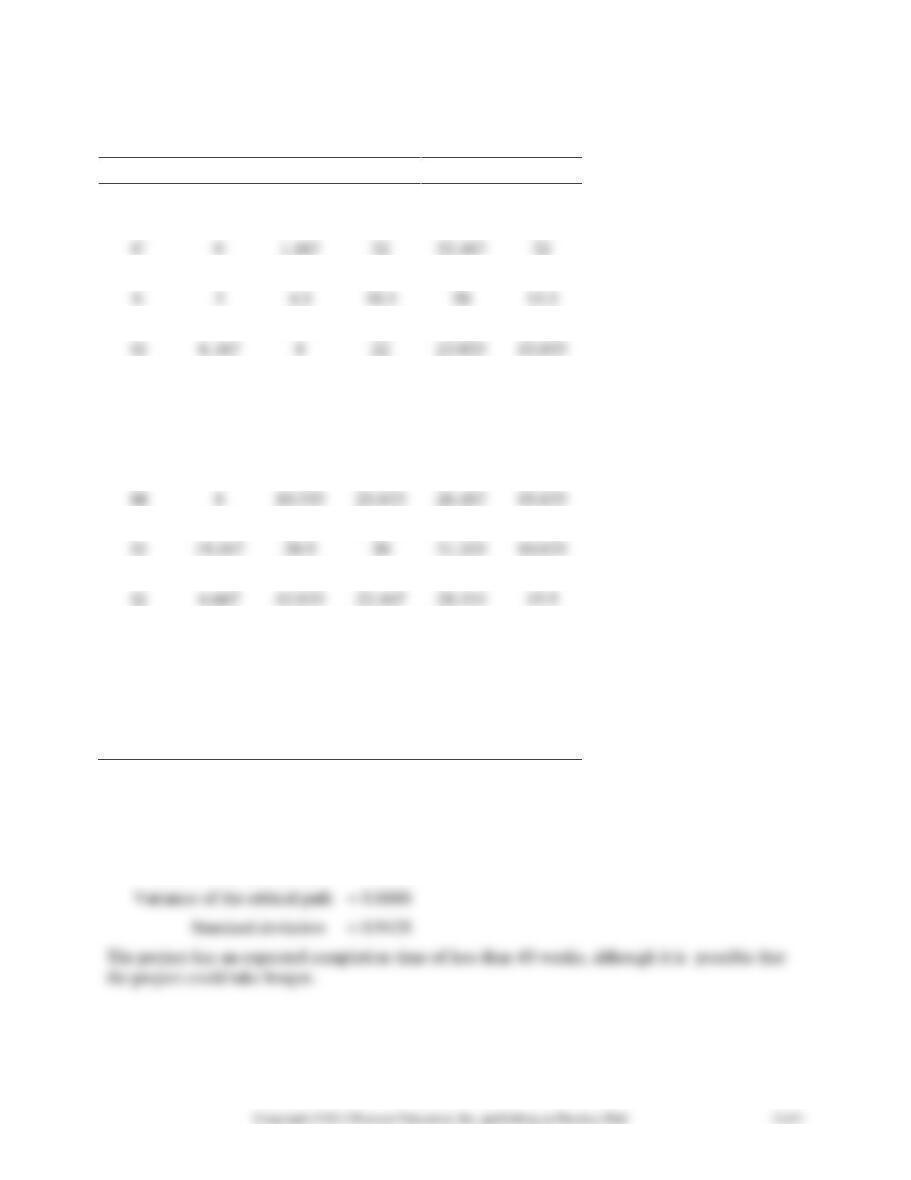
12-32.
Time
Critical
Activity
(Weeks)
ES
EF
LS
LF
S
Activity
A
4
0
4
8
12
8
No
B
8
0
8
0
8
0
Yes
C
5
4
9
14
19
10
No
D
11
8
19
8
19
0
Yes
E
7
8
15
12
19
4
No
F
10
25
19
29
4
No
G
16
35
19
35
0
Yes
H
6
31
29
35
4
No
This can be formulated as a linear programming, similar to the one used for crashing. Let XA =
earliest finish time for activity A
XB = earliest finish time for activity B
XC = earliest finish time for activity C
XH = earliest finish time for activity H
Minimize XH
Subject to
XA > 4
XB > 8
XC > 5 + XA
XF > 10 + XE
XG > 16 + XD
XH > 6 + XF
SOLUTIONS TO INTERNET HOMEWORK PROBLEMS
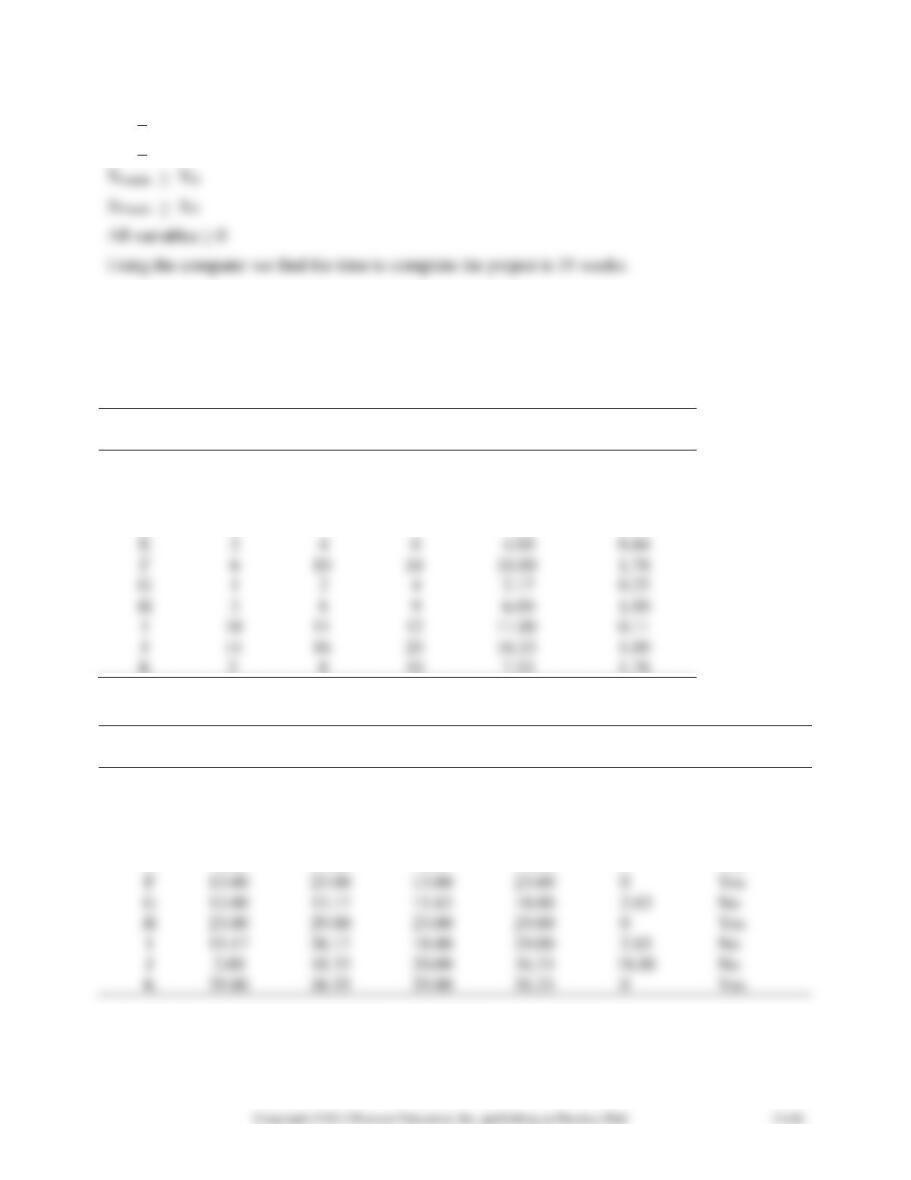
12-33.
Expected
Activity
a
m
b
Time
Variance
A
3
6
8
5.83
0.69
B
2
4
4
3.67
0.11
C
1
2
3
2.00
0.11
D
6
7
8
7.00
0.11
2
4
6
4.00
0.44
6
10
14
10.00
1.78
G
1
2
4
2.17
0.25
H
3
6
9
6.00
1.00
11
12
11.00
0.11
16
20
16.33
1.00
K
2
8
10
7.33
1.78
12-34. A network for the project is shown in the figure.
Critical
Activity
ES
EF
LS
LF
Slack
Path
A
0
5.83
7.17
13.00
7.17
No
B
0
3.67
5.33
9.00
5.33
No
C
0
2.00
0
2.00
0
Yes
D
2.00
9.00
2.00
9.00
0
Yes
E
9.00
13.00
9.00
13.00
0
Yes
F
13.00
23.00
13.00
23.00
0
Yes
G
13.00
15.17
15.83
18.00
2.83
No
H
23.00
29.00
23.00
29.00
0
Yes
15.17
26.17
18.00
29.00
2.83
No
2.00
18.33
20.00
36.33
18.00
No
K
29.00
36.33
29.00
36.33
0
Yes
The critical path is C–D–E–F–H–K. Project completion time is 36.33.
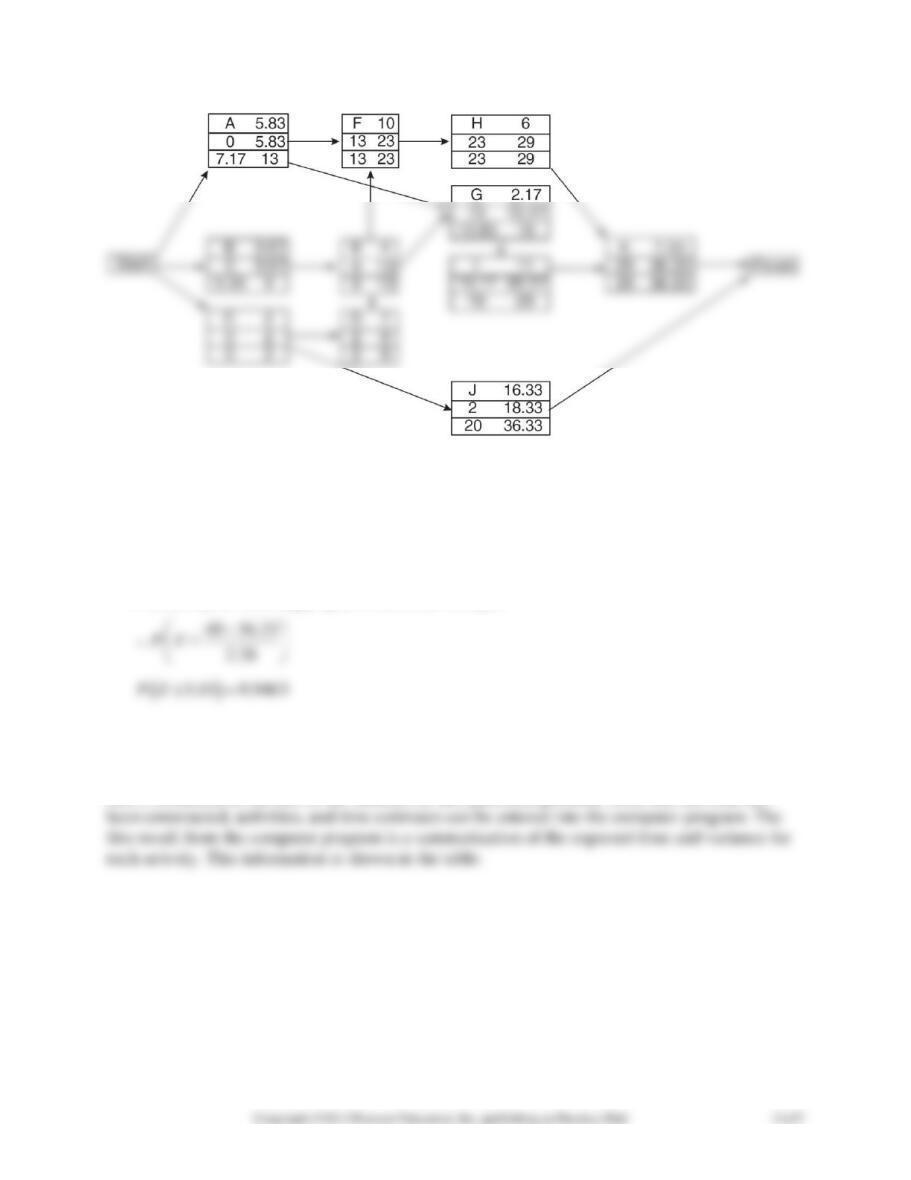
Figure for Problem 12-34
12-35. For the project, expected time = 36.33.
Vt = 0.11 + 0.11 + 0.44 + 1.78 + 1.00 + 1.78 = 5.22
Standard deviation = 2.28.
Probability of finishing project in less than 40 days:
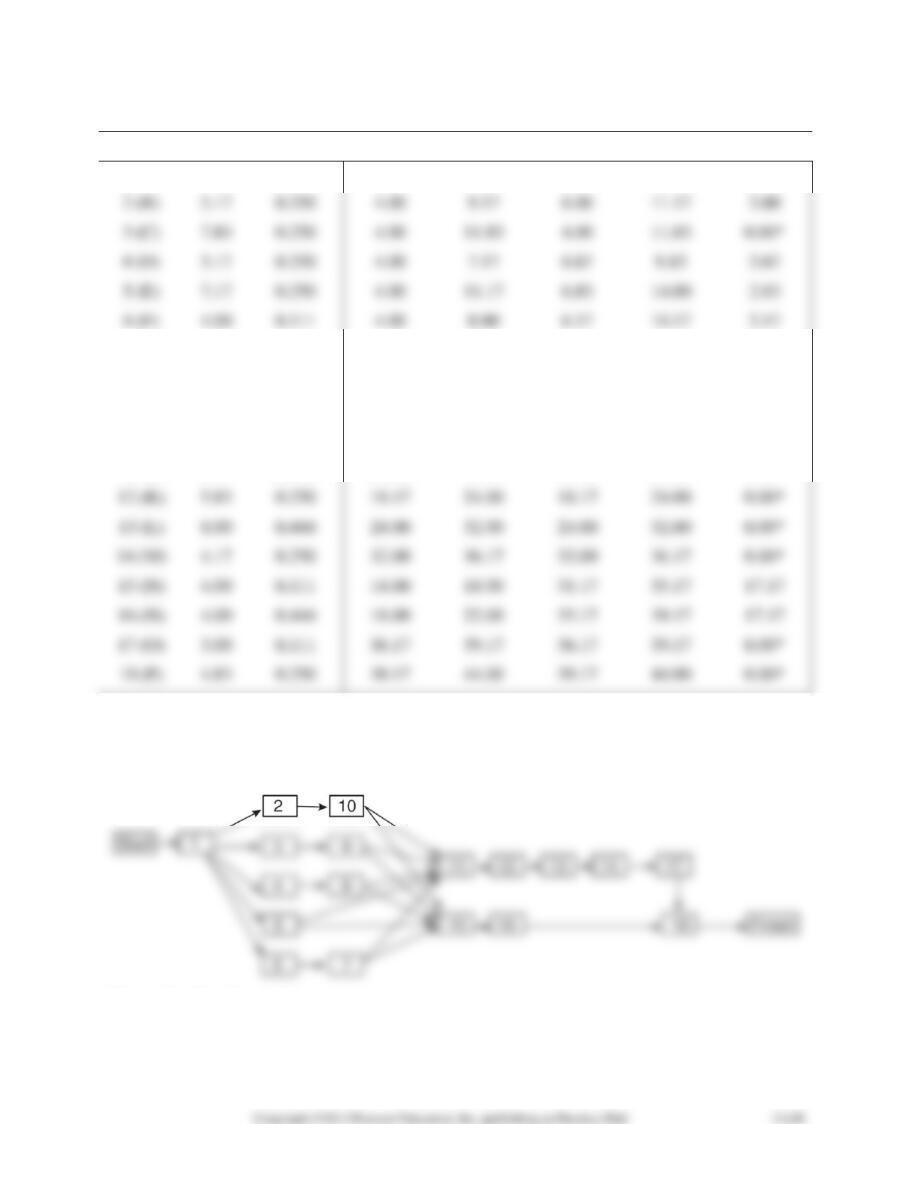
12-36. Before we can determine how long it will take team A to complete its programming as-
signment, we must develop a PERT diagram. The network showing the activities and node num-
bers is contained at the end of the solution for this particular problem. Once this network has
Activity
Time
Variance
ES
EF
LS
LF
Slack
1 (A)
4.00
0.111
0.00
4.00
0.00
4.00
0.00*
5.17
0.250
4.00
9.17
6.00
11.17
2.00
7.83
0.250
4.00
11.83
4.00
11.83
0.00*
4 (D)
3.17
0.250
4.00
7.17
6.67
9.83
2.67
7.17
0.250
4.00
11.17
6.83
14.00
2.83
4.00
0.111
4.00
8.00
6.17
10.17
2.17
7 (G)
3.83
0.250
8.00
11.83
10.17
14.00
2.17
8 (H)
4.17
0.250
7.17
11.33
9.83
14.00
2.67
9 (I)
2.17
0.250
11.83
14.00
11.83
14.00
0.00*
10 (J)
2.83
0.250
9.17
12.00
11.17
14.00
2.00
11 (J)
4.17
0.250
14.00
18.17
14.00
18.17
0.00*
5.83
0.250
18.17
24.00
18.17
24.00
0.00*
8.00
0.444
24.00
32.00
24.00
32.00
0.00*
14 (M)
4.17
0.250
32.00
36.17
32.00
36.17
0.00*
4.00
0.111
14.00
18.00
31.17
35.17
17.17
3.00
0.111
36.17
39.17
36.17
39.17
0.00*
4.83
0.250
39.17
44.00
39.17
44.00
0.00*
*Indicates critical path activity.
Figure for Problem 12-36
The expected project completion time is 44 weeks, and the variance is 2.167.
As can be seen in the table, the critical path for this particular problem includes activities 1,
3, 9, 11, 12, 13, 14, 17, and 18. The solution, however, is not complete. Software Development
Specialist (SDS) is not sure about the time estimates for activity 5. As indicated in the problem,
ity. We are able to go back to the original data, modify the time estimates for these activities, and
resolve the problem. Doing this will result in an expected project completion time of 47.83
weeks. The variance of the project is approximately 1.92 weeks. Will this change the critical
path? The answer is yes. The critical path now includes activities 1, 5, 11, 12, 13, 14, 17, and 18.
Activity 5 now lies along the critical path. The earliest start, earliest finish, latest start, latest fin-
ish, and slack times for all activities with the new time estimate for activity 5 of 13.83 is shown
in the table:
ACTIVITY TIME
Activity
ES
EF
LS
LF
Slack
1
0.00
4.00
0.00
4.00
0.00*
2
4.00
9.17
9.83
15.00
5.83
3
4.00
11.83
7.83
15.67
3.83
4
4.00
7.17
10.50
13.67
6.50
6
4.00
8.00
10.00
14.00
6.00
7
8.00
11.83
14.00
17.83
6.00
8
7.17
11.33
13.67
17.83
6.50
9
11.83
14.00
15.67
17.83
3.83
10
9.17
12.00
15.00
17.83
5.83
11
17.83
22.00
17.83
22.00
0.00*
12
22.00
27.83
22.00
27.83
0.00*
13
27.83
35.83
27.83
35.83
0.00*
14
35.83
40.00
35.83
40.00
0.00*
15
17.83
21.83
35.00
39.00
17.17
16
21.83
25.83
39.00
43.00
17.17
17
40.00
43.00
40.00
43.00
0.00*
18
43.00
47.83
43.00
47.83
0.00*
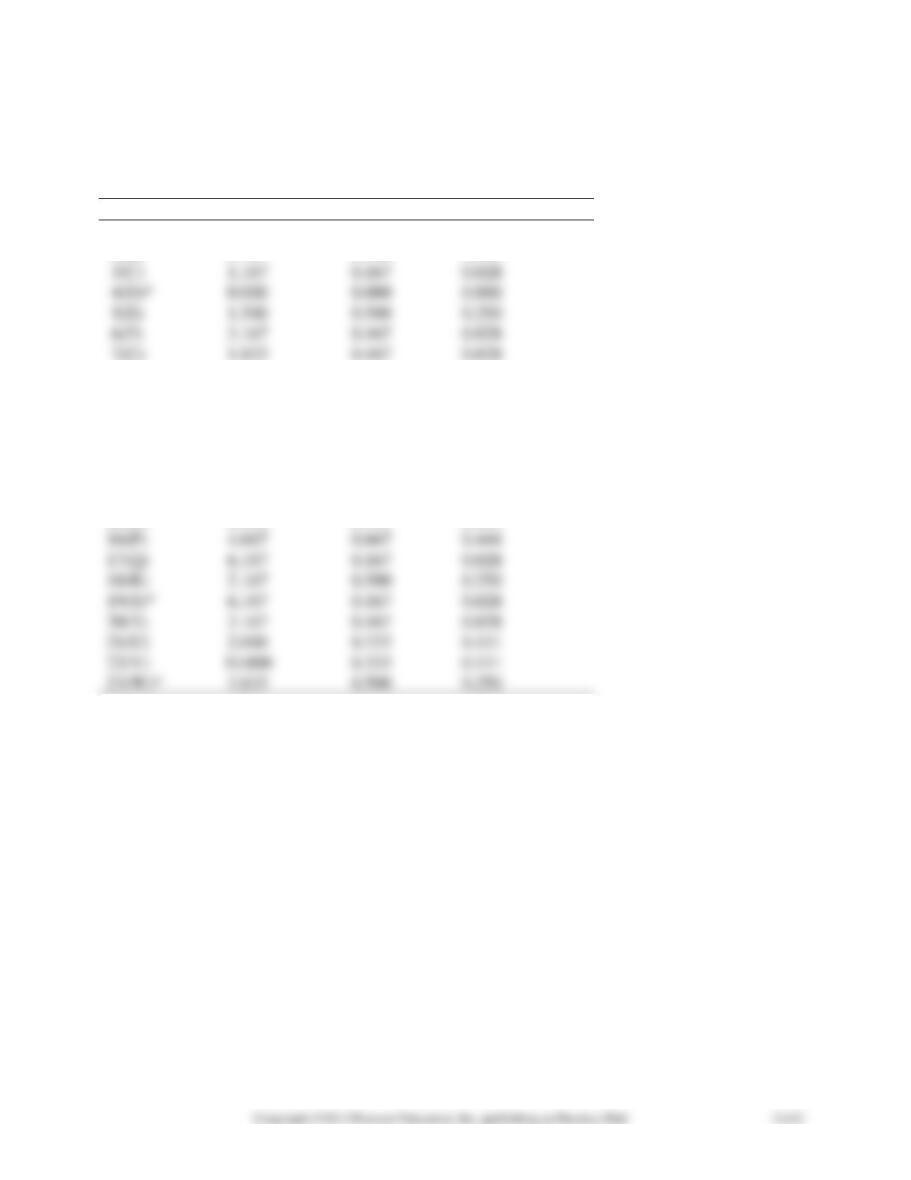
12-37 a. The first step for Jim Sager is to summarize the time estimates for each of the activi-
ties, and compute the expected time and the standard variance for each activity. These are
shown in the following table.
Activity
Optimistic
Likely
Pessimistic
Time
Variance
1(A)
2
3
4
3
0.111
2(B)
5
6
8
6.167
0.25
3(C)
1
1
2
1.167
0.028
4(D)
8
9
11
9.167
0.25
1
1
4
1.5
0.25
6(F)
3
3
4
3.167
0.028
7(G)
1
2
2
1.833
0.028
8(H)
5
5
6
5.167
0.028
9
11
10
0.111
10(J)
1
2
2
1.833
0.028
11(K)
2
2
3
2.167
0.028
12(L)
3
4
6
4.167
0.25
2
2
4
2.333
0.111
14(N)
8
9
11
9.167
0.25
15(O)
1
1
3
1.333
0.111
16(P)
4
4
8
4.667
0.444
17(Q)
6
6
7
6.167
0.028
1
2
4
2.167
0.25
19(S)
6
6
7
6.167
0.028
20(T)
3
3
4
3.167
0.028
21(U)
1
2
3
2
0.111
22(V)
9
11
10
0.111
2
4
5
3.833
0.25
Earliest and latest start and finish times (ES, EF, LS, and LF) and slack times are then com-
puted for each activity. This is shown in the table.
Activity
ES
EF
LS
LF
Slack
A
0
3
15.5
18.5
15.5
B
0
6.167
12.667
18.833
12.667
C
0
1.167
32
33.167
32
D
0
9.167
0
9.167
0
E
3
4.5
18.5
20
15.5
F
6.167
9.333
18.833
22
12.667
G
6.167
8
22
23.833
15.833
H
1.167
6.333
33.167
38.333
32
I
9.167
19.167
9.167
19.167
0
J
9.167
11
26
27.833
16.833
K
4.5
6.667
20
22.167
15.5
L
9.333
13.5
22
26.167
12.667
8
10.333
23.833
26.167
15.833
N
19.167
28.333
19.167
28.333
0
O
19.167
20.5
30
31.333
10.833
P
11
15.667
27.833
32.5
16.833
Q
6.667
12.833
22.167
28.333
15.5
R
13.5
15.667
26.167
28.333
12.667
S
28.333
34.5
28.333
34.5
0
T
20.5
23.667
31.333
34.5
10.833
U
15.667
17.667
32.5
34.5
16.833
V
15.667
25.667
28.333
38.333
12.667
W
34.5
38.333
34.5
38.333
0
The activities with no slack are on the critical path.
The final network results are summarized:
Expected project length = 38.3333
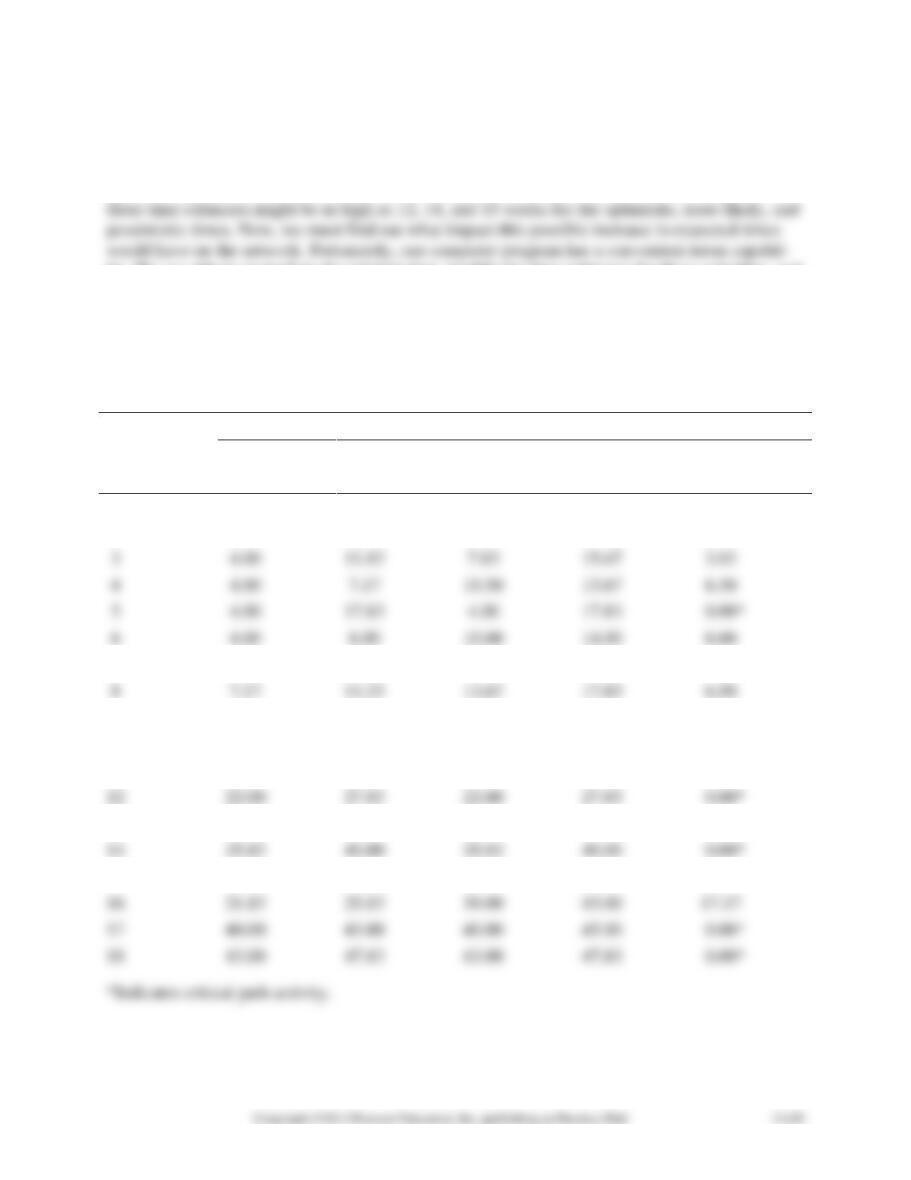
12-38. If activity D has already been completed, activity time for D is 0. The results are shown
in the table. As you can see, activity D (4) is still on the critical path. The project completion
time is now about 29 weeks.
Table for Problem 12-38
Activity
Mean
S.D.
Variance
1(A)
3.000
0.333
0.111
2(B)
6.167
0.500
0.250
3(C)
1.167
0.167
0.028
4(D)*
0.000
0.000
0.000
5(E)
1.500
0.500
0.250
6(F)
3.167
0.167
0.028
7(G)
1.833
0.167
0.028
8(H)
5.167
0.167
0.028
9(I)*
10.000
0.333
0.111
10(J)
1.833
0.167
0.028
11(K)
2.167
0.167
0.028
12(L)
4.167
0.500
0.250
13(M)
2.333
0.333
0.111
14(N)*
9.167
0.500
0.250
15(O)
1.333
0.333
0.111
16(P)
4.667
0.667
0.444
17(Q)
6.167
0.167
0.028
18(R)
2.167
0.500
0.250
19(S)*
6.167
0.167
0.028
20(T)
3.167
0.167
0.028
21(U)
2.000
0.333
0.111
22(V)
10.000
0.333
0.111
23(W)*
3.833
0.500
0.250
*Critical path activities.
Expected completion time is 29.167 weeks.
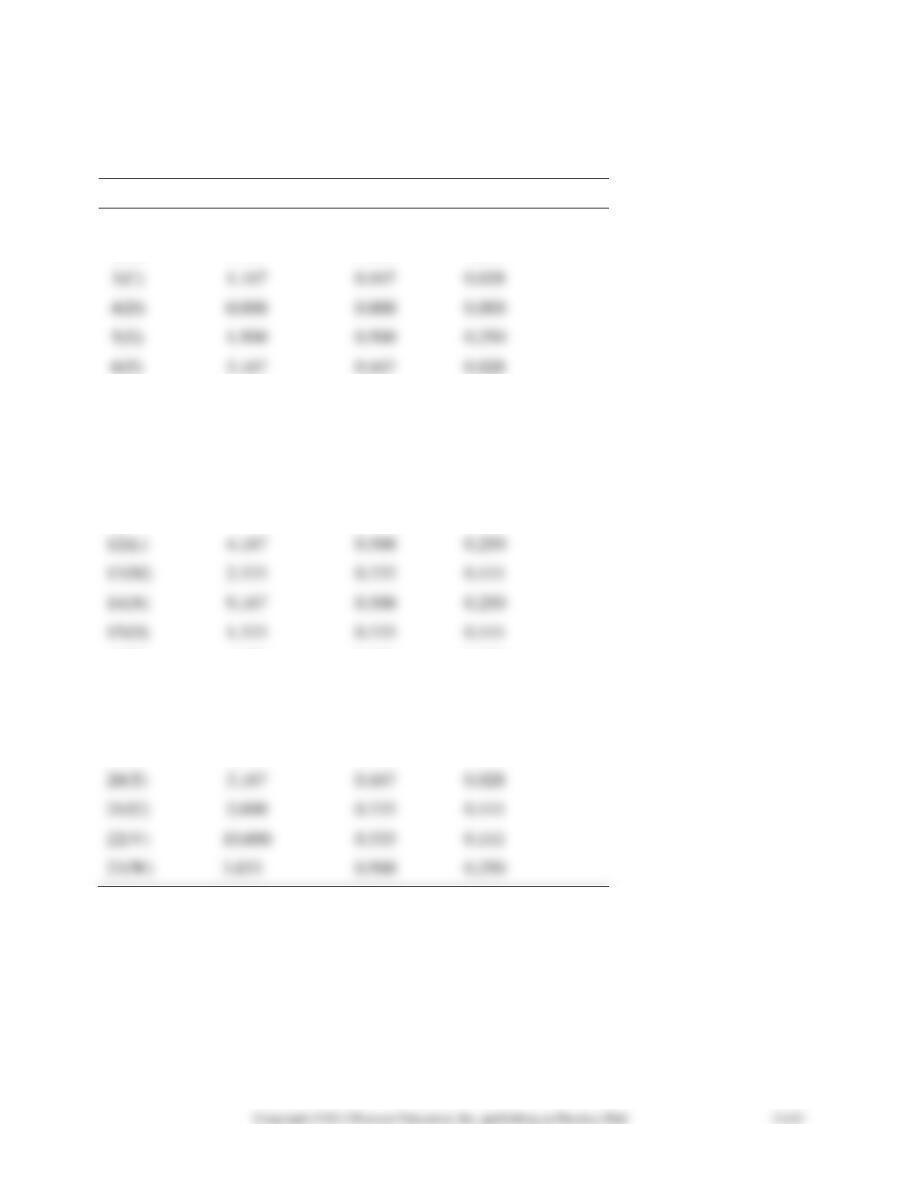
12-39. The results of having both activity D (4) and I (9) completed are shown in the table.
These activities are no longer on the critical path. The project completion time is now about 26
weeks.
Activity
Mean
S.D.
Variance
1(A)
3.000
0.333
0.111
2(B)
6.167
0.500
0.250
3(C)
1.167
0.167
0.028
4(D)
0.000
0.000
0.000
5(E)
1.500
0.500
0.250
7(G)
1.833
0.167
0.028
8(H)
5.167
0.167
0.028
9(I)
0.000
0.000
0.000
10(J)
1.833
0.167
0.028
11(K)
2.167
0.167
0.028
12(L)
4.167
0.500
0.250
13(M)
2.333
0.333
0.111
14(N)
9.167
0.500
0.250
15(O)
1.333
0.333
0.111
16(P)
4.667
0.667
0.444
17(Q)
6.167
0.167
0.028
18(R)
2.167
0.500
0.250
19(S)
6.167
0.167
0.028
20(T)
3.167
0.167
0.028
21(U)
2.000
0.333
0.111
22(V)
10.000
0.333
0.111
23(W)
3.833
0.500
0.250
Critical path activities: B–F–L–R–V
Expected completion time is 25.667 weeks.
12-40. Changing the immediate predecessor activity will change the structure of the network.
Fortunately, we can handle this situation. The results are shown in the table. Activity F (6) now
goes from node 2 to node 7. Node 2 is the ending node for activity A (1). Thus activity F now
has activity A as an immediate predecessor.
Activity
Mean
S.D.
Variance
1(A)
3.000
0.333
0.111
2(B)*
6.167
0.500
0.250
3(C)
1.167
0.167
0.028
4(D)
0.000
0.000
0.000
6(F)*
3.167
0.167
0.028
7(G)
1.833
0.167
0.028
8(H)
5.167
0.167
0.028
9(I)
0.000
0.000
0.000
10(J)
1.833
0.167
0.028
11(K)
2.167
0.167
0.028
12(L)*
4.167
0.500
0.250
13(M)
2.333
0.333
0.111
14(N)
9.167
0.500
0.250
15(O)
1.333
0.333
0.111
16(P)
4.667
0.667
0.444
17(Q)
6.167
0.167
0.028
18(R)*
2.167
0.500
0.250
19(S)
6.167
0.167
0.028
20(T)
3.167
0.167
0.028
21(U)
2.000
0.333
0.111
23(W)
3.833
0.500
0.250
*Critical path activities.
Expected completion time is 22.833 weeks.
SOLUTIONS TO SOUTHWESTERN UNIVERSITY STADIUM CON-
STRUCTION CASE
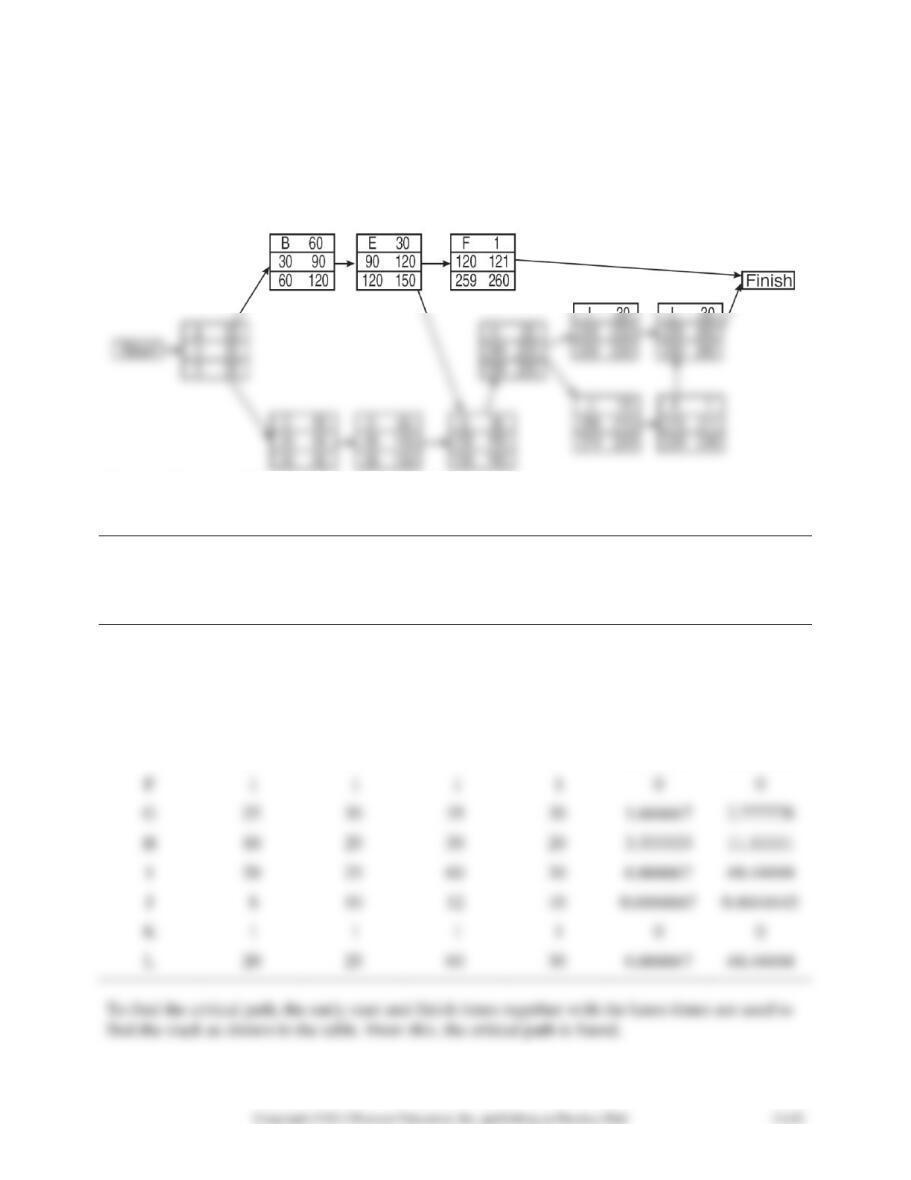
1.
Figure 1 Network Using Activity-On-Node Notation
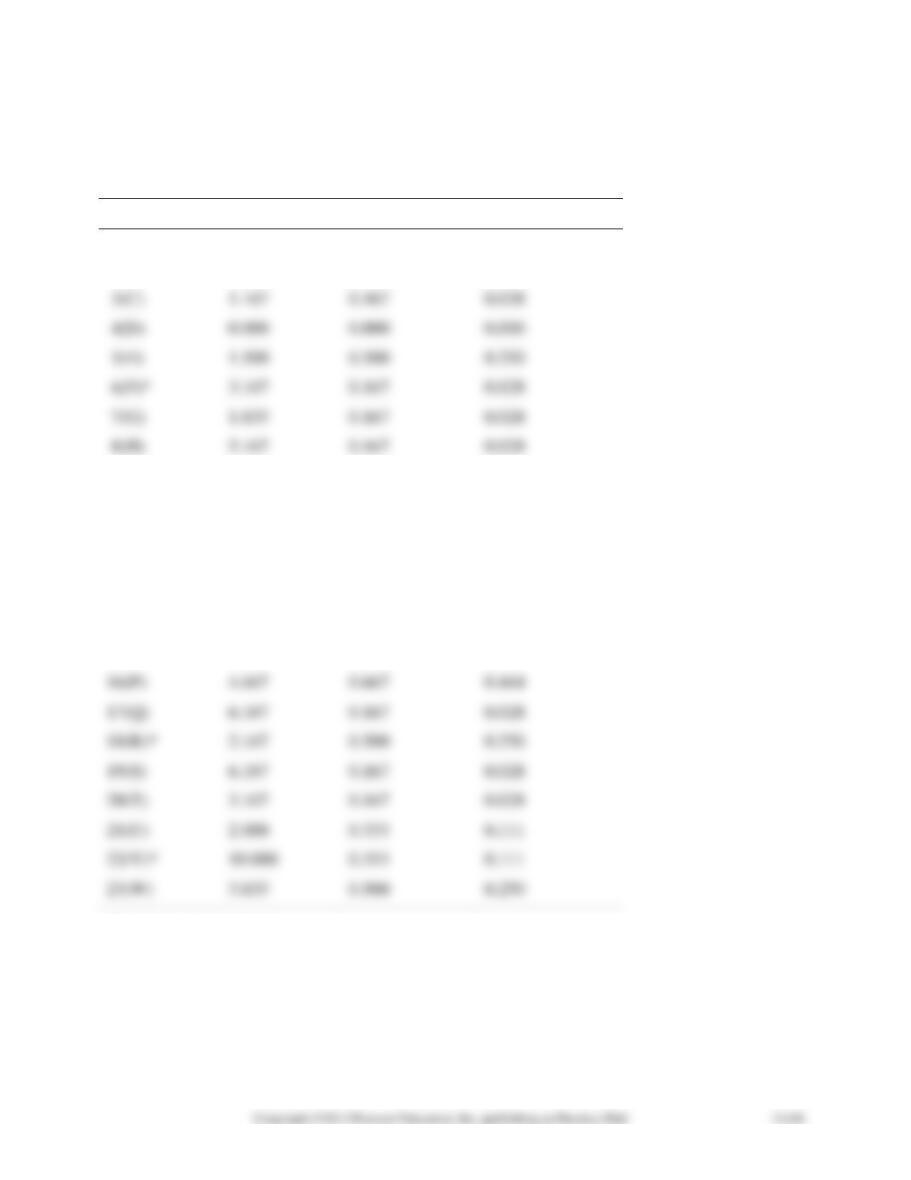
The expected times (t) and the variance for each activity are shown in the table.
Most
Activity
Optimistic
Likely
Pessimistic
time
Standard
Activity
time
time
time
(t)
Deviation
Variance
A
20
30
40
30
3.333333
11.11111
B
20
65
80
60
10
100
C
50
60
100
65
8.333333
69.44444
D
30
50
100
55
11.66667
136.1111
E
25
30
35
30
1.666667
2.777778
G
25
30
35
30
1.666667
2.777778
H
10
20
30
20
3.333333
11.11111
20
25
60
30
6.666667
44.44444
10
12
10
K
L
20
25
60
30
6.666667
44.44444