
Performance Measurement and Strategic Information Management 19
10. A large hospital identified the following strategic priorities:
Patient accessibility
Patient safety
Clinical excellence
Few hassles for patients and families
Workforce well-being
Family-centered care
Operational efficiency
Suggest some measures that align to these strategic priorities. You might wish to do some
research on how hospitals measure patient safety and clinical excellence.
This question requires some understanding of the health care industry. For students without
experience, some research will be necessary. Here are some brief examples that Priscilla Nuwash
made based on her experience at Poudre Valley and as a Baldrige examiner:
Patient
accessibility
ED wait times
Next available appointment
ED to Bed times
Patient safety
Falls with serious injury
Medication near misses
Compliance rates with med reconciliations
Education completion rates
Clinical
excellence
CMS core measures
Risk adjusted mortality
HCAHP CGCAHP
HEDIS measures (screening completion rates
etc)
Few hassles for
patients and
families
Discharge turnaround times
Complaint management (escalation)
Wait times all areas
Survey results for helpful staff, navigating the
hospital, adequate signage etc.
Workforce well-
being
Reward & recognition use rates
OSHA & DART rates
Family-centered
care
Satisfaction results
Participation rates in support groups
Participation rates in educational programs
Time to schedule specialist
Survey results for accessibility
Performance Measurement and Strategic Information Management 20
efficiency
TAT for maintenance of equipment, room
Here are a few excerpts from students in a Masters of Health Administration class that show
some different approaches:
Patient Accessibility: Two measures that could be used here to assess a served population’s
ability to even gain access would be the percentage of that population that is without health
insurance or without personal means of transportation to the hospital itself. This information
could be used to design initiatives tailored to providing care to those who otherwise could not
Patient Safety: Falls per patient are big measure of patient safety in any hospital. Other patient
safety measures include: the rate of urinary catheter and intravenous catheter infections as well
as the number of wrong sided surgery errors (i.e. surgeries performed on the wrong limb). All of
these give an indication of how well staff may be trained or how attentive they are to the proper
procedures and techniques involved with caring for patients.
Few Hassles for Patients and Families: The big measure here is wait times for any service,
whether emergent or not. No one wants to waste any more time than they have to by sitting
around and doing nothing while waiting to be treated. Another could be the rate at which
patients are provided with clear, written instructions pertaining to caring for their condition
Clinical Excellence Clinical excellence is providing quality health care. Again, there are
countless areas to measure when it comes to the quality of care that patients receive. Some of the
most common include:
•
Antibiotics administered prior to surgery
•
Drawing blood cultures
before administering antibiotics in suspected septic patients
•
Time to identifying sepsis from

Performance Measurement and Strategic Information Management 21
Initiatives-Patient-Assessment-Instruments/QualityMeasures/Core-Measures.html are set by the
government in order to track key indicators of quality care and reward high performing
hospitals by way of reimbursement.
Family-centered care
Family members/visitors taking advantage of in-room menu option for dining with patient by
meal with a goal of ___% to be attained by _____ (determined by individual measure).
SUGGESTIONS FOR PROJECTS. ETC.
1. Interview managers at a local airline, hospital, governmental agency, or police
department to determine what types of performance measures or indicators they use. Can
you construct a balanced scorecard for them?
Answers will vary, depending on the experience and interests of the students. For example, an
airline might measure revenue passenger miles and market share at the organizational level,
2. Many restaurants and hotels use “tabletop” customer satisfaction surveys. Find several
of these from local businesses. What internal performance indicators might be good leading
indicators for the customer satisfaction items in the surveys?
The answers will vary here, depending on students’ choice of restaurants from which they gather
3. Interview managers at a local company to identify the key factors that drive their
business. What performance measures or indicators does the company use? Are these
indicators consistent with their business factors?
This field exercise is designed to further student awareness of the breadth of quality management
4. Interview managers at a local company to determine which, if any, of the leading
practices described in this chapter they follow. What advice would you give them?
Performance Measurement and Strategic Information Management 22
This field exercise is designed to further student awareness of the breadth of quality management
ANSWERS TO CASE QUESTIONS
Coyote Community College1
Based on the description of this college and its environment, what specific types of
measures should they include in each of these perspectives of the balanced scorecard? How
would they be measured?
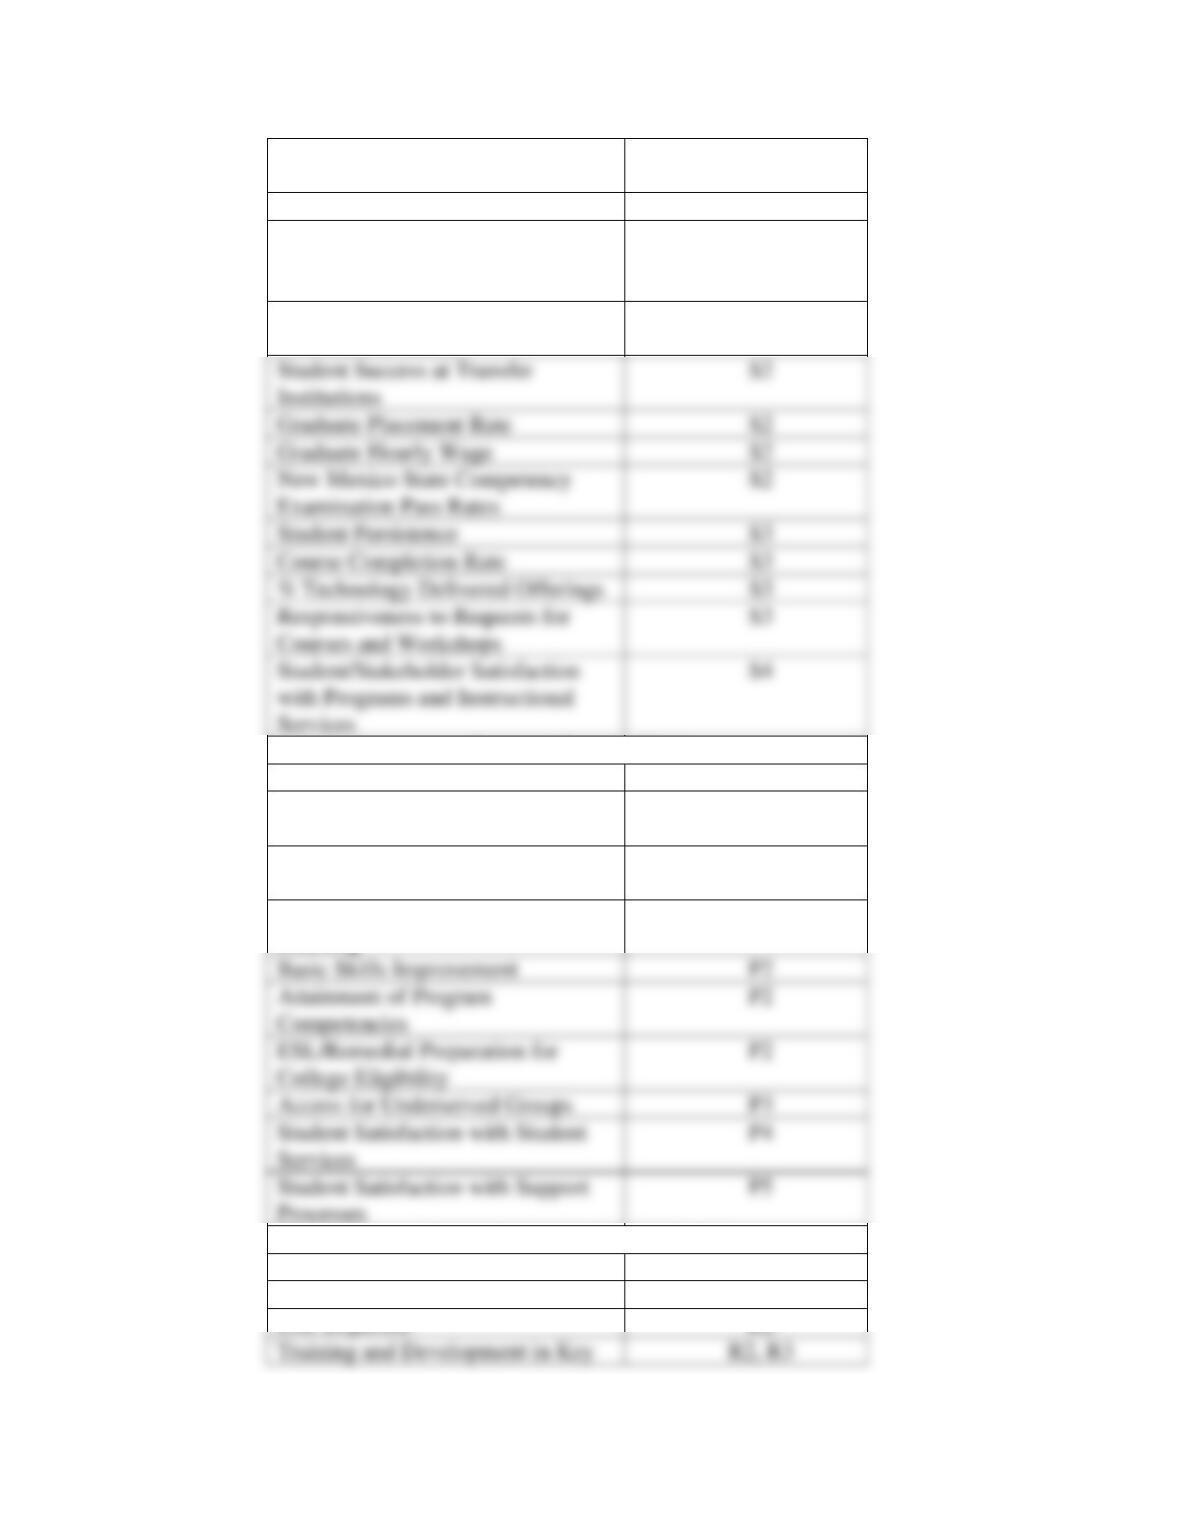
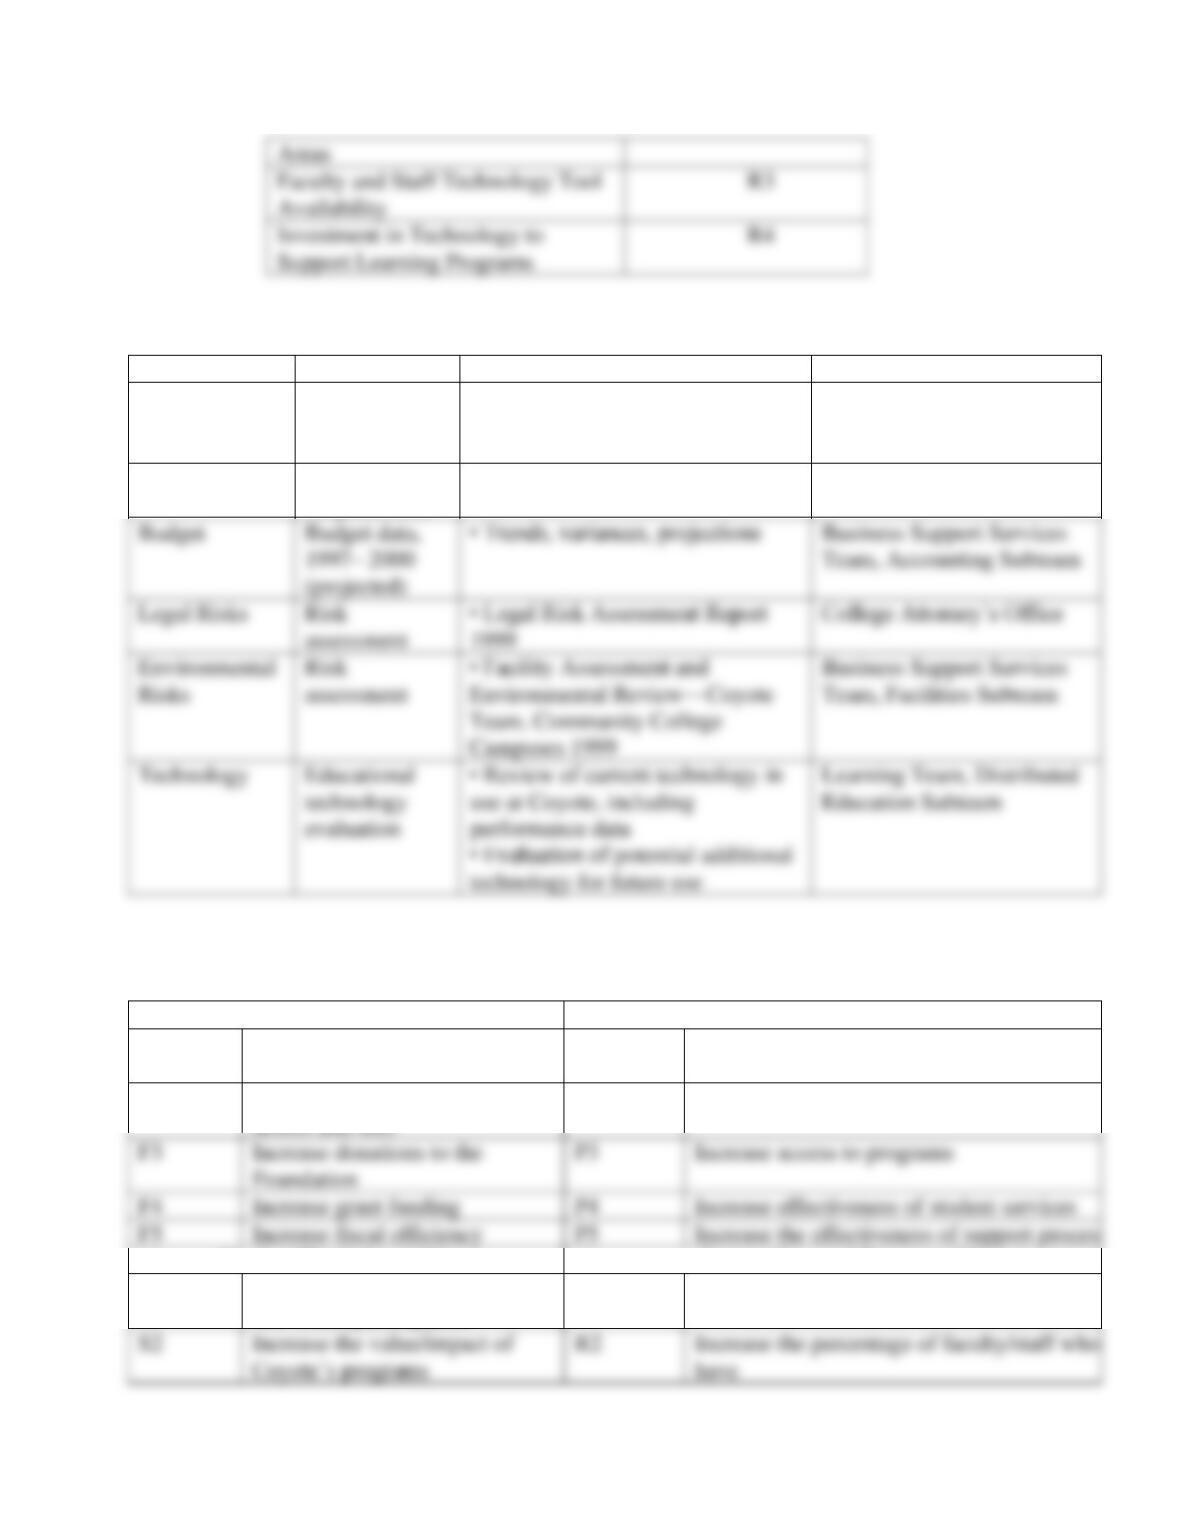
During the 1998/99 planning cycle, the Leadership Team developed its first balanced scorecard,
which they called the LEARNing Board since the outcomes included on it demonstrate how
effectively the college is implementing and deploying the LEARN philosophy. The departments
and areas submit an annual report to the Leadership Team that summarizes its performance,
including relevant LEARNing Board outcomes, during the previous academic year.
Measure
Associated
Outcomes
(see LEARNing
Board
Outcomes below)
Funder/Financial View
State Revenues
F1
Tuition and Fees Revenue
F2
Grant and Foundation Funding
Direct Costs
F5
Enrollment
Performance Measurement and Strategic Information Management 23
% of Citizens Participating in
Programs and Events
S1
Student Goal Attainment
S2
Number of Students Completing
Occupational Degree and
Certificate Programs
S2
Passing Rates on Licensure and
Certification Exams
S2
Internal Process View
High Value Content of Curricula
P1
Cycle Time for Curricula
Development
P1
Implementation of Individualized
Learning
P2
Learner Involvement in Active
Learning
P2
Basic Skills Improvement
P2
Attainment of Program
Competencies
P2
ESL/Remedial Preparation for
College Eligibility
P2
Access for Underserved Groups
P3
Student Satisfaction with Student
Services
P4
Student Satisfaction with Support
Processes
P5
Innovation and Resource View
Faculty/Staff Satisfaction Surveys
R1
Faculty/Staff Retention
R1
ESL Expertise
R2
Student Success at Transfer
Institutions
S2
Graduate Placement Rate
S2
Graduate Hourly Wage
S2
New Mexico State Competency
Examination Pass Rates
S2
Student Persistence
S3
Course Completion Rate
S3
% Technology Delivered Offerings
S3
Responsiveness to Requests for
S3
Student/Stakeholder Satisfaction
with Programs and Instructional
Services
S4
Performance Measurement and Strategic Information Management 24
Internal Stakeholder Input
Area of Focus
Type of Input
Method
Source
Faculty and
Staff
Needs and
requirements,
capabilities
• Faculty/Staff Satisfaction Survey
• Capabilities matrix
• Performance data
Business Support Services
Team, Human Resource
Subteam
Faculty
Needs and
rerquirements
• Structured interview
Collective Bargaining Unit
Budget
Budget data,
(projected)
• Trends, variances, projections
Business Support Services
Team, Accounting Subteam
Legal Risks
Risk
assessment
• Legal Risk Assessment Report
1999
College Attorney’s Office
Risks
assessment
Team, Community College
Campuses 1999
Team, Facilities Subteam
LEARNing Board Outcomes
Funder/Financial View
Internal Process view
F1
Maintain level of state funding
P1
Increase the design and development of high
impact programs
F2
Increase total revenue from
tuition and fees
P2
Increase instructional effectiveness
F3
Increase donations to the
Foundation
P3
Increase access to programs
F4
Increase grant funding
P4
Increase effectiveness of student services
F5
Increase fiscal efficiency
P5
Increase the effectiveness of support process
Student/Participant View
Innovation and Resource View
S1
Increase credit enrollment and
non-credit participation
R1
Increase faculty/staff retention
Faculty and Staff Technology Tool
Availability
Investment in Technology to
Support Learning Programs
Performance Measurement and Strategic Information Management 25
the skills they need to be effective
S3
Increase course offerings
R3
Increase the percentage of faculty/staff who
Arroyo Fresco – Assessing Measurement, Analysis, and Knowledge Management
This case is taken from Baldrige training case studies and designed to help students understand
how to interpret the criteria questions and gain insight into how a Baldrige examiner might
assess an organization. We don’t expect students to be able to do this easily (even first year
examiners have a difficult time and a steep learning curve). However, they should, with some
These are the questions from the Baldrige Excellence Builder:
4.1 Measurement, Analysis, and Improvement of Organizational Performance: How do you
measure, analyze, and then improve organizational performance?
(1) how do you track data and information on daily operations and overall organizational
performance?
(2) how do you select comparative data and information to support fact-based decision
making?
(3) how do you select voice-of-the-customer and market data and information?
(4) how do you ensure that your performance measurement system can respond to rapid or
unexpected organizational or external changes?
(5) how do you review your organization’s performance and capabilities?
(6) how do you project your organization’s future performance?
(7) how do you use findings from performance reviews (addressed in question 5) to develop
priorities for continuous improvement and opportunities for innovation?
4.2 Information and Knowledge Management: How do you manage your information and
your organizational knowledge assets?
(1) how do you verify and ensure the quality of organizational data and information?
(2) how do you ensure the availability of organizational data and information?
Performance Measurement and Strategic Information Management 26
(3) how do you build and manage organizational knowledge?
(4) how do you share best practices in your organization?
(5) how do you use your knowledge and resources to embed learning in the way your
organization operates?
Here are the comments from the case study evaluation team:
Category 4 Measurement, Analysis, and Knowledge Management
4.1 Measurement, Analysis, and Improvement of Organizational Performance
Your score in this Criteria item for the Consensus Review is in the 30–45 percentage range.
(Please refer to Figure 5a, Process Scoring Guidelines.)
STRENGTHS
• a(1) Use of the Performance Measurement System (Figure 4.1-1) to evaluate daily
operations and overall organizational performance helps AF leverage its strategic
advantages and address strategic challenges. The customizable FOCUS scorecard
OPPORTUNITIES FOR IMPROVEMENT
• a(1), c(1) It is not clear how AF systematically tracks progress on achieving action
plans and strategic objectives and closes gaps between actual and projected
performance, or how some measures align with objectives or the vision. For
example, some FOCUS data and action plans (Figure 2.1-2) do not include measures
or milestones, and projections are “+/=” competitors. In addition, some measures
are annual and do not clearly align with objectives (e.g., how immunization rates
and screenings will address major health challenges or how grant funding will be
secured and used). Alignment and measurement of progress against stated
objectives may help AF better allocate resources to close gaps and improve patients’
health.
• c(2) It is not clear how AF deploys improvement priorities to partners and collaborators.
For example, the use of the Innovation Council (P.1b[2]) is not evident, and it is not clear
Performance Measurement and Strategic Information Management 27
• b How AF assesses its performance against that of local competitors is not evident. For
example, it is not clear how the state CHC benchmarking consortium or other
comparative data resources inform AF about local competitors’ performance; nor is
4.2 Information and Knowledge Management
Your score in this Criteria item for the Consensus Review is in the 30–45 percentage range.
(Please refer to Figure 5a, Process Scoring Guidelines.)
STRENGTHS
• b(1,3) Through the Knowledge Management Process (KMP) and associated
approaches, both explicit and tacit, AF transfers knowledge among key stakeholders
and embeds learning in the way it operates. With the KMP (Figure 4.2-3), AF builds
knowledge assets and enhances management by fact and evidence-based decision
making (Figure 4.2-4). Examples of improvements include engagement with a local
university to create the Knowledge and Innovation Center, and increasing reliance
on information technology (IT) systems.
• a Mechanisms to ensure the quality and availability of electronic data and information to
the workforce and customers (Figures 4.2-1 and 4.2-2) address requirements and
expectations for access to care and information. Numerous management approaches are
OPPORTUNITIES FOR IMPROVEMENT
• a(2) It is unclear how AF ensures the availability of data and information to key partners
(such as the dialysis partner) who need access to clinical information, and to the 22% of
Performance Measurement and Strategic Information Management 28
the population without access to computers. This lack of access may limit the provision
of easy and timely access to care in AF’s three-county, highly diverse service area.
• a(1) A mechanism to ensure the accuracy and validity, integrity and reliability, and
currency of nonelectronic data and information is not evident—which may limit
information and knowledge management for patients, other customers, and locations
Arroyo Fresco – Assessing Results
This case is taken from Baldrige training case studies and designed to help students understand
how to interpret the criteria questions and gain insight into how a Baldrige examiner might
assess an organization. We don’t expect students to be able to do this easily (even first year
examiners have a difficult time and a steep learning curve). However, they should, with some
coaching, be able to logically look at the criteria questions in the Baldrige Excellence Builder,
These are the questions from the Baldrige Excellence Builder (note that the case asks students to
assess only one item. Instructors might assign different items to groups of students.):
7.1 Product and Process Results: What are your product performance and process
effectiveness results?
(1) What are your results for your products and your customer service processes?
(2) What are your process effectiveness and efficiency results?
(3) What are your safety and emergency preparedness results?
(4) What are your supply-chain management results?
7.2 Customer-Focused Results: What are your customer-focused performance results?
(1) What are your customer satisfaction and dissatisfaction results?
(2) What are your customer engagement results?
7.3 Workforce-Focused Results: What are your workforce-focused performance results?

Performance Measurement and Strategic Information Management 29
(1) What are your workforce capability and capacity results?
(2) What are your workforce climate results?
(3) What are your workforce engagement results?
(4) What are your workforce and leader development results?
7.4 Leadership and Governance Results: What are your senior leadership and governance
results?
(1) What are your results for senior leaders’ communication and engagement with the
workforce and customers?
(2) What are your results for governance accountability?
(3) What are your legal and regulatory results?
(4) What are your results for ethical behavior?
(5) What are your results for societal responsibilities and support of your key
communities?
(6) What are your results for the achievement of your organizational strategy and action
plans?
7.5 Financial and Market Results: What are your results for financial viability?
(1) What are your financial performance results?
(2) What are your marketplace performance results?
Here are the comments from the case study evaluation team:
Category 7 Results
7.1 Health Care and Process Results
Your score in this Criteria item for the Consensus Review is in the 50–65 percentage range.
(Please refer to Figure 5b, Results Scoring Guidelines.)
STRENGTHS
• a Improving results for health care screenings and vaccinations, with some exceeding the
benchmark, reflect success in these key functions. Examples are screening results for
smoking, depression, and domestic violence (Figures 7.1-3 through 7.1-5), which show
consistent improvement since 2012, as well as diabetes and heart care (Figures 7.1-12
Performance Measurement and Strategic Information Management 30
• c Results for the effectiveness of AF’s supply–chain management show good levels and
beneficial trends. For example, supply order accuracy (Figure 7.1-34) has been close to a
national benchmark since 2012. In addition, cost savings achieved by AF as a member of
OPPORTUNITIES FOR IMPROVEMENT
a Results are not segmented for the Hispanic and Native American populations, which are
identified as important to AF. Tracking results for these populations may help AF deliver
patient-centered, culturally competent care across the different groups served
by AF and contribute to meeting the vision of “making the people of western Arizona the
healthiest in the state.”
• b AF does not report results for health-care-related errors, unsafe events, and near misses
related to health care and customer-focused work processes, such as alerts for critical lab
value; for measures of process effectiveness and efficiency related to payors’
requirements; or for the effectiveness of collaborative initiatives and standardization of
7.2 Customer Results
Your score in this Criteria item for the Consensus Review is in the 50–65% percentage range.
(Please refer to Figure 5b, Results Scoring Guidelines.)
Performance Measurement and Strategic Information Management 31
STRENGTHS
• a(1) Patient and family satisfaction results—such as aggregate patient satisfaction,
satisfaction with medical services, and satisfaction with dental services (Figures 7.2–
1 through 7.2-3)—have equaled or exceeded the top-decile level since 2013. These
results reflect AF’s positive competitive position and support its mission to provide
easy, timely access to high-quality, safe health care services responsive to diverse
cultural and socioeconomic needs, regardless of ability to pay.
• a(1) Good-to-excellent levels and beneficial trends for most results for patient and other
customer satisfaction with services may enable AF to maintain and grow its market share.
Patient and family satisfaction with dental services, school services, mobile van, and
support services (Figures 7.2-3, 7.2-5, and 7.2-7), as well as patient and community
satisfaction related to key requirements (Figures 7.2-6 and 7.2-8), has improved over the
periods shown. Payor satisfaction results (Figure 7.2-10) exceeded those of the state-best
CHC from 2012 to 2016.
OPPORTUNITIES FOR IMPROVEMENT
• a(1) AF does not report comparisons to local or regional competitors for many
patient and other customer satisfaction results (e.g., aggregate patient satisfaction,
satisfaction with medical services, dental services, school services, and support
services and key requirements; Figures 7.2-1 through 7.2-7). Comparing these
results with those of competitors may enable AF to identify areas in which it might
more effectively compete for patients.
• a(2) Results are missing for the success of the patient acquisition and retention
mechanisms presented in Figure 3.2-2. Given the challenges associated with the recent
and anticipated changes in the ACA and Medicaid expansion enabling CHC patients to
obtain care elsewhere, specifically measuring and monitoring such results may help AF
enhance utilization.

Performance Measurement and Strategic Information Management 32
7.3 Workforce Results
Your score in this Criteria item for the Consensus Review is in the 50–65 percentage range.
(Please refer to Figure 5b, Results Scoring Guidelines.)
STRENGTHS
• a(3) Engagement and satisfaction results that outperform the Oates top decile
support AF’s strategic advantage of a highly engaged workforce. Examples are
millennial and nonmillennial staff engagement results (Figure 7.3-13), with both
groups around 95% in 2016; satisfaction with key engagement drivers and the
meeting of key requirements (Figures 7.3-14 and 7.3-15); physician satisfaction
(Figure 7.3-16); and volunteer satisfaction (Figure 7.3-17), with the latter
approaching 100% from 2012 to 2016.
• a(1) Turnover results (Figures 7.3-1 through 7.3-3) demonstrate beneficial trends from
2012 to 2016, with levels for all groups at or better than the state-best CHC levels. These
results demonstrate the success of AF’s approaches to reduce employee turnover.
OPPORTUNITIES FOR IMPROVEMENT
• a(1,2,4) Results are missing for areas related to AF’s strategic challenge of staff
recruitment and retention. For example, results are not provided for recruitment of
health care professions and physicians; for some drivers of workforce engagement,
including comfort with reporting errors or unsafe acts, protection from health and
safety hazards, and a flexible work schedule; and for measures of workforce safety.
In addition, beyond proficiency results and satisfaction with training, results for
training effectiveness are not provided.
• a Most workforce results are not segmented by groups indicated as important to AF.
For example, other than Staff Engagement (Figure 7.3-13), results are not
segmented by millennial and nonmillennial employees, and other than Physician
Satisfaction (Figure 7.3-16), results are not provided for physicians. Without
segmentation of workforce results, such as those for capability and capacity, AF
may be unable to identify areas for improvement.

Performance Measurement and Strategic Information Management 33
• a For workforce results, AF does not provide comparisons to direct competitors, such as
community-based private medical, dental, and behavior health providers. Capturing such
comparisons may help AF identify opportunities to better leverage its strategic
advantages of utilization and strategic partnerships to increase its competitiveness.
7.4 Leadership and Governance Results
Your score in this Criteria item for the Consensus Review is in the 30–45 percentage range.
(Please refer to Figure 5b, Results Scoring Guidelines.)
STRENGTHS
• a(3) Excellent performance on results for legal, regulatory, and licensure requirements
indicate the effectiveness of AF’s approaches to addressing these requirements as they
relate to operations. The best performance possible is reported for HIPAA measures and
licensures since 2012 (Figures 7.4-3 through 7.4-5) and for Percent Staff and Volunteers
Trained in Proper Disposal of Medical Waste (Figure 7.4-6).
OPPORTUNITIES FOR IMPROVEMENT
• a(1,2,5) Results are missing for several identified leadership and governance
approaches. Examples are results for the effectiveness of approaches to ensure
responsible governance (Figure 1.2-1) and for senior leaders’ communication with
customers, board members, volunteers, strategic partners, payors, and the
community. In addition, there are no results for 9 of 14 community support
programs (Figure 1.2-5), the extent of workforce participation in them, or their
impact on community health. Without such results, AF may be limited in
demonstrating its commitment to accountability or the success of its community
support efforts.
• b Results are missing for outcomes of action plans in alignment with strategic objectives
(Figure 2.1-2), such as efforts to secure funding from public and private grants and major
gifts, building and strengthening core competencies, and managing risk and taking
intelligent risks. Tracking such results may help AF demonstrate accountability in a
highly regulated environment.
Performance Measurement and Strategic Information Management 34
7.5 Financial and Market Results
Your score in this Criteria item for the Consensus Review is in the 30–45 percentage range.
(Please refer to Figure 5b, Results Scoring Guidelines.)
STRENGTHS
• a(1) In support of its mission to provide health care services to its tricounty community,
AF’s financial results show beneficial trends for actual expenses, revenues, and net
collections from 2012 to 2016 (Figure 7.5-1). Total revenues consistently meet the level
of the state-best CHC. In addition, expenses and collections (51% of total revenue)
OPPORTUNITIES FOR IMPROVEMENT
• a Results are missing or limited for operating margin, fundraising revenues, cost
control, and ACA impact. Such financial and market performance measures may
help leaders address changes in the financial environment, including the strategic
challenge of balancing the mission to serve all patients regardless of ability to pay
against a tight fiscal environment.
• a(2) Results for market share by service (Figure 7.5-6) show low market share for
dental services (15%) and chronic disease (10%) from 2012 to 2016. Such results
may indicate a missed opportunity to establish and manage mechanisms to provide
specialty care and meet service needs in the tricounty area.
• a Results are missing for measures and indicators of the effectiveness of AF’s key
partnerships. For example, no results are provided to show the financial and marketplace
performance of a strategic partnership with a local dialysis provider. The lack of such

Performance Measurement and Strategic Information Management 35