Page 1 of 15
Chapter 12: Statistically Based Quality
Improvement for Attributes
Chapter Outline
• Generic Processes for Developing Structure Charts
• Understanding Attributes Charts
• Choosing the Right Attributes Chart
• Reliability Models
Overview
An attribute is a physical property; it is something that either exists or does not
exist. There are five attribute types in the continuous quality improvement process. This
chapter provides tools for dealing with these attributes.
Table 12-1 on page 315 presents a list of the types of attributes:
Page 2 of 15
Discussion Questions
1. What are key attributes for a high-quality university?
The key to this question is the phrase “high–quality.” The question might be taken to
mean: What are the attributes that differentiate between a university and a high-quality
university. The list might include:
• Quality teachers
2. What are some attributes that you can identify for an automobile tire?
As the chapter brings out, the key attributes depend on the customer. For instance, a
3. What are some attributes for a university financial aid process?
Chapter 11 addressed constructing control charts. The generic process for developing
control charts is revisited here:
2. Identify critical product characteristics.
4. Select the appropriate process chart.
6. Update the limits when changes have been made to the process.
4. What are some personal attributes that you could monitor using control charts?
Which control chart would you use?
One begins by asking: “What do you want to accomplish by monitoring personal
attributes?” Make a list to help identify the personal attributes to be monitored. Once this
is done, a methodology for tracking and charting the use of these attributes can be
5. What are examples of structural attributes?
On page 315, structural attributes are defined:
Structural attributes have to do with physical characteristics of a particular product or
6. What are some examples of sensory attributes?
On page 315, sensory attributes are defined:
Sensory attributes relate to senses of touch, smell, taste, and sound. For products, these
attributes relate to form design or packaging design to create products that are pleasing
to customers. In services such as restaurants and hotels, atmosphere is very important to
the customer experience.
7. What are some examples of performance attributes?
On page 316, we find the definition for performance attributes:
Page 4 of 15
Performance attributes relate to whether or not a particular product or service performs
as it is supposed to. For example, does the lawn mower engine start? Does the stereo
system meet a certain threshold for low distortion?
Performance attributes are heavily based upon requirements. For instance, what is the
8. What are some examples of temporal attributes?
Page 316 defines temporal attributes:
Temporal attributes relate to time. Were delivery schedules met? This often has to do
with the reliability of delivery.
9. What are some examples of ethical attributes?
Ethical attributes are discussed on page 316:
Ethical attributes are important to firms. Do they report properly? Is their accounting
transparent? Is the service provider empathetic? Is the teacher kind or not?
Some years ago, a prominent car salesman in Denver was indicted and convicted for
10. What ethical attributes might you use to determine where you should go to work
after graduation?
Where do you work? What do you do? A person will field these questions regularly. For
many of us, what we do is who we are. This is a personal question that relates directly to
an individual’s self-image.
Case 12-1: Decision Sciences Institute National Conference
Take the raw data provided and develop research questions. Next, using the
statistical tools from this chapter, analyze the data. Finally, put the data into a form
that will be useful for decision makers.
A lot of data is presented. Some ideas come immediately. Comparisons of these items are
easily extracted from an excel spreadsheet. Specifically, one can compute the percentage
of submitted against the percentage of each of the various levels. The data is all attribute
data. A variety of hypothesis can be constructed. For instance, a simplistic example might
be:
Page 7 of 15
Perhaps a pie chart or two might also be constructed. All of the charts and graphs that are
shown in the chapter can be presented. Again, the question is asked: What is the purpose
of the analysis?
12
14
16
18
Sample of reviewer results
reviewer
reviewer 1 results
reviewer 2 results
Page 8 of 15
Suggested Answers to End of Chapter Problems
1.
2.
3.
4.
Suppose you want to inspect a lot of 10,000 products to see whether or not they meet
requirements. Design a sampling plan used to test these products.
Answers will vary, but students should start with the six steps in the generic process for
Suppose a product is made of 100 components, each with a 97% reliability. What is
the overall reliability for the product?
Suppose a product is made of 1,000 components, each with .999 reliability. What is
the unreliability of this product? Is this acceptable? Why or why not?
A product consists of 45 components. Each component has an average reliability of
.97. What is the overall reliability for this product?
5.
A radio is made up of 125 components. What would have to be the average reliability
for each component for the radio to have a reliability of 98% over its useful life?
6.
High reliability:
List five products with low reliability. List five that have high reliability. What are the
elemental design differences between these products? In other words, what are the
factors that make some products reliable and others unreliable?
Following are some examples of products with low reliability and high reliability.
Low reliability:
Page 9 of 15
7.
8.
An assembly consists of 240 components. Your customer has stated that your overall
reliability must be at least 99%. What needs to be the average reliability factor for
each component?
A product is made up of six components. They are wired in series with reliabilities of
.95, .98, .94, .96, .98, and .97. What is the overall reliability for this product?
9.
10.
11.
Suppose that redundant components are introduced for the two components in
Problem 8 with the lowest reliability. What is now the overall reliability for the
product?
Suppose that redundant components are introduced for all of the components in
Problem 8. What is now the overall reliability for the product?
A product is made up of components A, B, C, and D. These components are wired in
series. Their reliability factors are .98, .999, .97, and .989 respectively. Compute the
overall reliability for this product.
12.
A product is made up of components A, B, C, D, E, F, G, H, I, and J. Components A,
B, C, and F have a 1/10,000 chance of failure during useful life. D, E, G, and H have a
3/10,000 chance of failure. Component I and J and a 5/10,000 chance of failure. What
is the overall reliability of the product?
13.
For the product in Problem 12, if parallel components are provided for components I
and J, what is the overall reliability for the product?
Page 10 of 15
14.
A product is made up of 20 components in a series. Ten of the components have a
1/10,000 chance of failure. Five have a 3/10,000 chance for failure. Four have a
4/10,000 chance for failure. One component has a 1/100 chance for failure. What is the
overall reliability of the product?
15.
For the product in Problem 14, if parallel components are used for any component
with worse than a 1/1,000 chance for failure, what is the overall reliability? How many
components will the new design have? What will be the average component reliability
for the redesigned product?
16.
17.
An inspector visually inspects 200 sheets of paper for aesthetics. Using trained
judgment, the inspector will either accept or reject sheets based on whether they are
flawless. Following are the results of recent inspections:
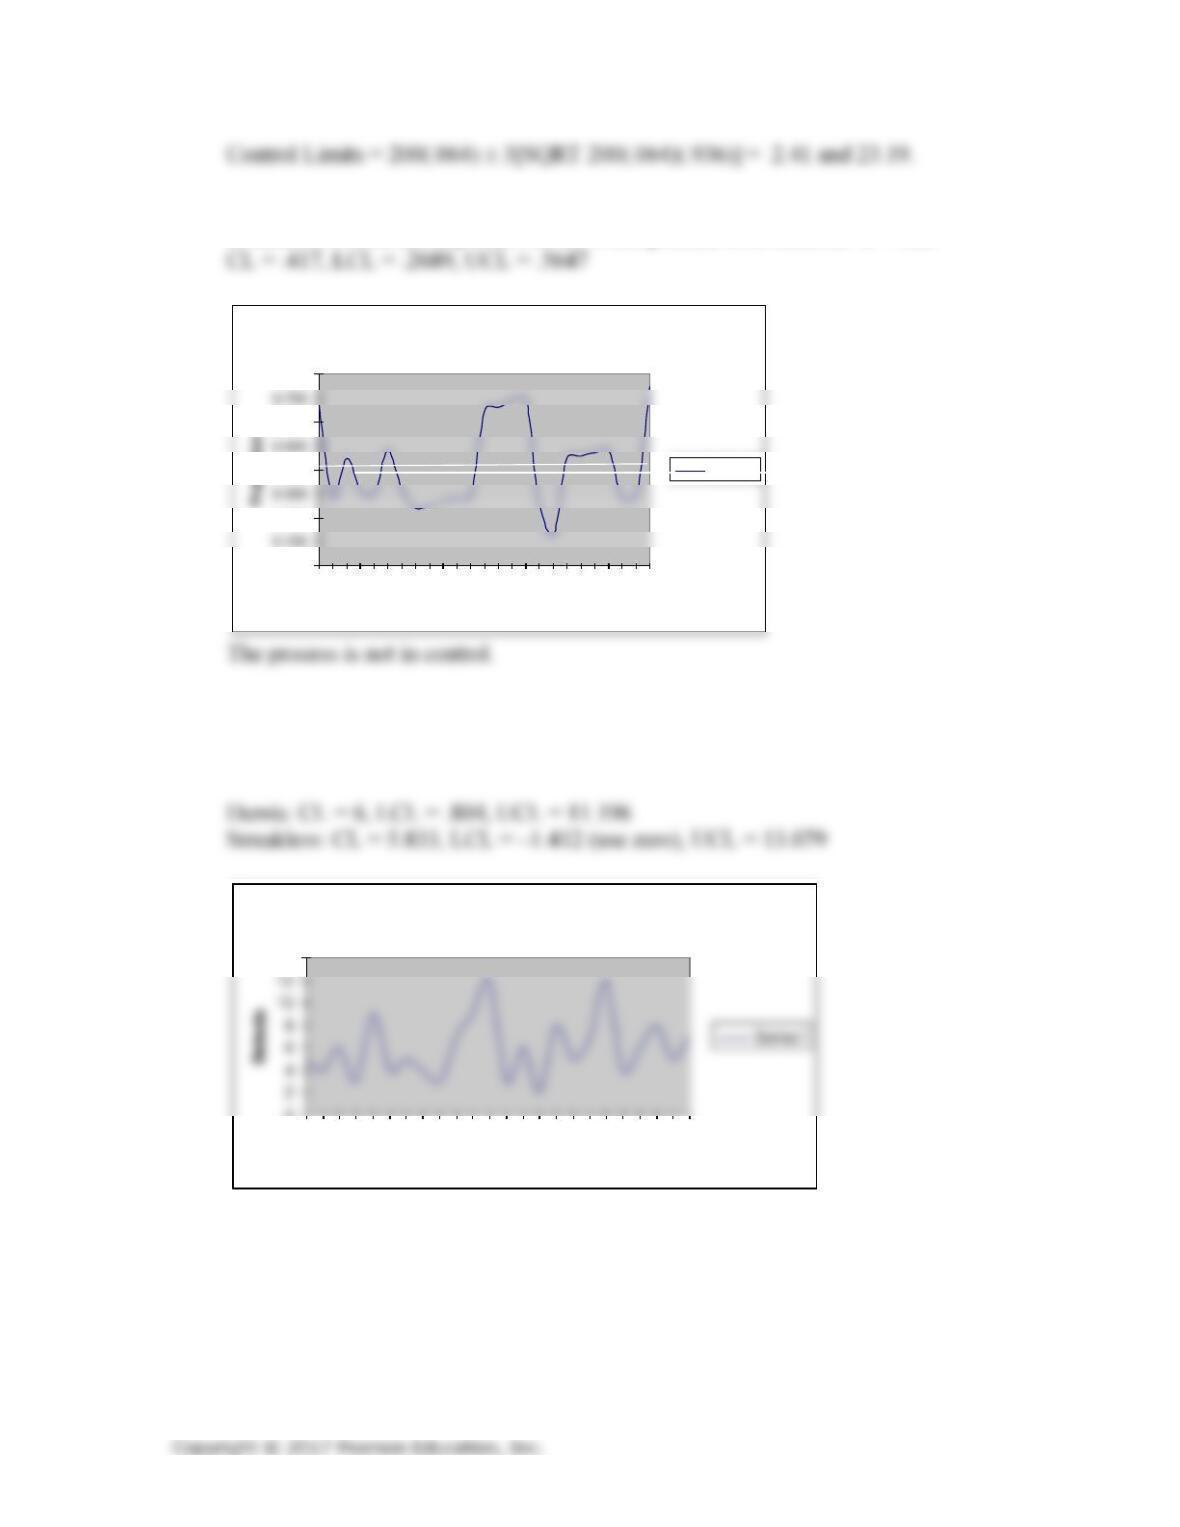
a. Given these results, using a p chart, determine if the process is stable.
CL = .064 LCL = .0118 UCL = .1152
The process is out of control at sample 5.
b. What would need to be done to improve the process?
Using the data in Problem 16, compute the limits for an np chart.
p chart
1 2 3 4 5 6 7 8 9
sample
Page 11 of 15
18.
19.
Suppose a company makes the following product with the following (see text) number
of defects. Construct a p chart to see if the process is in control. n = 100
Using the data from Example 12.3, evaluate the Demis using a u chart and evaluate the
Streakless using a c chart. Assume that the Demis are twice the size as the Streakless
on average.
p chart
0.000
0.200
0.400
0.600
0.800
1 2 3 4 5 6 7 8 9 10111213141516171819202122232425
Sample
Series1
Demis u chart
0
14
1 2 3 4 5 6 7 8 9 1011 12 13 1415 16 17 1819 20 21 2223 24
Item
Page 12 of 15
20.
21.
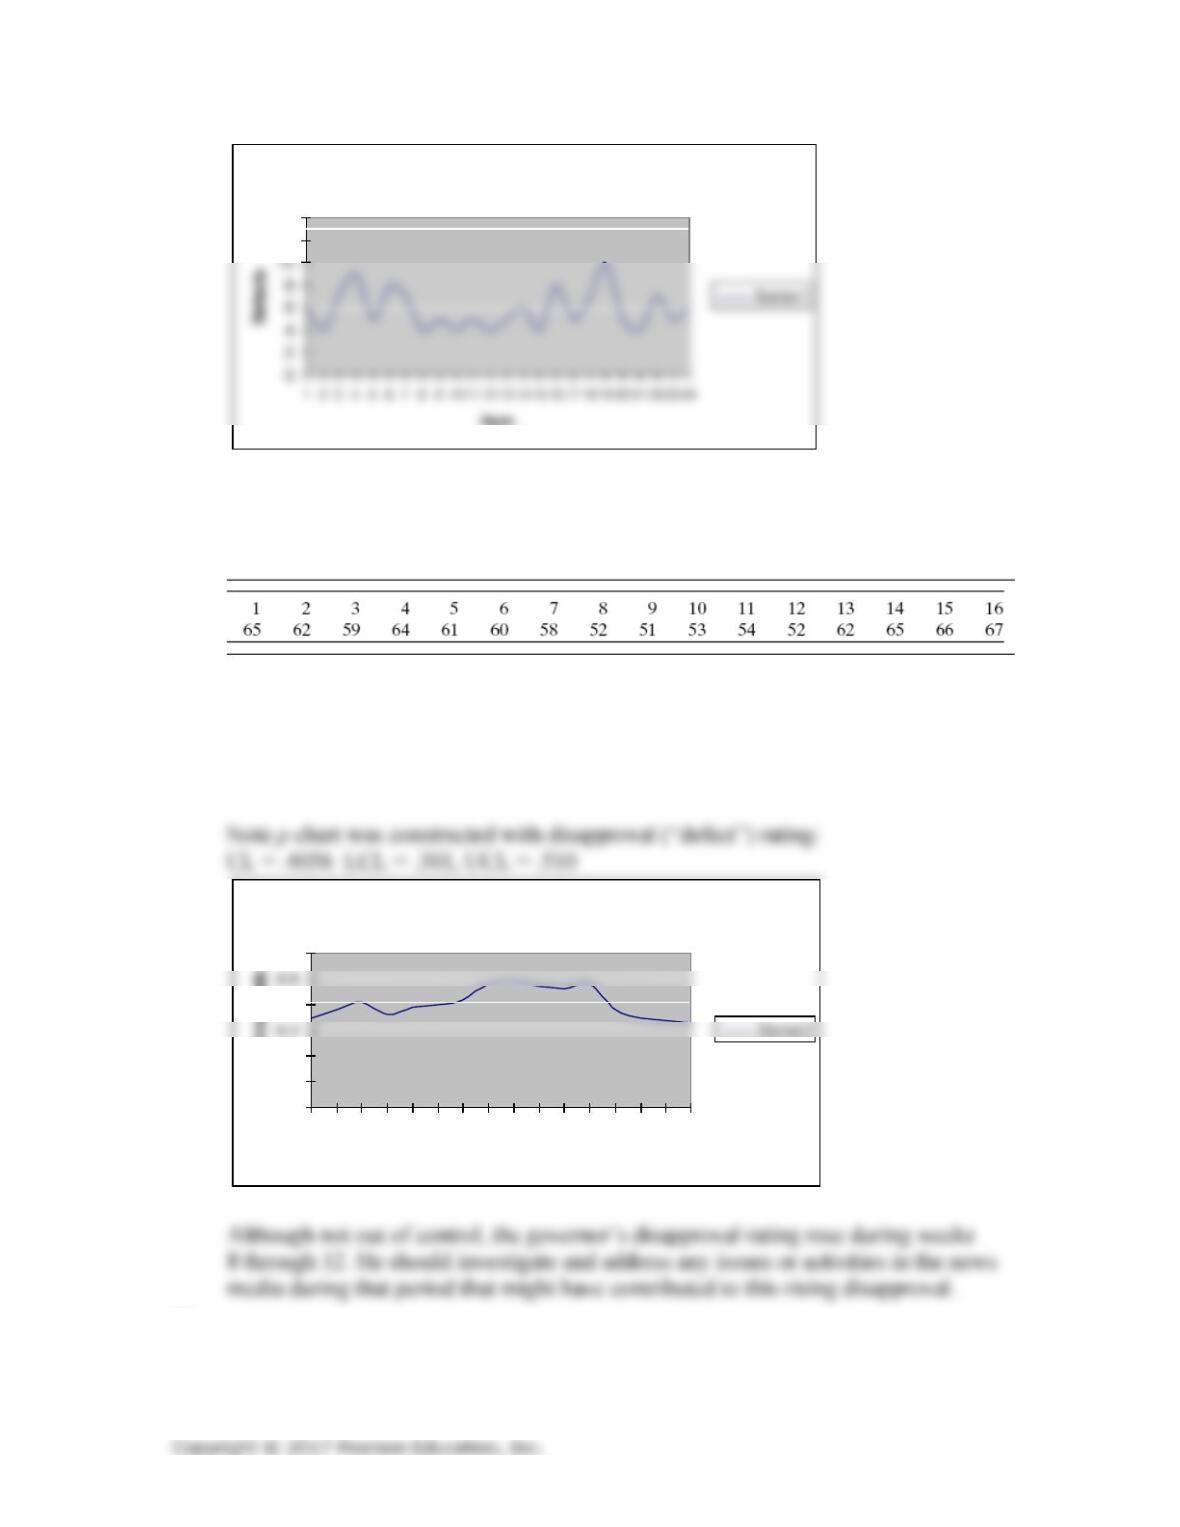
The Demis are out of control, the Streakless are not.
Politicians closely monitor their popularity based on approval ratings. For the
previous 16 weeks, Governor Johnny’s approval ratings have been (in percentages):
a. Prepare a report for the governor outlining the results of your analysis. Use
control charts to analyze the data (n = 200).
b. What action would you propose to the governor based on your analysis.
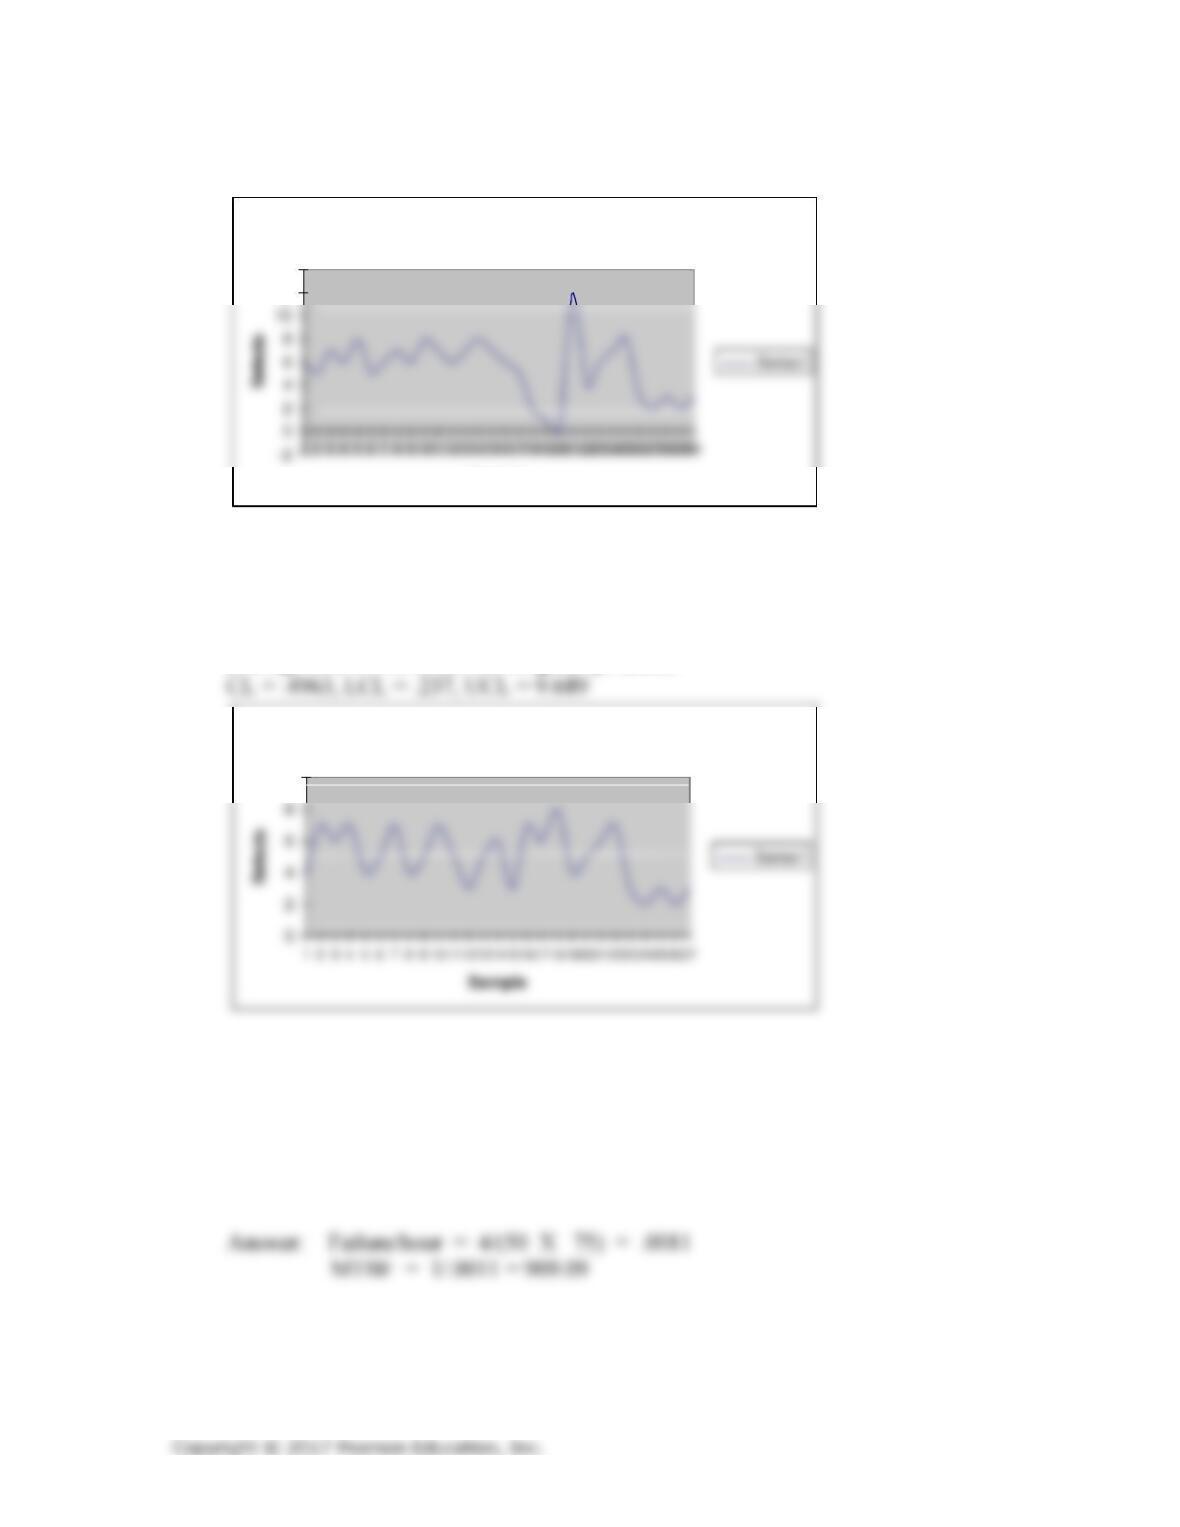
If the p chart is constructed on the approval rating percentages, Governor Johnny’s approval
would be decreasing during weeks 8 through 12.
Streakless c chart
12
14
Item
p chart
0
0.1
0.2
0.4
0.6
1 2 3 4 5 6 7 8 9 10 11 12 13 14 15 16
Week
Disapproval rate
Page 13 of 15
22.
23.
Construct and interpret a c chart using the following (see text) data:
CL = 5.433, LCL = –1.56 (use zero), UCL = 12.426
The process is in control, but Sample 20 with no defects should be investigated for
improved methods and Sample 21 should be investigated for poor of sloppy methods.
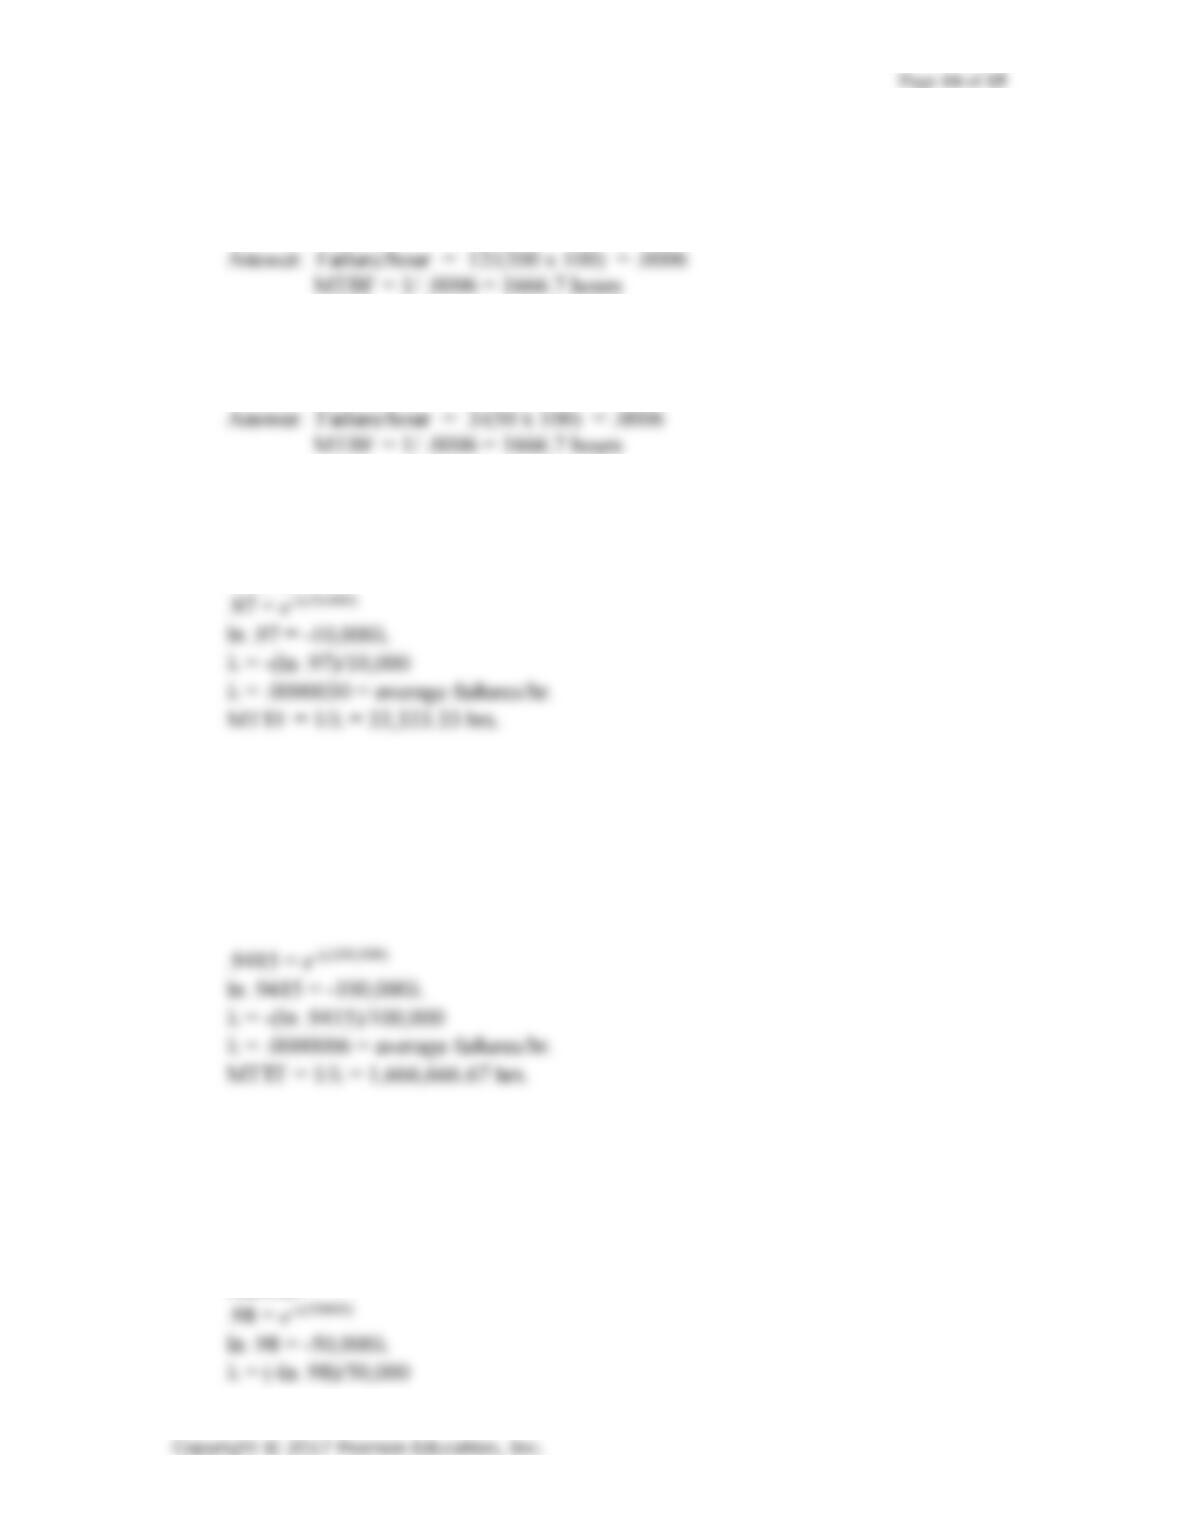
Construct and interpret a u chart using the following (see text) data. Note that the
average size is two times the original product.
The process is in control, but the last samples indicate a decrease in the defects. Investigate
and incorporate into the process.
Dellana Company tested 50 products for 75 hours each. In this time, they experienced
4 breakdowns. Compute the number of failures per hour. What is the mean time
between failures?
c chart
12
14
Sample
u chart
10
24.
25.
The Collier Company tested 200 products for 100 hours each. In this time, they
experienced 12 breakdowns. Compute the number of failures per hour. What is the
mean time between failures?
Crager company tested 100 products for 50 hours each. During the test, 3
breakdowns occurred. Compute the number of failures per hour and MTBF.
26.
27.
28.
Suppose a product is designed to function for 10,000 hours with a 3% chance of
failure. Find the average number of failures per hour and the MTTF.
Answer:
Suppose a product is designed to function for 100,000 hours with a 1% chance of
failure. Suppose that there are six of these in use at a facility. Find the average
number of failures per hour and the MTTF.
Answer:
First, determine overall reliability: .996 = .9415, then use R to determine MTTF.
Suppose that there are 42 pumps used in a refinery. These pumps are continuously
being used with a 2% chance of failure over 50,000 hours. If repair time is 10 hours to
install a new rebuilt pump, how many pumps should be kept on hand to keep the
chance of a plant shutdown to less than 1%. (Hint: Treat this problem as a traditional
safety stock problem and use a z table.)
Answer:
Page 15 of 15
29.
MTTF = 1/ = 49,998.3 hrs.
Suppose that a product is designed to work for 1000 hours with a 2% chance of
failure. Find the average number of failures per hour and the MTTF.
Answer:
30.
A product has been used for 5000 hours with 1 failure. Find the mean time between
failures (MTBF) and λ.
31.
32.
3 120 6 120/(120 + 6) = .943
Answer: Recommend Supplier 2.
You are to decide between 3 potential suppliers for an assembly for a product you are
designing. After performing life testing on several assemblies, you find the following.
Supplier MTBF (hrs) MTTR (hrs) Calculated SA
A 45 2 45/(45 + 2) = .957
B 100 6 100/(100 + 6) = .943
C 150 9 150/(150 + 9) = .943
You are to choose a supplier of a copier based on reliability and service. After
gathering data about the alternatives, here is what you found. What do you
recommend?
Supplier MTBF (hrs) MTTR (hrs) Calculated SA
1 45 2 45/(45 + 2) = .957