CHAPTER 11 REVIEW 11-81
13. 5
() 4
x
fx
x
Domain: All real numbers except x = 4.
14. () ln( 2)fx x
15. 2
3
() 4
x
fx x
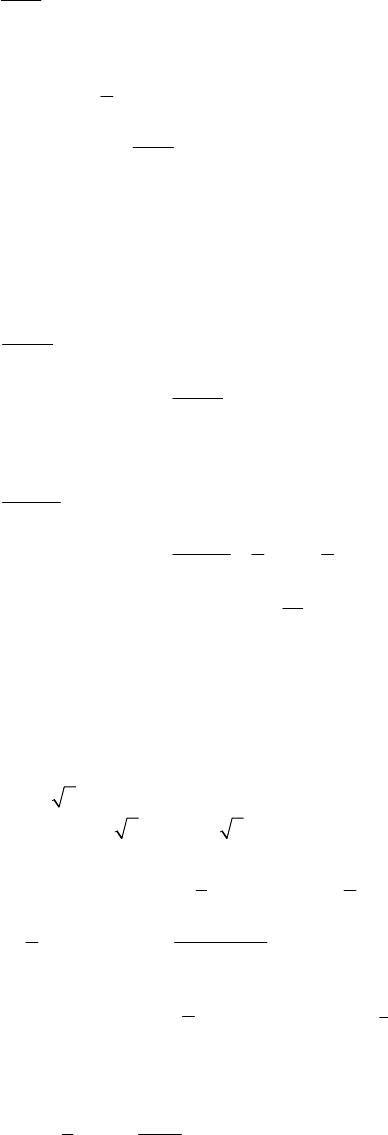
3
xy
16. 27
() 310
x
fx
17. 42 3 2
() 12 , ‘() 4 24, ‘‘() 12 24fx x x f x x x f x x
”( ) 0
fx
18. 1/3 2/3 2/3
12
( ) (2 1) 6, ‘( ) (2 1) (2) (2 1)
33
fx x f x x x
19. 1/5
()
f
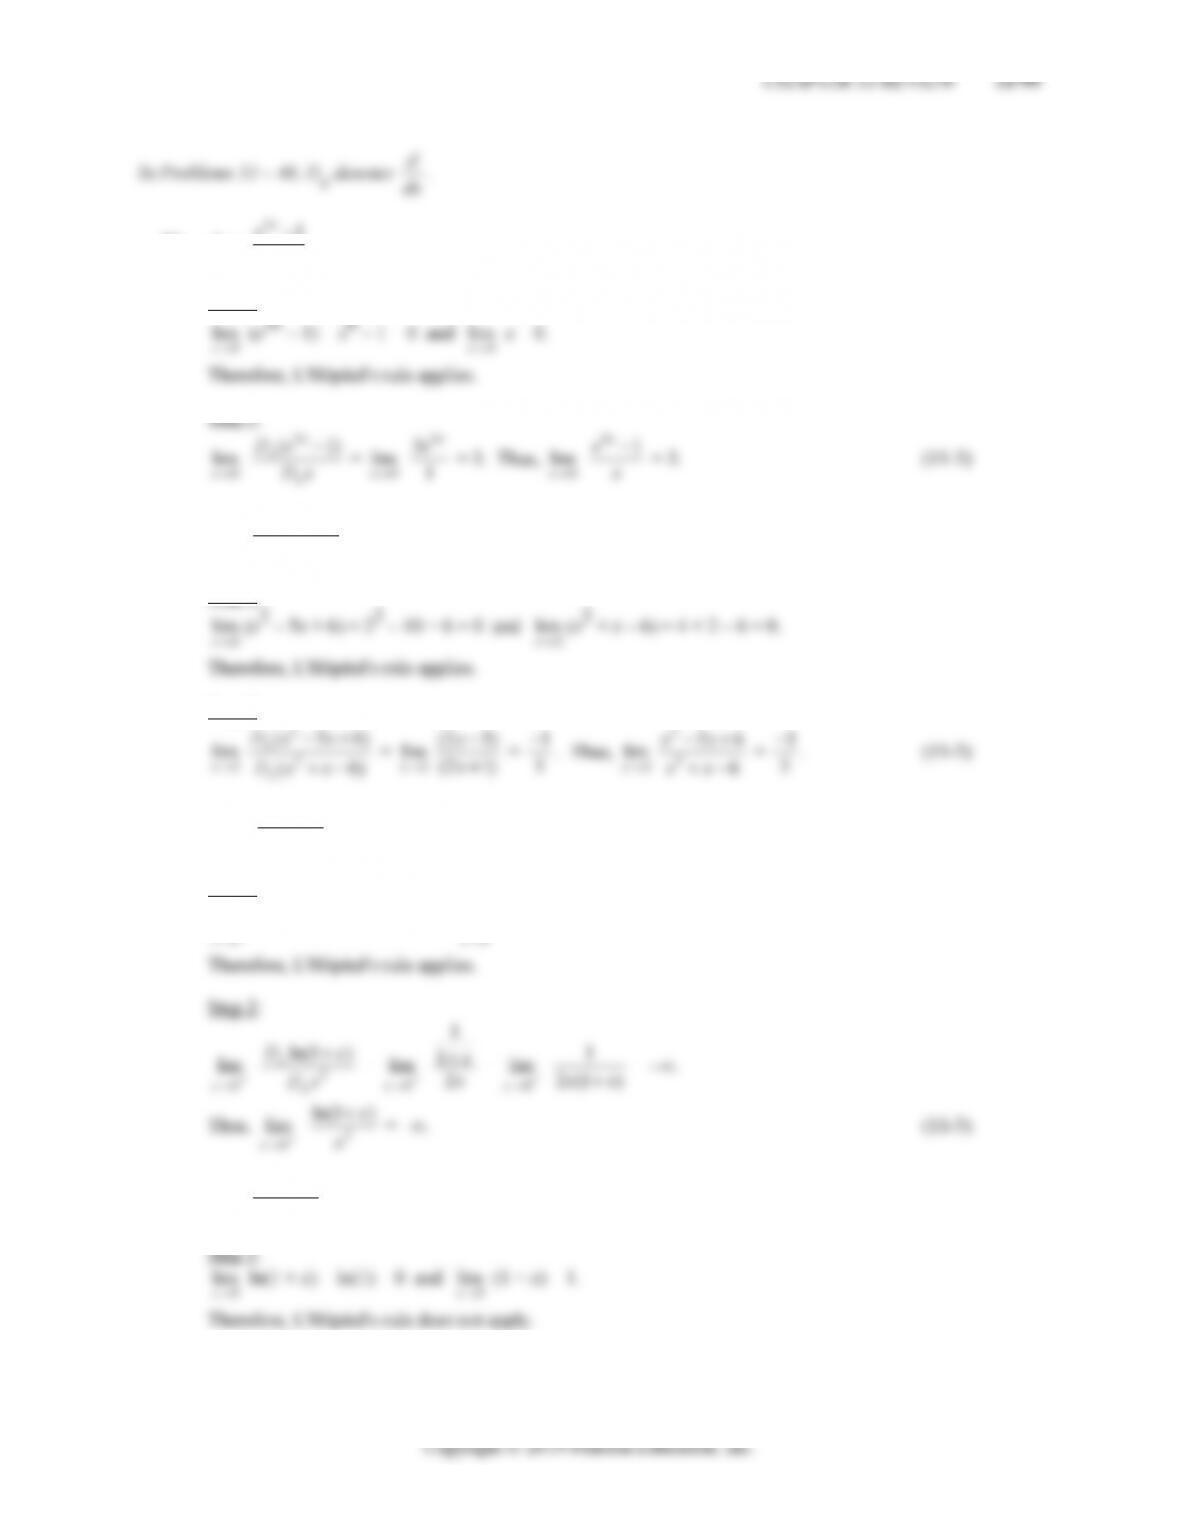
xx
11
20. 1/5
()
f
xx
21. f(x) = x3 – 18x2 + 81x
Step 1:
Step 2:
Analyze f ‘ (x):
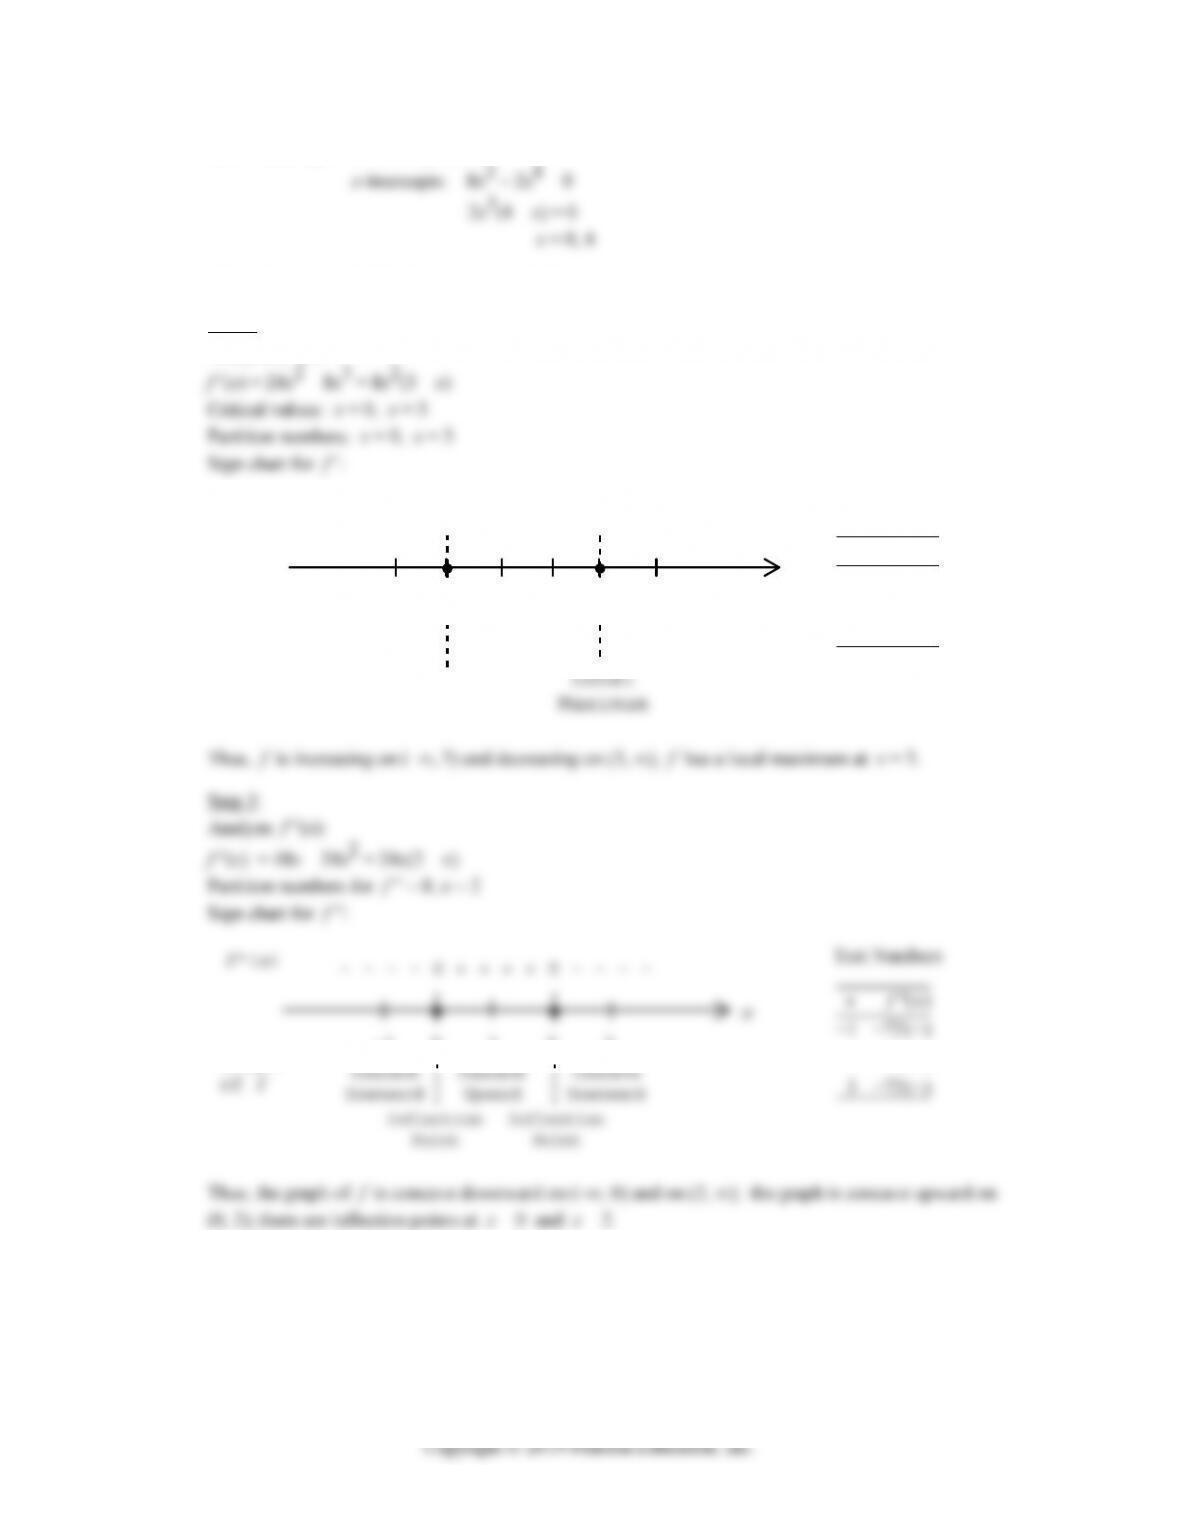
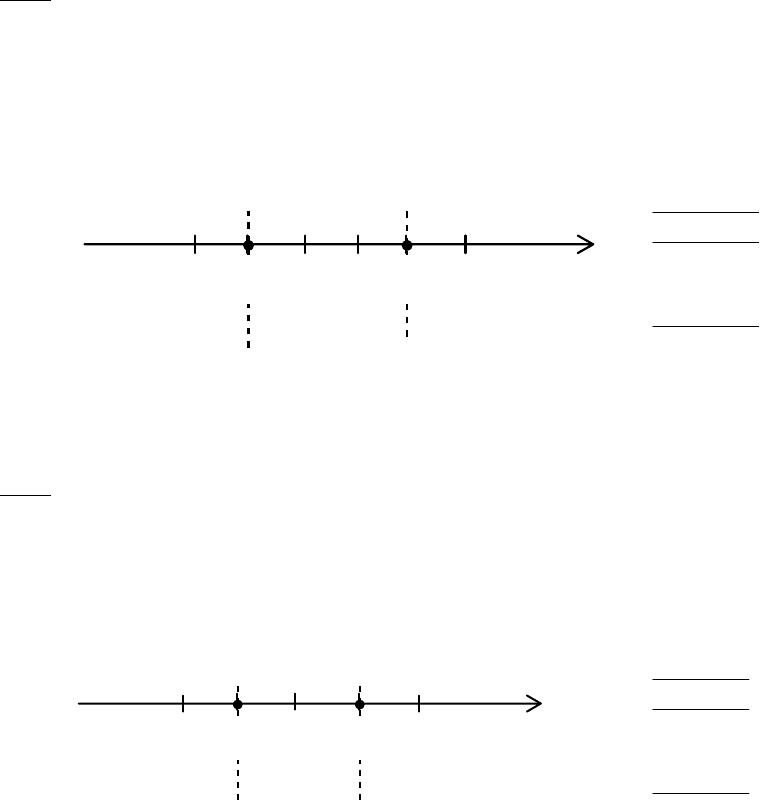
f ‘ (x) = 3x2 – 36x + 81 = 3(x2 – 12x + 27) = 3(x – 3)(x – 9)
Local
Maximum
Local
Minimum
524()
10 21( )
x
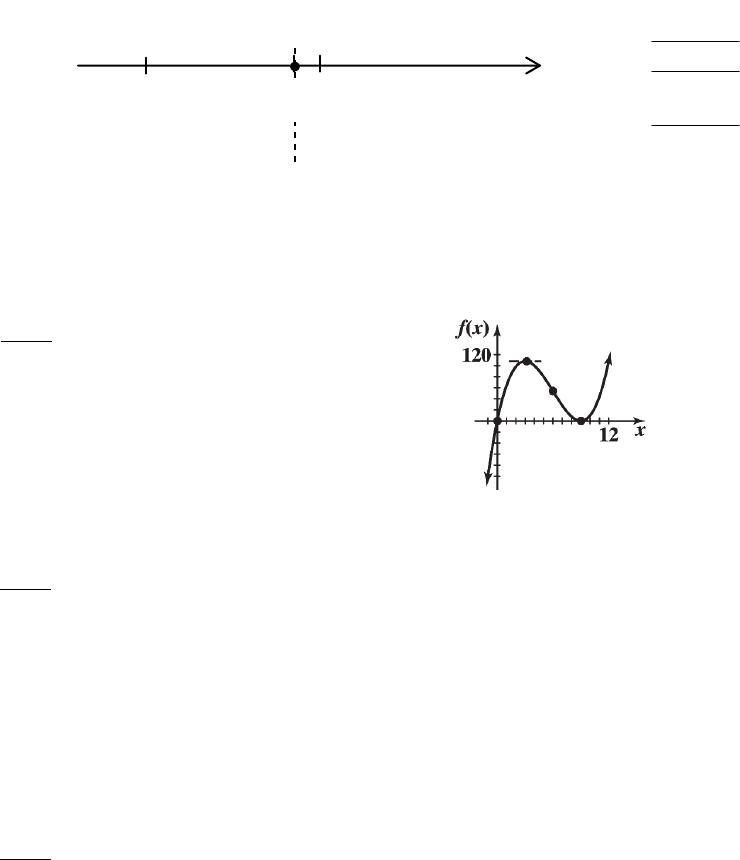
Graph
6 7
– – – – – – 0 + + + + + +
0
“( )
036()
76()
x
fx
22. f(x) = (x + 4)(x – 2)2
Step 1:
Analyze f(x):
(A) Domain: All real numbers, (–∞, ∞).
(B) Intercepts: y-intercept: f(0) = 4(–2)2 = 16
(C)Asymptotes: Since f is a polynomial, there are no horizontal or vertical asymptotes.
Step 2:
Analyze f ‘ (x):
11-84 CHAPTER 11: GRAPHING AND OPTIMIZATION
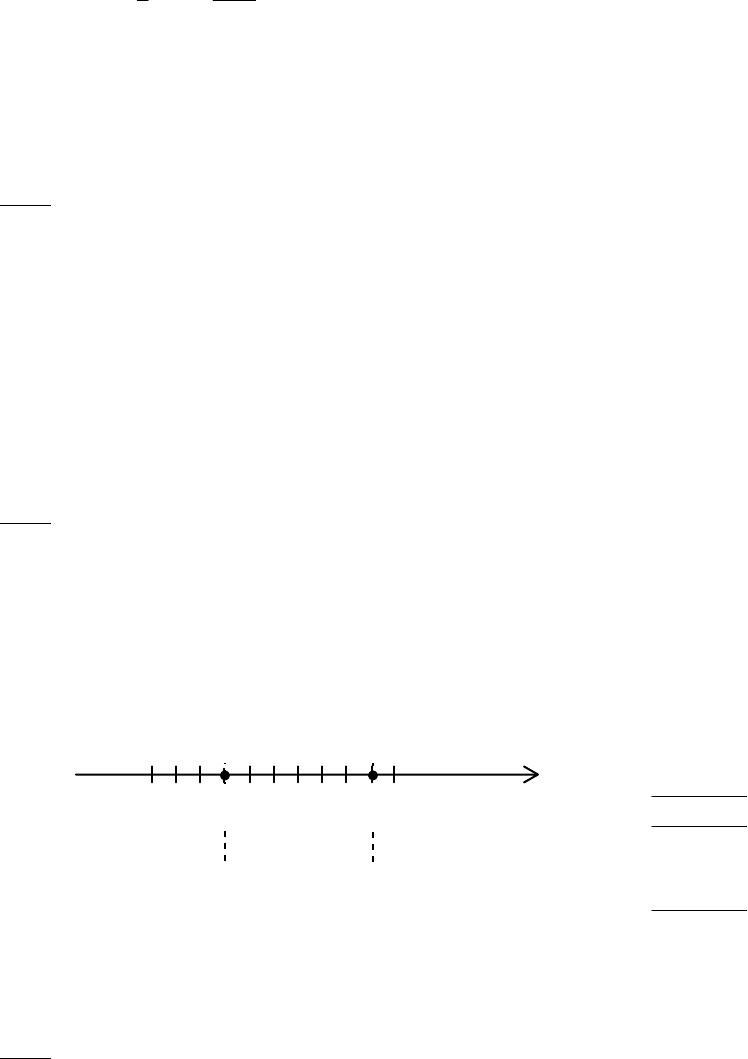
Sign chart for f ‘ :
f(x)Decreasing Increasing
-3 -2 0 2 3
Increasing
Local
Maximum
Local
Minimum
012()
315()
x
Step 3:
Analyze f ‘ ‘ (x) :
f ‘ ‘ (x) = 3(x + 2)(1) + 3(x – 2)(1) = 6x
Partition number for f ‘ ‘ : x = 0
Sign chart for f ‘ ‘ :
x
f“(x)
Graph
Concave
-1 0 1
– – – – 0 + + + +
Test Numbers
“( )
16()
16()
x
fx
x
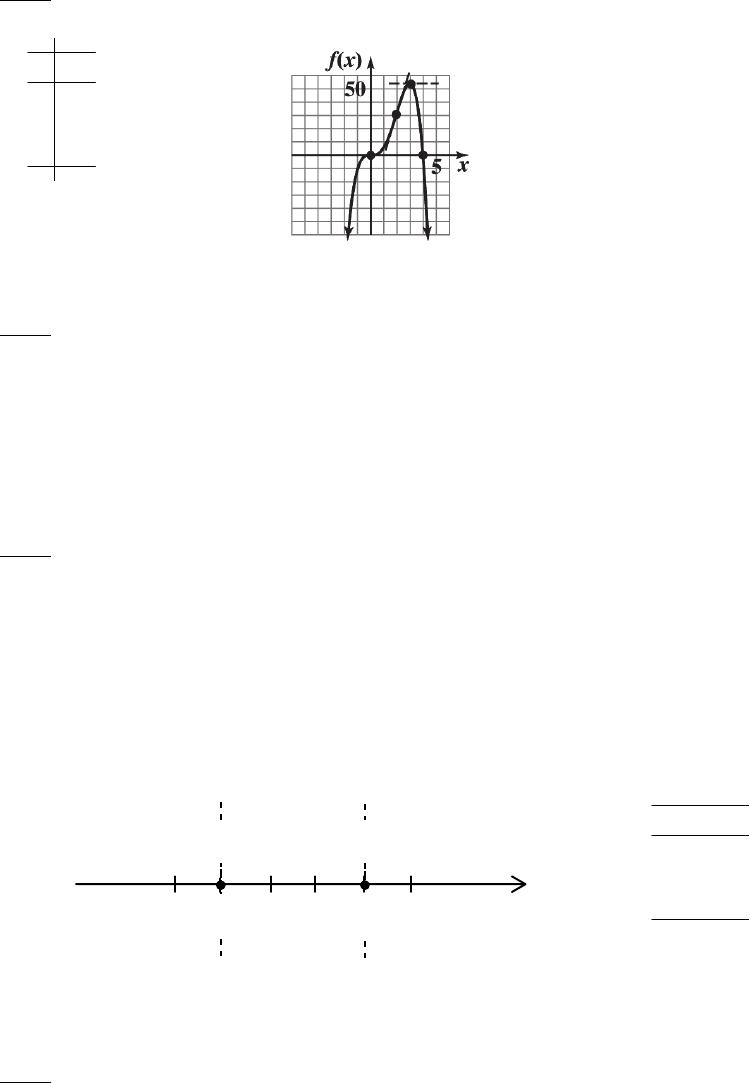
23. f(x) = 8x3 – 2x4
Step 1:
Analyze f(x):
CHAPTER 11 REVIEW 11-85
(B) Intercepts: y-intercept: f(0) = 0
(C)Asymptotes: No horizontal or vertical asymptotes.
Step 2:
Analyze f ‘ (x):
x
f‘(x)
f(x)Increasing Decreasing
+ + + + 0 + + + + + 0 – – – –
-1 0 1 3 4
Increasing
Test Numbers
‘( )
132()
116()
4 128( )
x
fx
Graph
-1 0 1 2 3
124()
x
11-86 CHAPTER 11: GRAPHING AND OPTIMIZATION
Step 4:
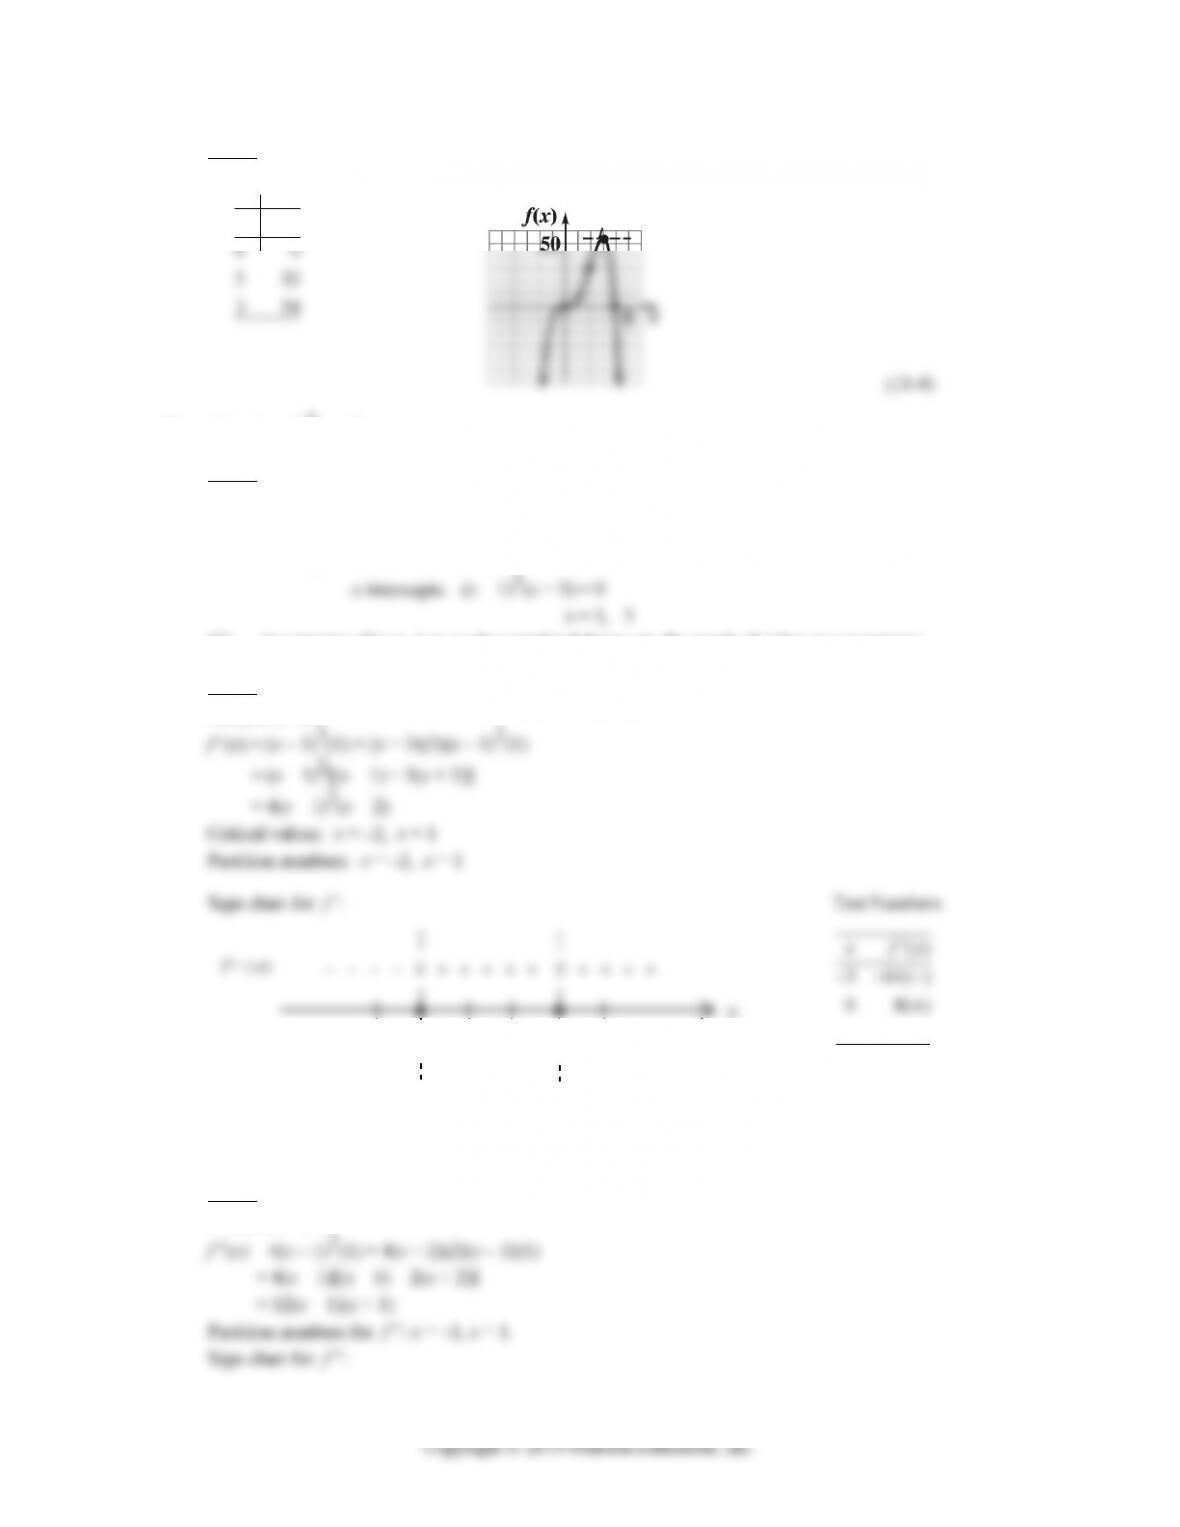
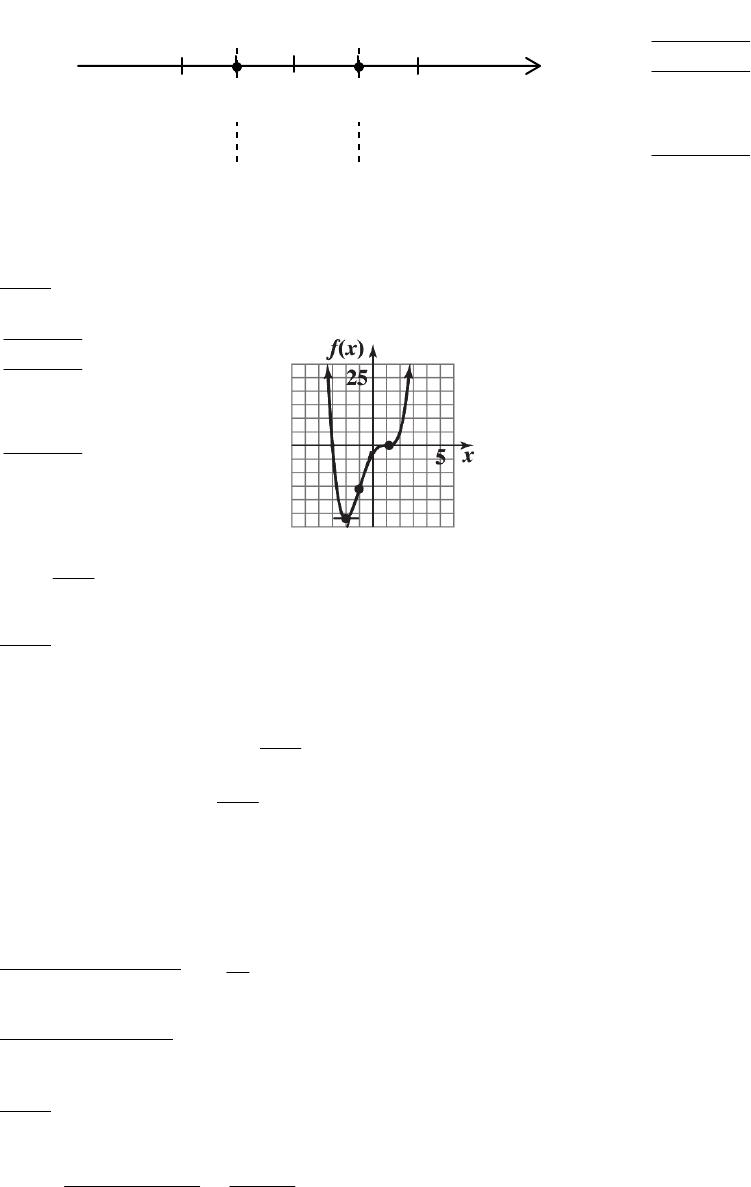
Sketch the graph of f:
()
x
fx
24. f(x) = (x – 1)3(x + 3)
Step 1:
Analyze f(x):
(A) Domain: All real numbers.
(B) Intercepts: y-intercept: f(0) = (–1)3(3) = –3
(C)Asymptotes: Since f is a polynomial (of degree 4), the graph of f has no asymptotes.
Step 2:
Analyze f ‘ (x):
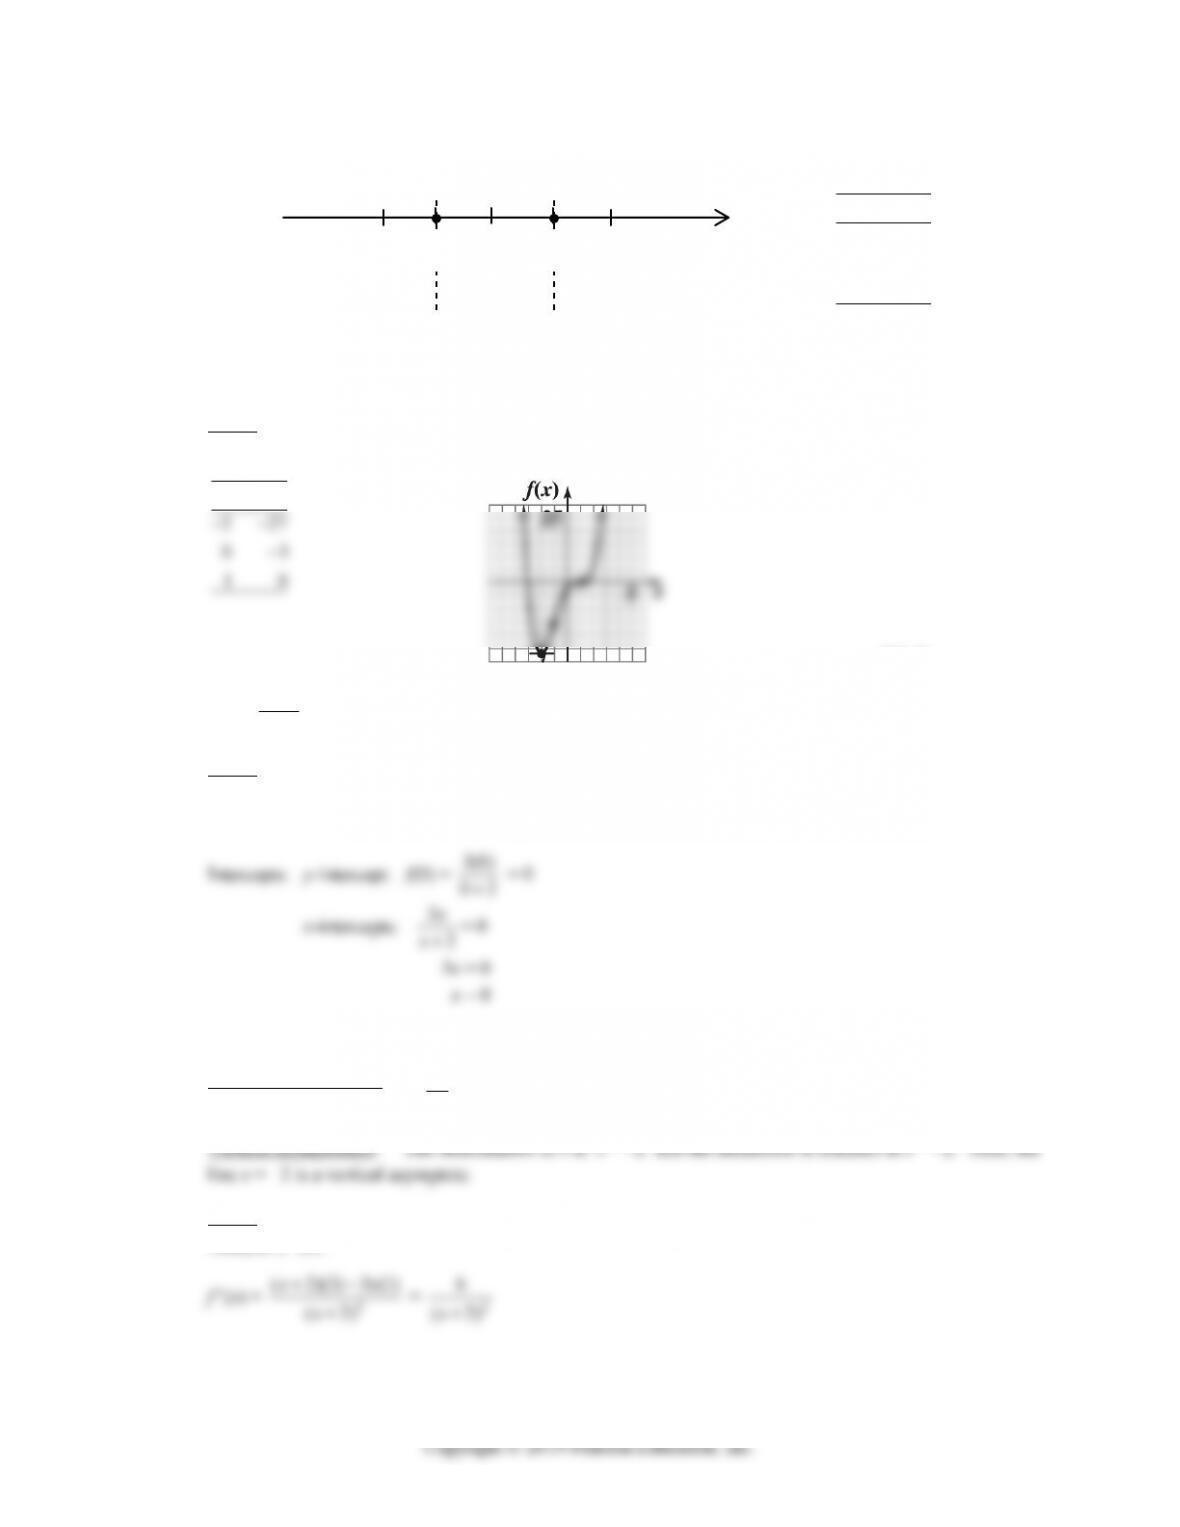
Increasing IncreasingDecreasing
f(x)
-3 -2 -1 0 1 2
216()
x
Thus, f is decreasing on (–∞, –2); f is increasing on (–2, 1) and (1, ∞); f has a local minimum at
x = –2.
Step 3:
Analyze f ‘ ‘ (x) :
CHAPTER 11 REVIEW 11-87
x
f“(x)
Graph
of fConcave
Downward
Concave
Upward
-2 -1 0 1 2
+ + + + 0 – – – – 0 + + + +
Concave
Upward
Test Numbers
”( )
236()
012()
236()
x
fx
Thus, the graph of f is concave upward on (–∞, –1) and on (1, ∞); the graph of f is concave downward on
(–1, 1); the graph has inflection points at x = –1 and at x = 1.
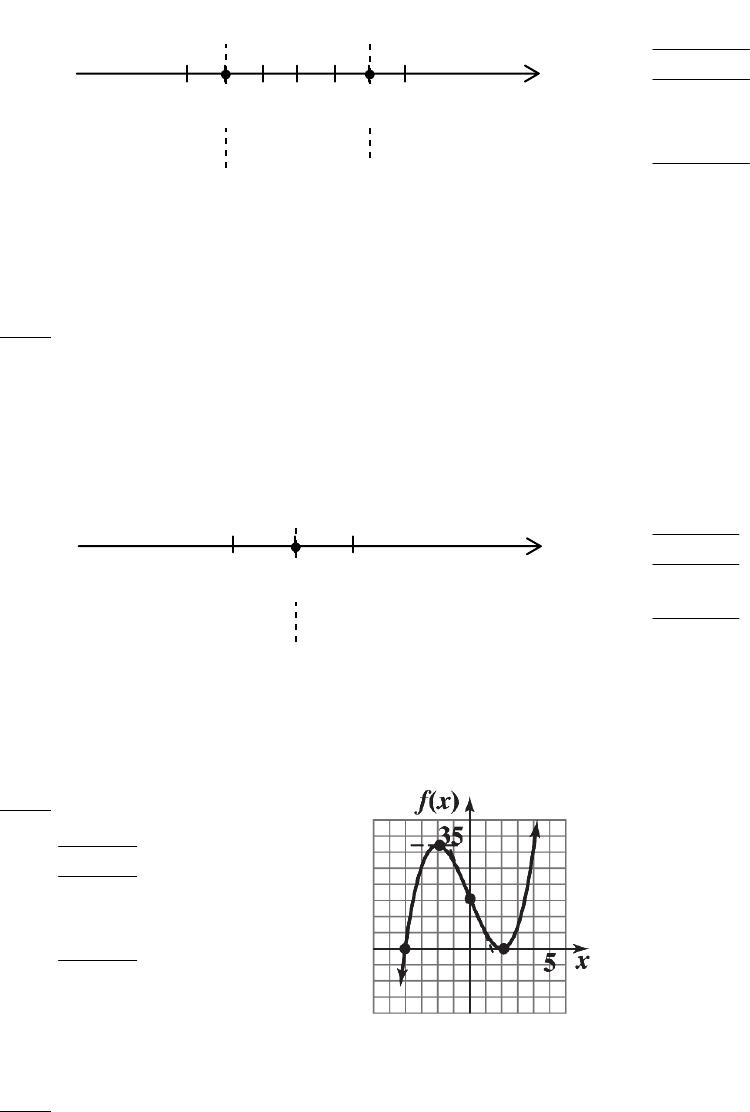
Step 4:
Sketch the graph of f:
()
x
fx
(11-4)
25. f(x) = 3
2
x
x
Step 1:
Analyze f(x):
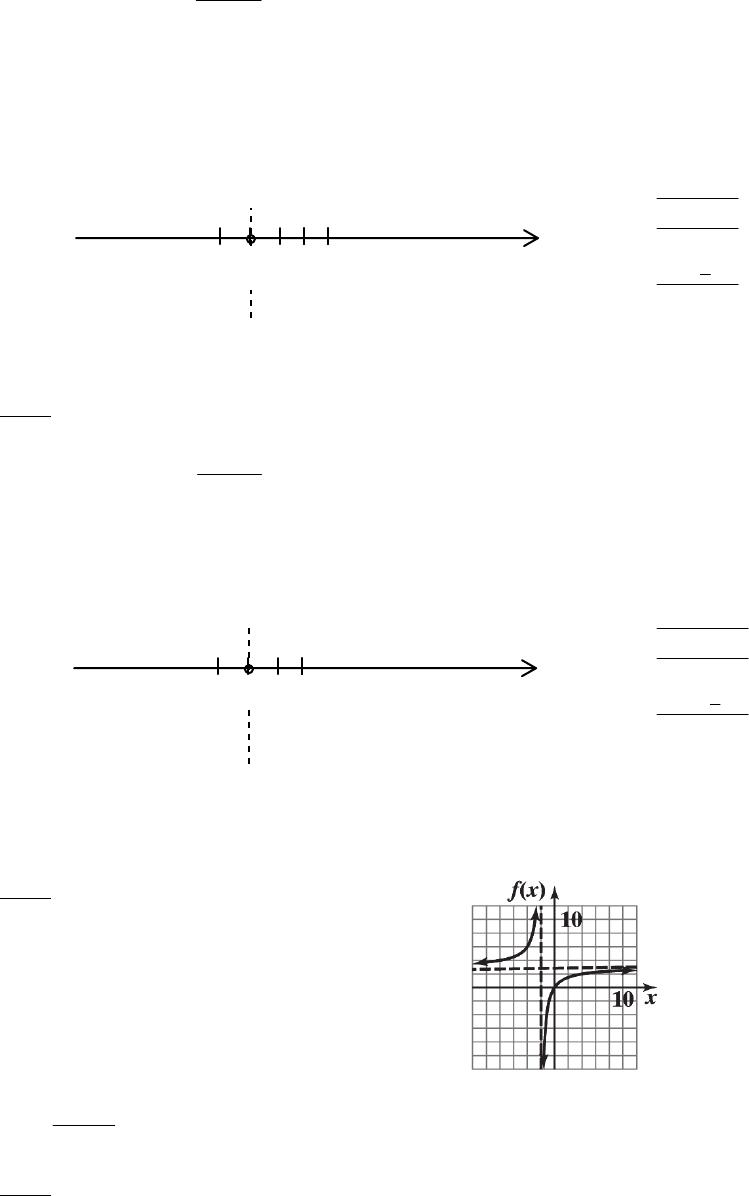
The domain of f is all real numbers except x = –2.
x
Asymptotes:
Horizontal asymptotes: 3
x
x
= 3. Thus, the line y = 3 is a horizontal asymptote.
Step 2:
Analyze f ‘ (x) :
x
11-88 CHAPTER 11: GRAPHING AND OPTIMIZATION
6
Thus, f does not have any critical values.
Partition numbers: x = –2 is a partition number for f ‘ .
Sign chart for f ‘ :
x
Step 3:
Analyze f ‘ ‘ (x):
Partition numbers for f ‘ ‘ : x = –2
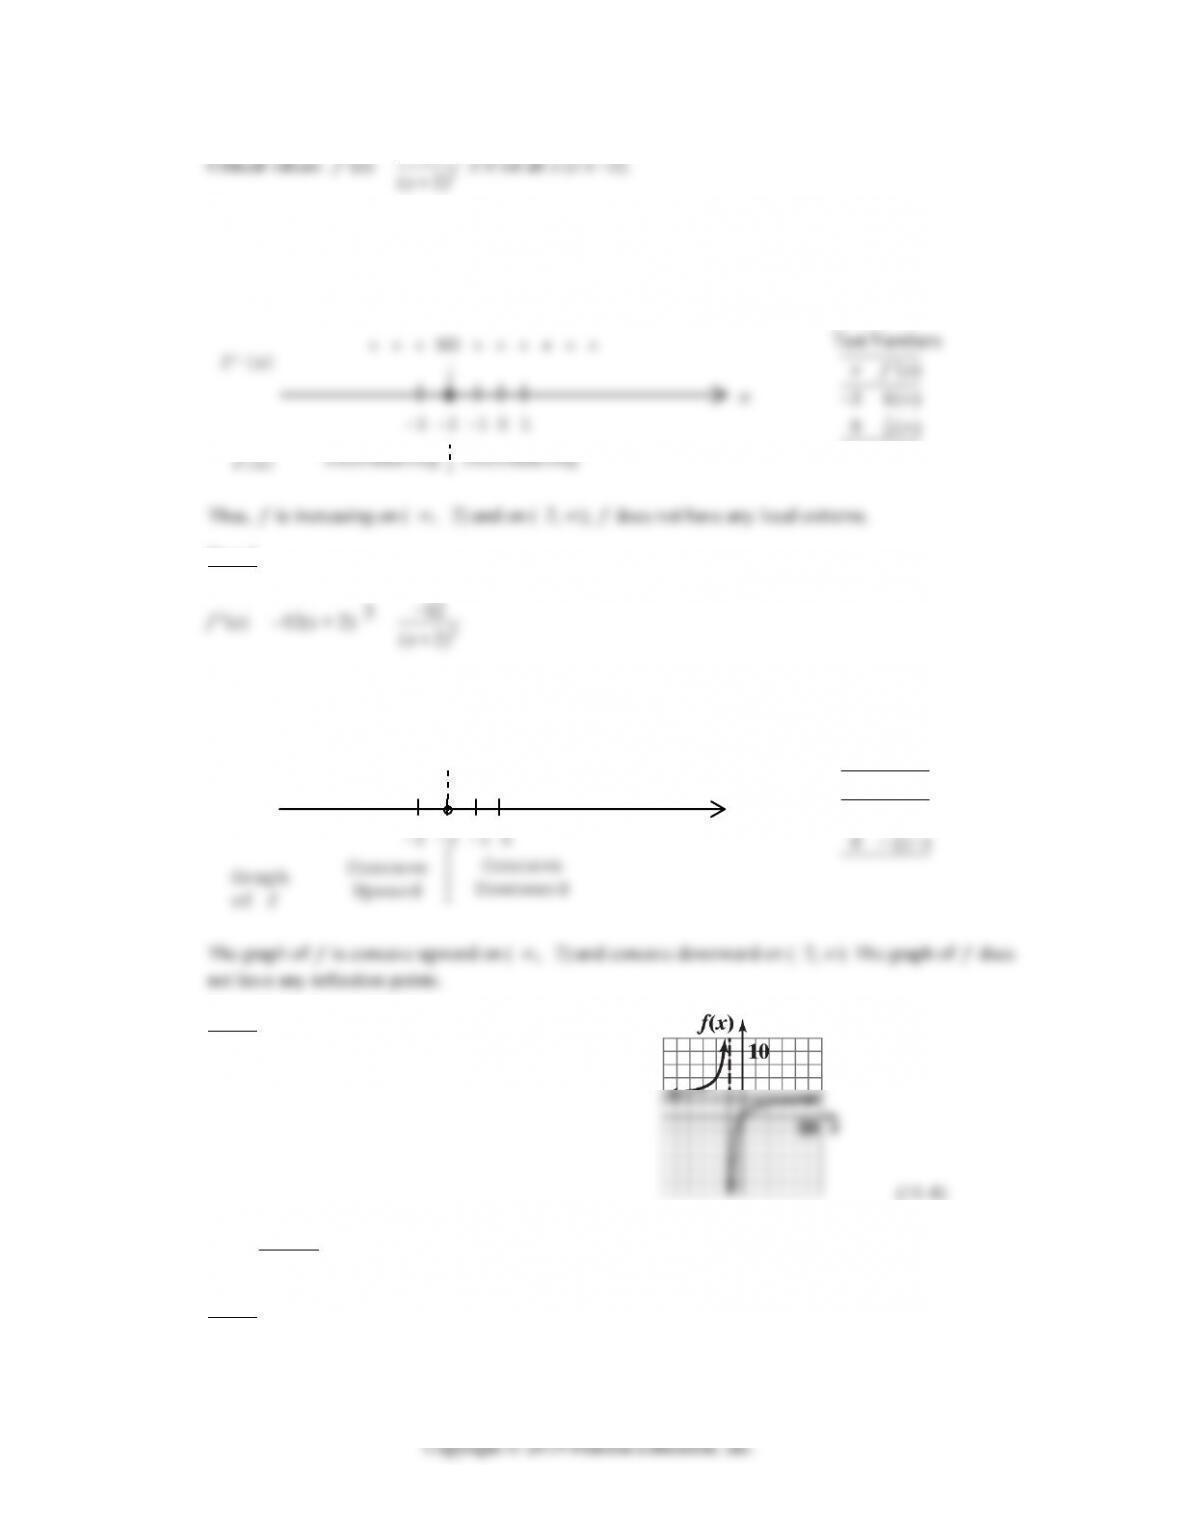
Sign chart for f ‘ ‘ :
+ + + ND – – – –
x
f“(x)
Test Numbers
“( )
312()
x
fx
Step 4:
Sketch the graph of f:
26. f(x) =
2
227
x
x
Step 1:
Analyze f(x):
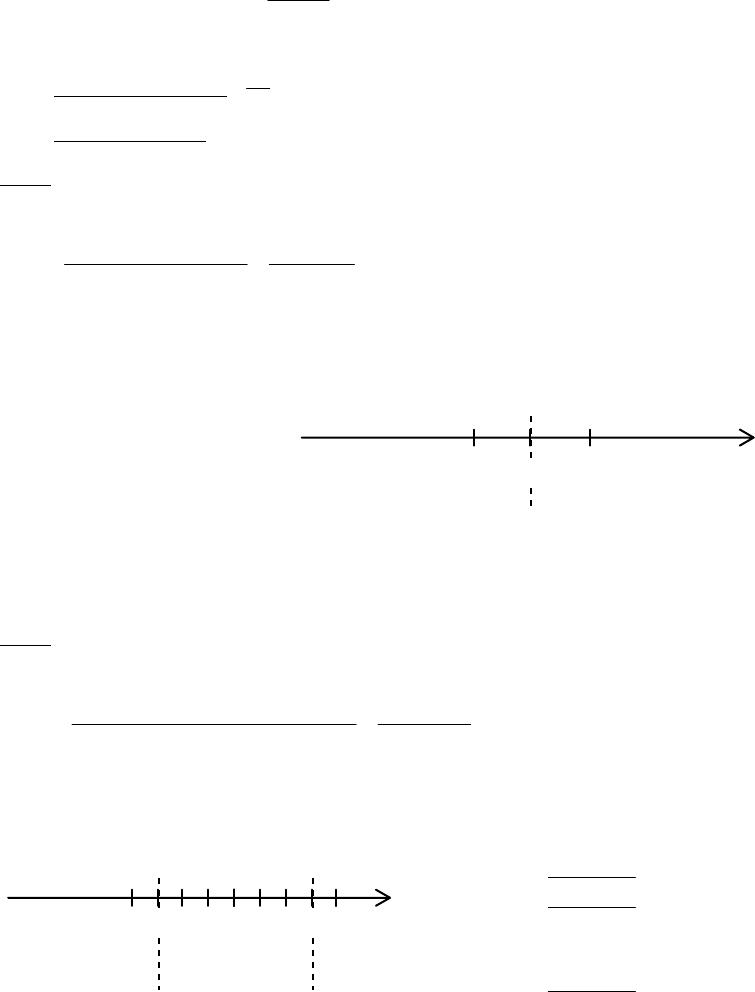
CHAPTER 11 REVIEW 11-89
(A) Domain: All real numbers.
(B) Intercepts: y-intercepts: f(0) = 0
(C) Asymptotes:
x
x
Step 2:
Analyze f ‘ (x):
Critical values: x = 0
Partition numbers: x = 0
Sign chart for f ‘ :
– – – – – 0 + + + + +
Step 3:
Analyze f ‘ ‘ (x):
x
Sign chart for f ‘ ‘ :
– – 0 + + + + 0 – –
x
f“(x)
Test Numbers
”( )
x
fx
11-90 CHAPTER 11: GRAPHING AND OPTIMIZATION
Step 4:
Sketch the graph of f:
()
x
fx
27. f(x) = 2
(2)
x
x
Step 1:
(2)
x = 0, x = 0
(C) Asymptotes:
x
Step 2:
Analyze f ‘ (x):
x
Sign chart for f ‘ :
Test Numbers
‘( )
35()
x
fx
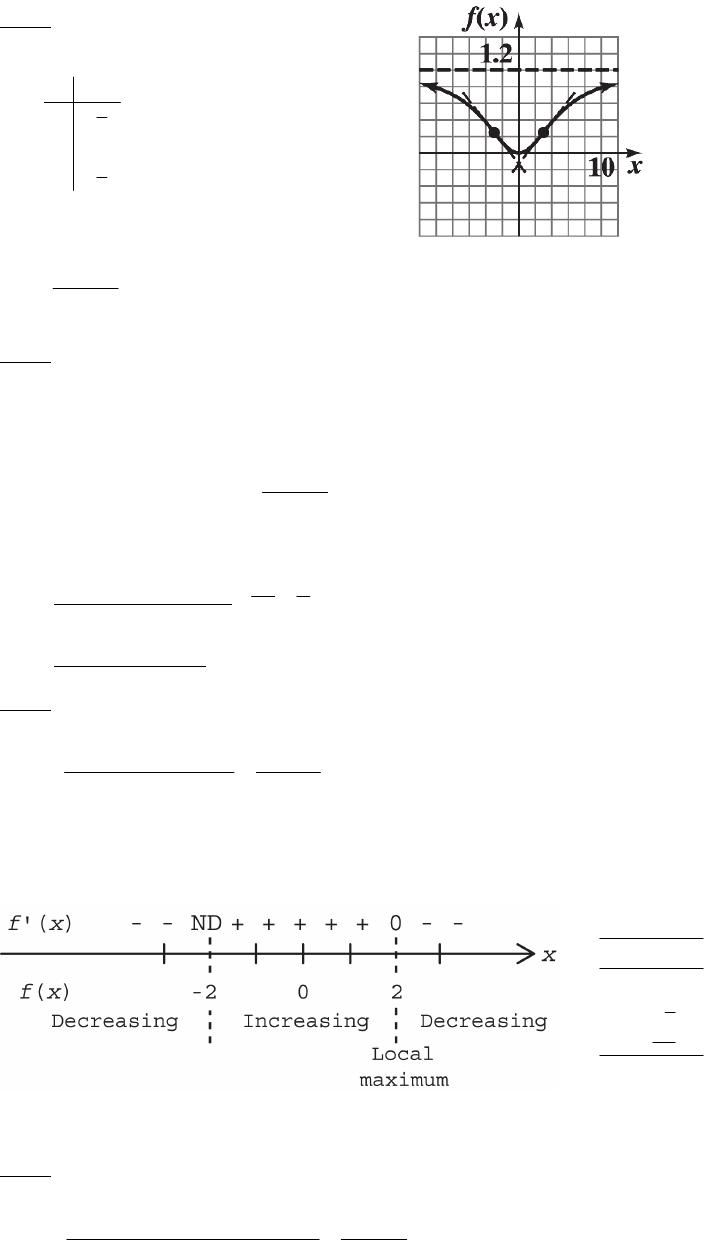
Thus, f is increasing on (–2, 2) and decreasing on (–∞, –2) and (2, ∞); f has a local maximum at x = 2.
Step 3:
Analyze f ‘ ‘ (x):
CHAPTER 11 REVIEW 11-91
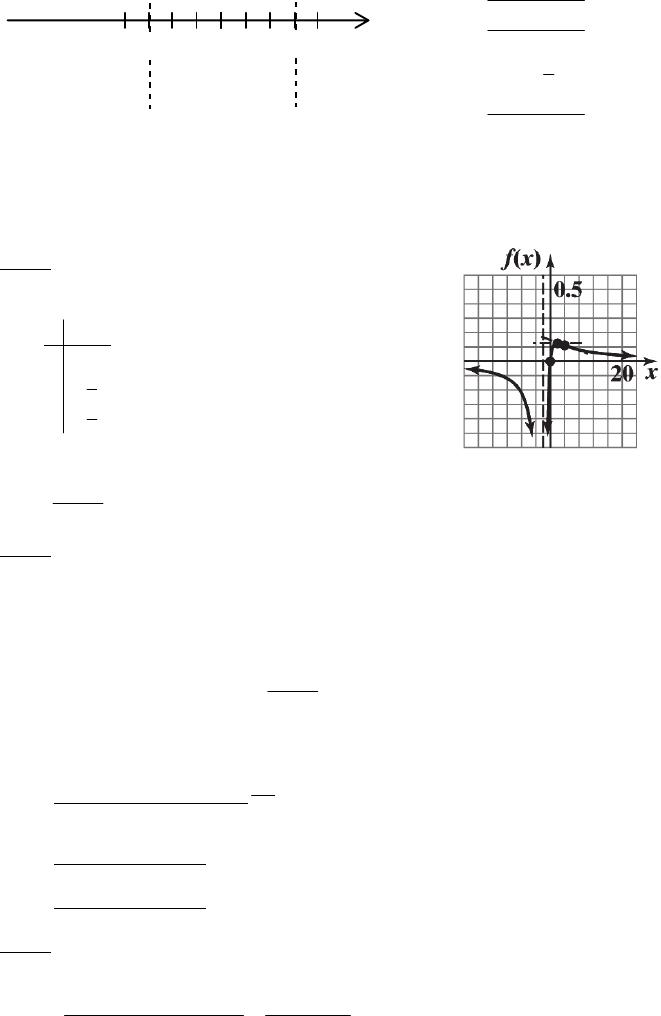
Partition numbers for f ‘ ‘ : x = –2, x = 4
Sign chart for f ‘ ‘ :
– – ND – – – – – 0 + +
x
0
f“(x)
4-2
Test Numbers
“( )
314()
x
fx
The graph of f is concave upward on (4, ∞) and concave downward on (–∞, –2) and (–2, 4); the graph has
an inflection point at x = 4.
Step 4:
x
28. f(x) =
23
x
x
Step 1:
Analyze f(x):
(A) Domain: All real numbers.
(B) Intercepts: y-intercepts: f(0) = 0
x
(C) Asymptotes:
x
x
Step 2:
Analyze f ‘ (x):
223 22
(3)(3)(2) (9)
xxxxxx
11-92 CHAPTER 11: GRAPHING AND OPTIMIZATION
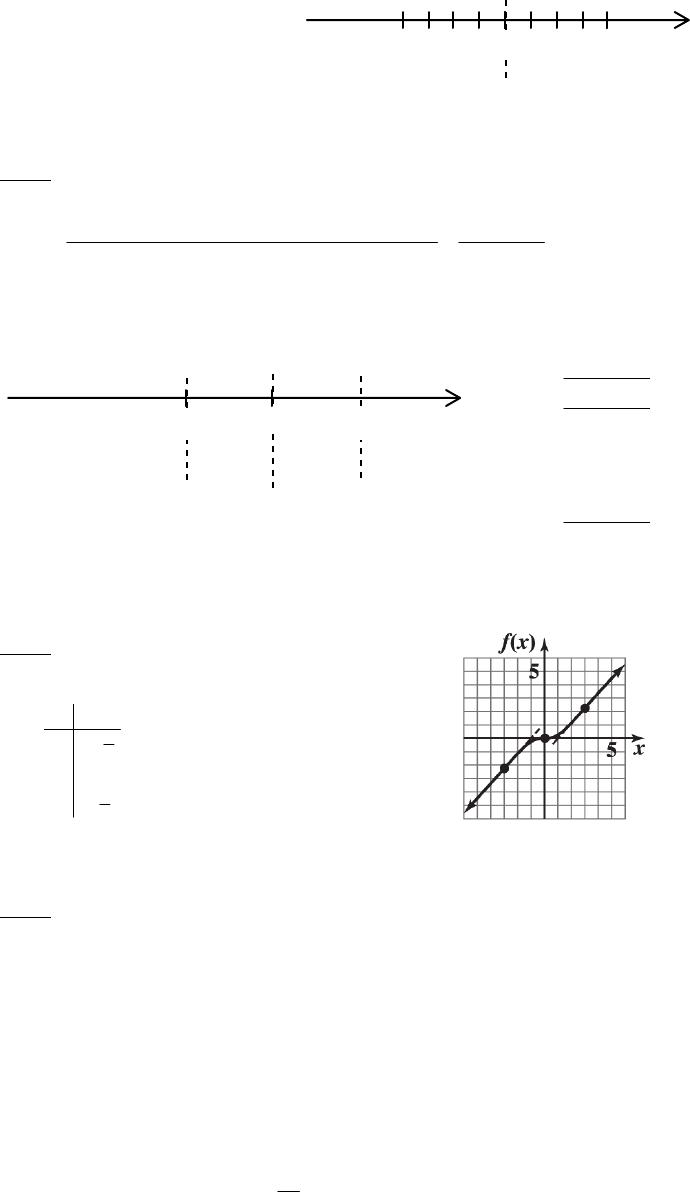
Sign chart for f ‘ :
IncreasingIncreasing
+ + + 0 + + +
f‘(x)
f(x)
x
0
f is increasing on (–∞, ∞).
Step 3:
Analyze f ‘ ‘ (x):
223 22 2 2
(3)(418)(9)(2)(3)26(9)
x
xxxx x xxx
x
x
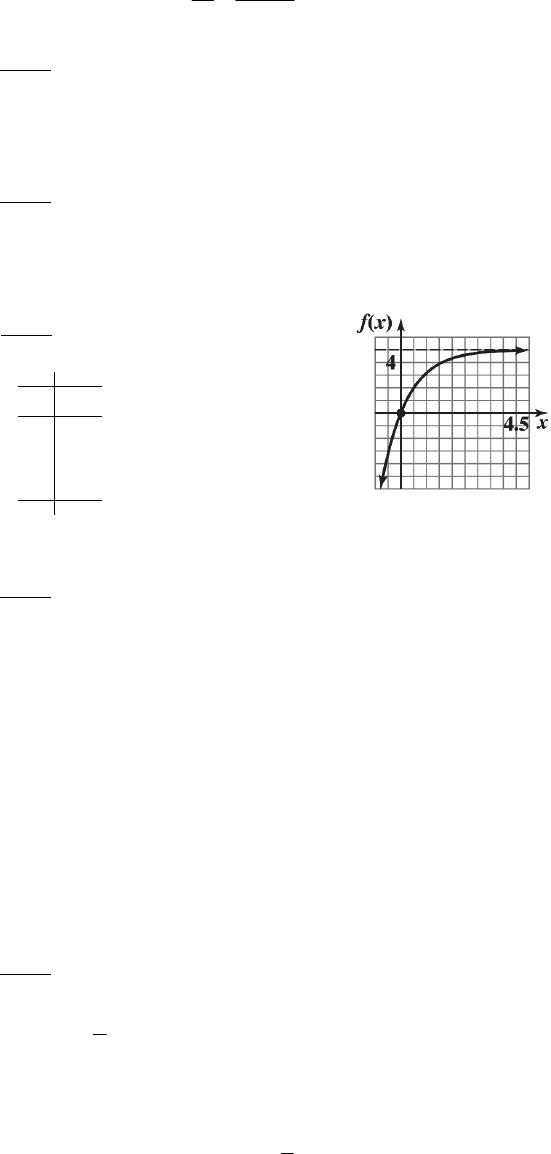
29. f(x) = 5 – 5e–x
Step 1:
Analyze f(x):
(A) Domain: All real numbers, (–∞, ∞).
(B) Intercepts: y-intercept: f(0) = 5 – 5e–0 = 0
CHAPTER 11 REVIEW 11-93
lim
x (5 – 5e–x) does not exist.
Thus, y = 5 is a horizontal asymptote.
Step 2:
Analyze f ‘‘(x):
Step 3:
Analyze f ‘ ‘ (x):
Step 4:
Sketch the graph of f:
()
x
fx
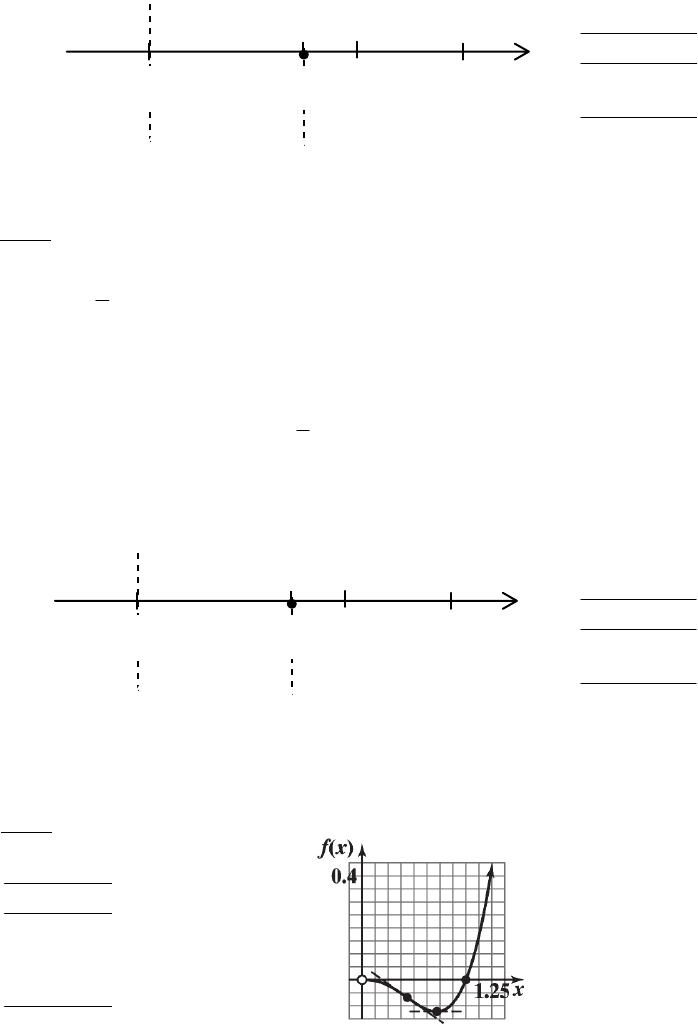
30. f(x) = x3 ln x
Step 1:
Analyze f(x):
(A) Domain: all positive real numbers, (0, ∞).
(B) Intercepts: y-intercept: Since x = 0 is not in the domain, there is no y-intercept.
(C) Asymptotes:
Step 2:
Analyze f ‘ (x):
x
11-94 CHAPTER 11: GRAPHING AND OPTIMIZATION
x = e–1/3 ≈ 0.72
Partition numbers: 1/3
x
e
Sign chart for f ‘ :
f‘(x)– – – – – 0 + + + + +
Test Numbers
x
Step 3:
Analyze f ‘ ‘ (x):
f ‘ ‘ (x) = x23
x
+ (1 + 3 ln x)2x = x(5 + 6 ln x), x > 0
Sign chart for f ‘ ‘ :
x
0 .5 1
Concave
Downward
Graph
of f
f“(x)– – – – – 0 + + + + +
e-5/6
Concave
Upward
Test Numbers
“( )
0.2 0.93( )
15()
x
fx
1/3
0.12
10
x
e

31.
0
lim
x
e
x
Step 1:
x
32. 2
lim
x
2
2
56
6
xx
xx
Step 1:
Step 2:
33.
0
lim
x
2
ln(1 )
x
x
Step 1:
0
lim
x
ln(1 + x) = ln(1) = 0 and
0
lim
x
x2 = 0.
x
x
x
34.
0
lim
x
ln(1 )
1
x
x