
1
Instructor Reserve Case Solutions
Case: The Creative Design Group
1. See the Affinity Diagram, below. It is constructed similar to Figure 11.4. The diagram for CDG
shows categories that include customer service, team environment, facilities/technology, design
goals, worker amenities, project/financial controls, competitive personnel issues, and
business/financial issues.
From this analysis, Trendy began to see that HR and technology had some issues that needed to be
addressed in her long-range plans. She suspected that the competitive business/financial issues had
impacts on, but were also impacted by, the competitive personnel and technology issues.
AFFINITY DIAGRAM FOR CREATIVE DESIGN GROUP
Customer Service
Speed
Quality
Creativity
Value
Team Environment
Independent design
Creative direction
CSE project costing
Facilities/Technology
Modern computers
Modern software
Excellent lighting
Modern communications

Strategy and Performance Excellence 2
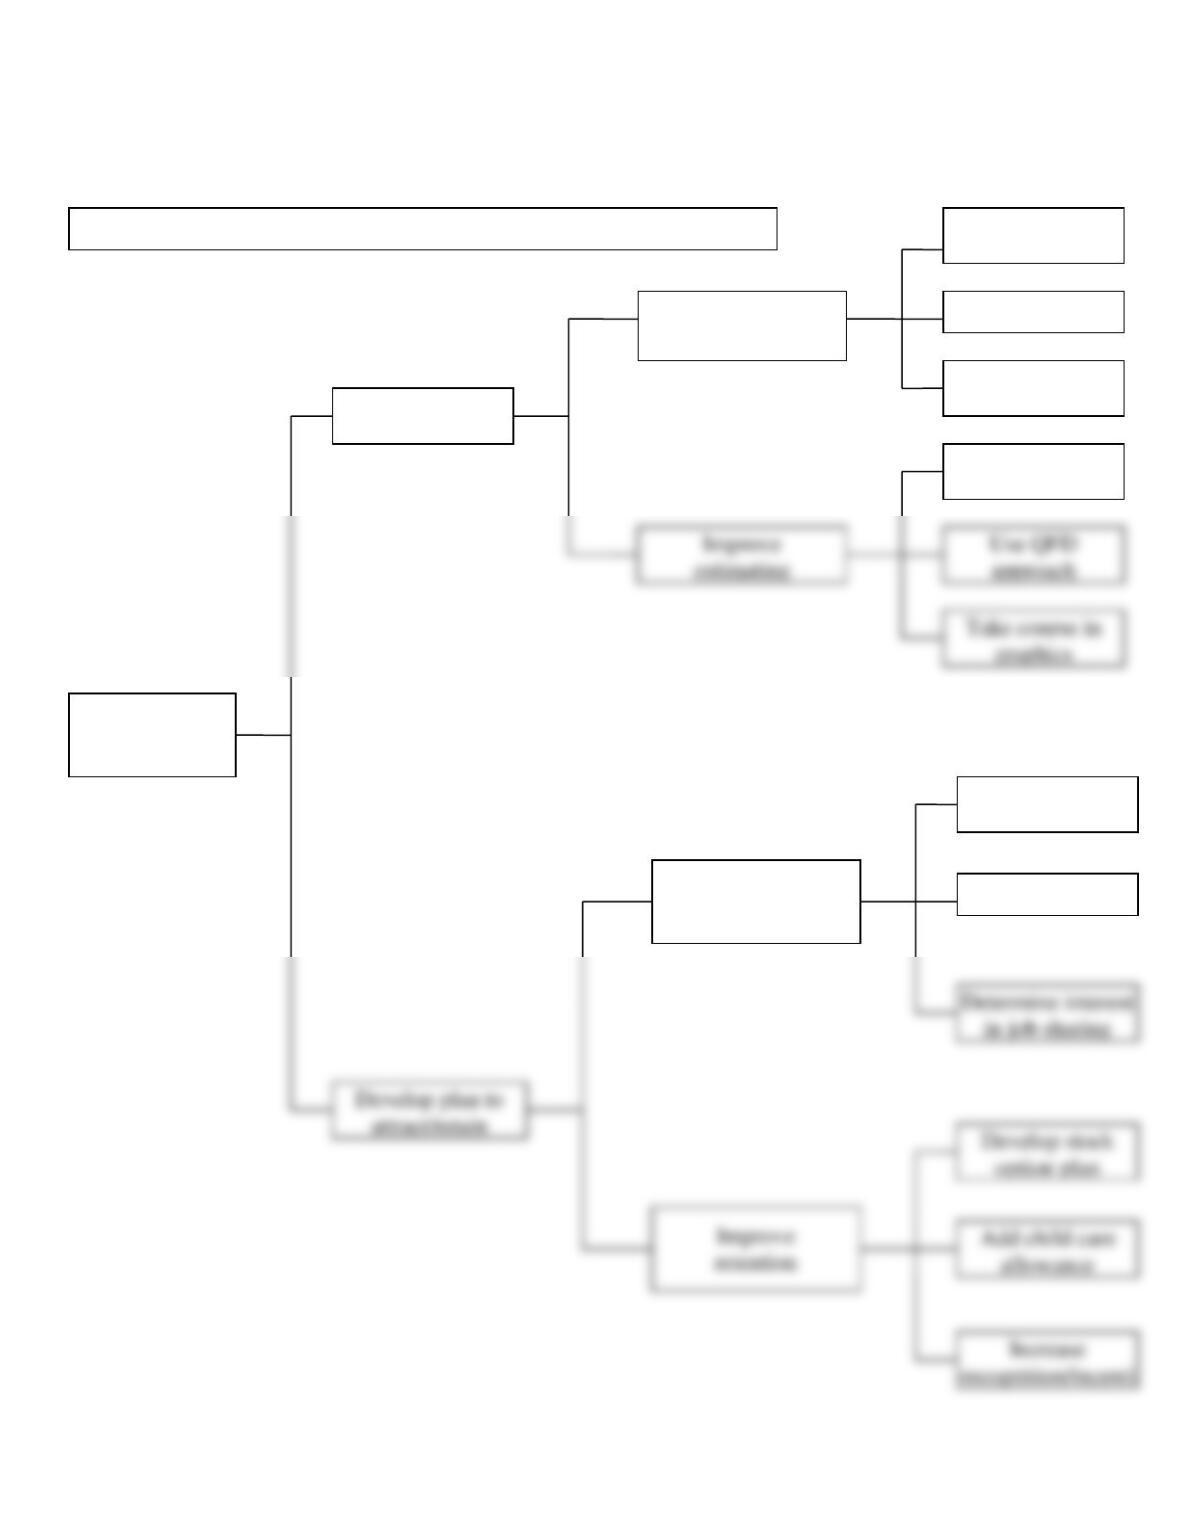
2. See the tree diagram, below. It can be seen how plans are “cascaded” going from left to right.
They become more specific, resulting in action plans to deal with competitive business issues of
Strategy and Performance Excellence 3
Make advertising
more effective
Place “spot” ads
on
radio
Redesign website
Place ads in
business
newspapers
graphics
Keep and use job
cost/time data
estimating
Improve
recruiting
Develop co-op
position
Pay a sign-on
bonus
Develop plan to
meet competition
Develop action
plans
TREE DIAGRAM FOR CDG ACTION PLANNING
Improve
in job sharing
Strategy and Performance Excellence 4
3.a. Matrix Data Analysis
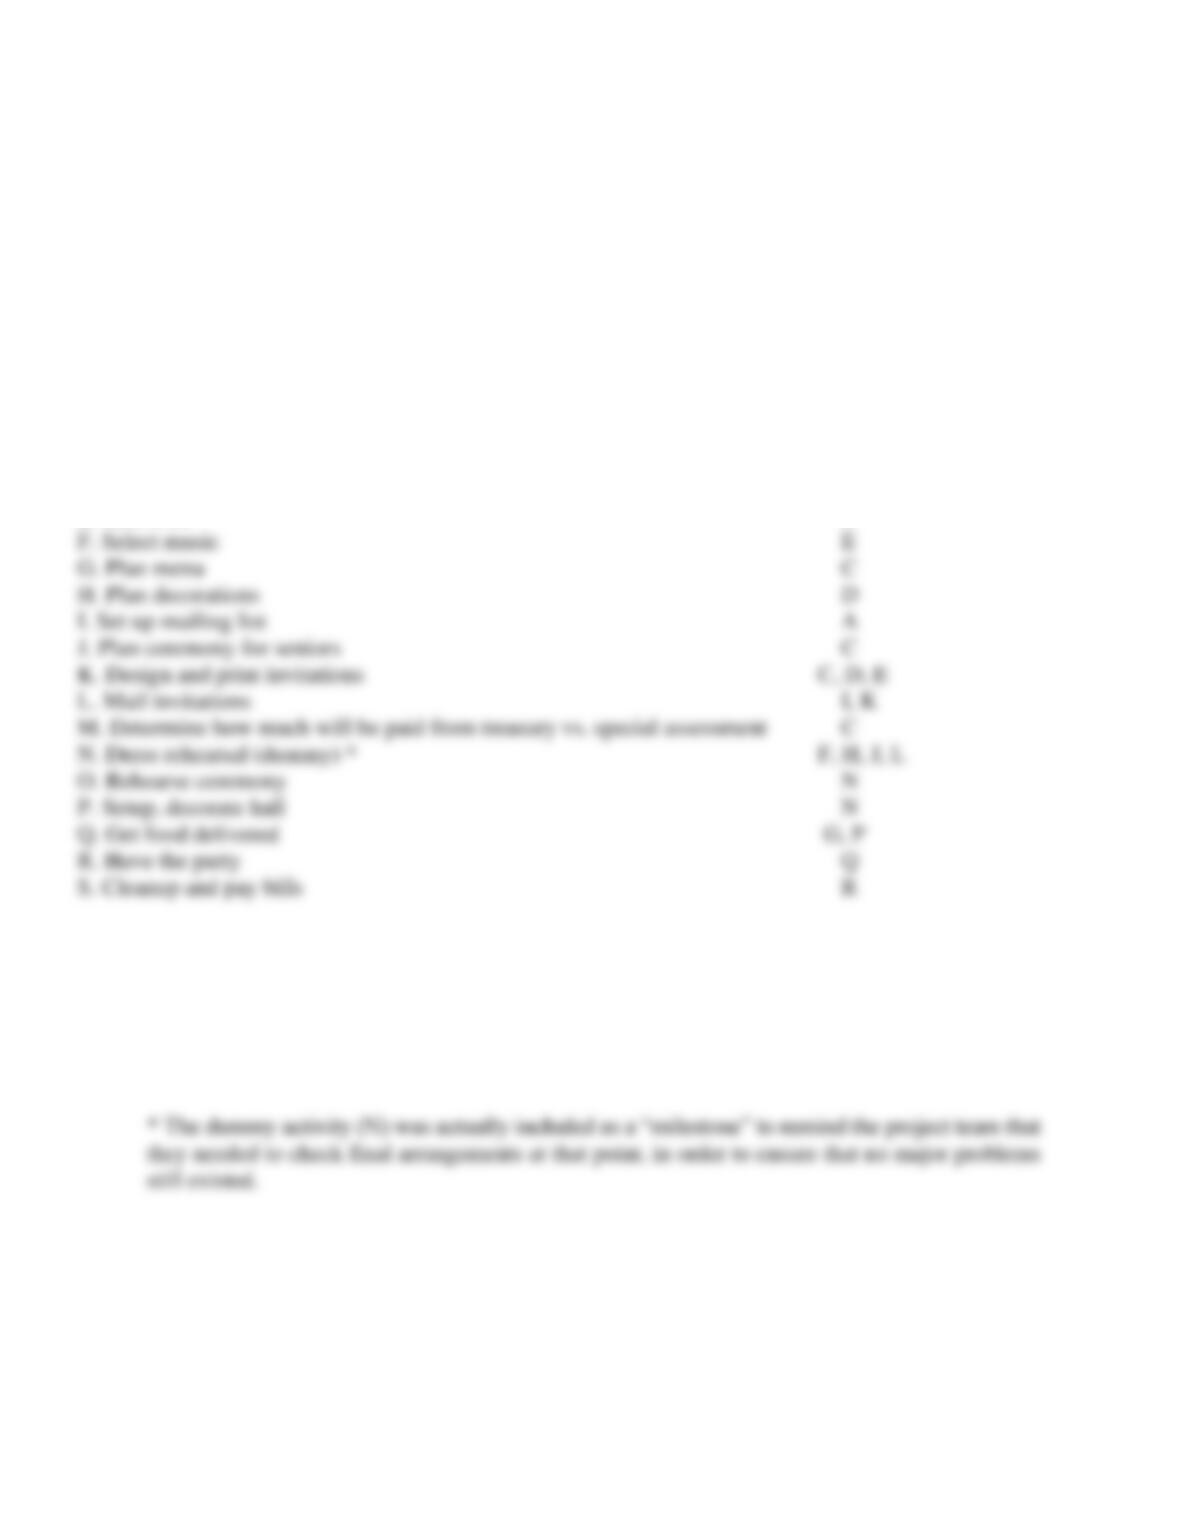
The Matrix Data Analysis chart shown below confirms that by using the weighted ratings across
all competitors, the correct selection is CCG. CCG has a total of 7.0 points (out of a possible 10),
while the next closest competitor is COG, with a total of 6.1.
Supplier
Characteristics
Weights
Rating
for
CCG
Rating
for
COG
Rating
for
COW
Wtd.
Value
CCG
Wtd.
Value
COG
Wtd.
Value
COW
System design
reliability
0.3
8
6
5
2.4
1.8
1.5
Note: Independent ratings on a scale of 1-10 (where 10 is best) were performed by the Small Business
Council of Qualdale, where CDG is located.
3.b) Questions that CDG’s management should ask Charlie include:
1. Will we be able to continue working while you’re installing the new system?
2. If not, how long will we be down?
3. Can you provide us with a detailed project plan so that we will know when various milestones
have been reached?
4. What warranties will be provided for the hardware, software, and CCG’s installation?
Delivery
timeliness
0.2
7
4
9
0.2
5
7
6
0.2
9
6
4
0.1
4
9
6
1.0
Strategy and Performance Excellence 5
Case – The Graduation Party
1. In order to develop a PERT-type network diagram activities must first be labeled, and precedence
relationships must be established.
Activity Precedent(s)
A. Pick date –
B. Estimate costs A
C. Determine budget B
D. Locate and “book” a hall C
E. Hire a DJ C
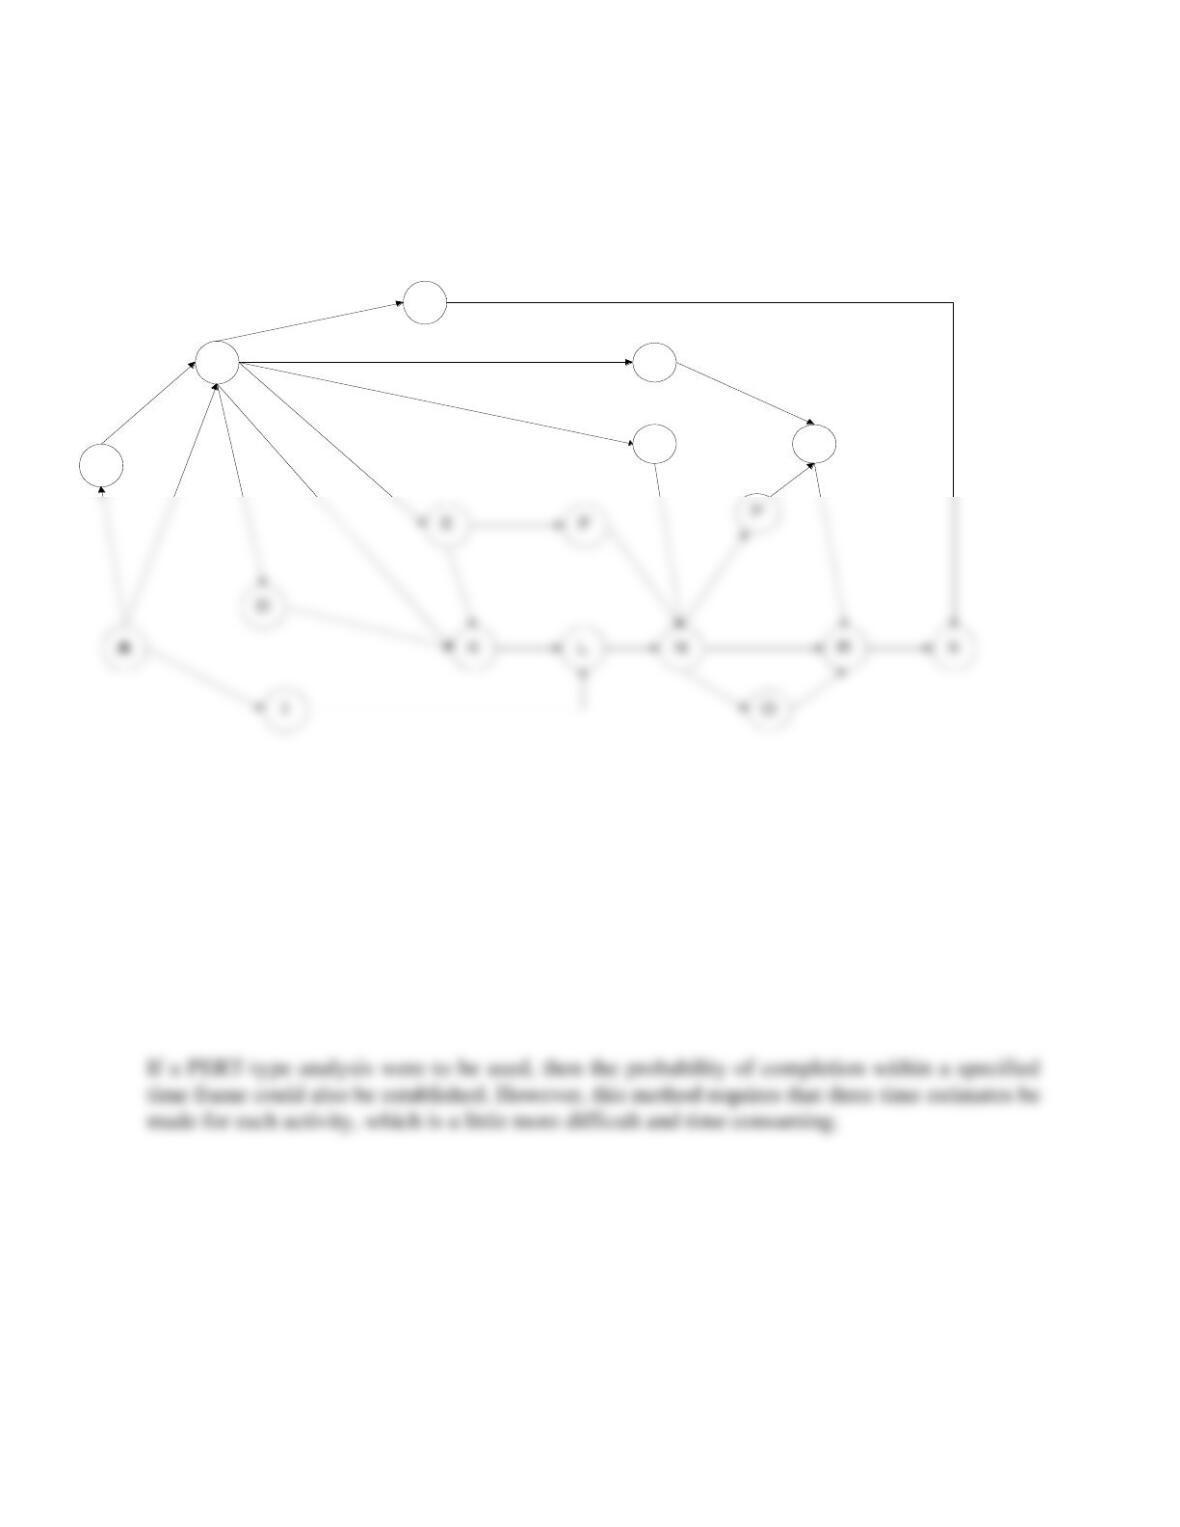
See the interrelationship digraph below.
b) Activity C (Determine budget) is obviously a critical activity on which a number of others
depend. Designing and printing (Activity K) and the Dress rehearsal (dummy activity N) are ones
in which the long-range results terminate.
Strategy and Performance Excellence 6
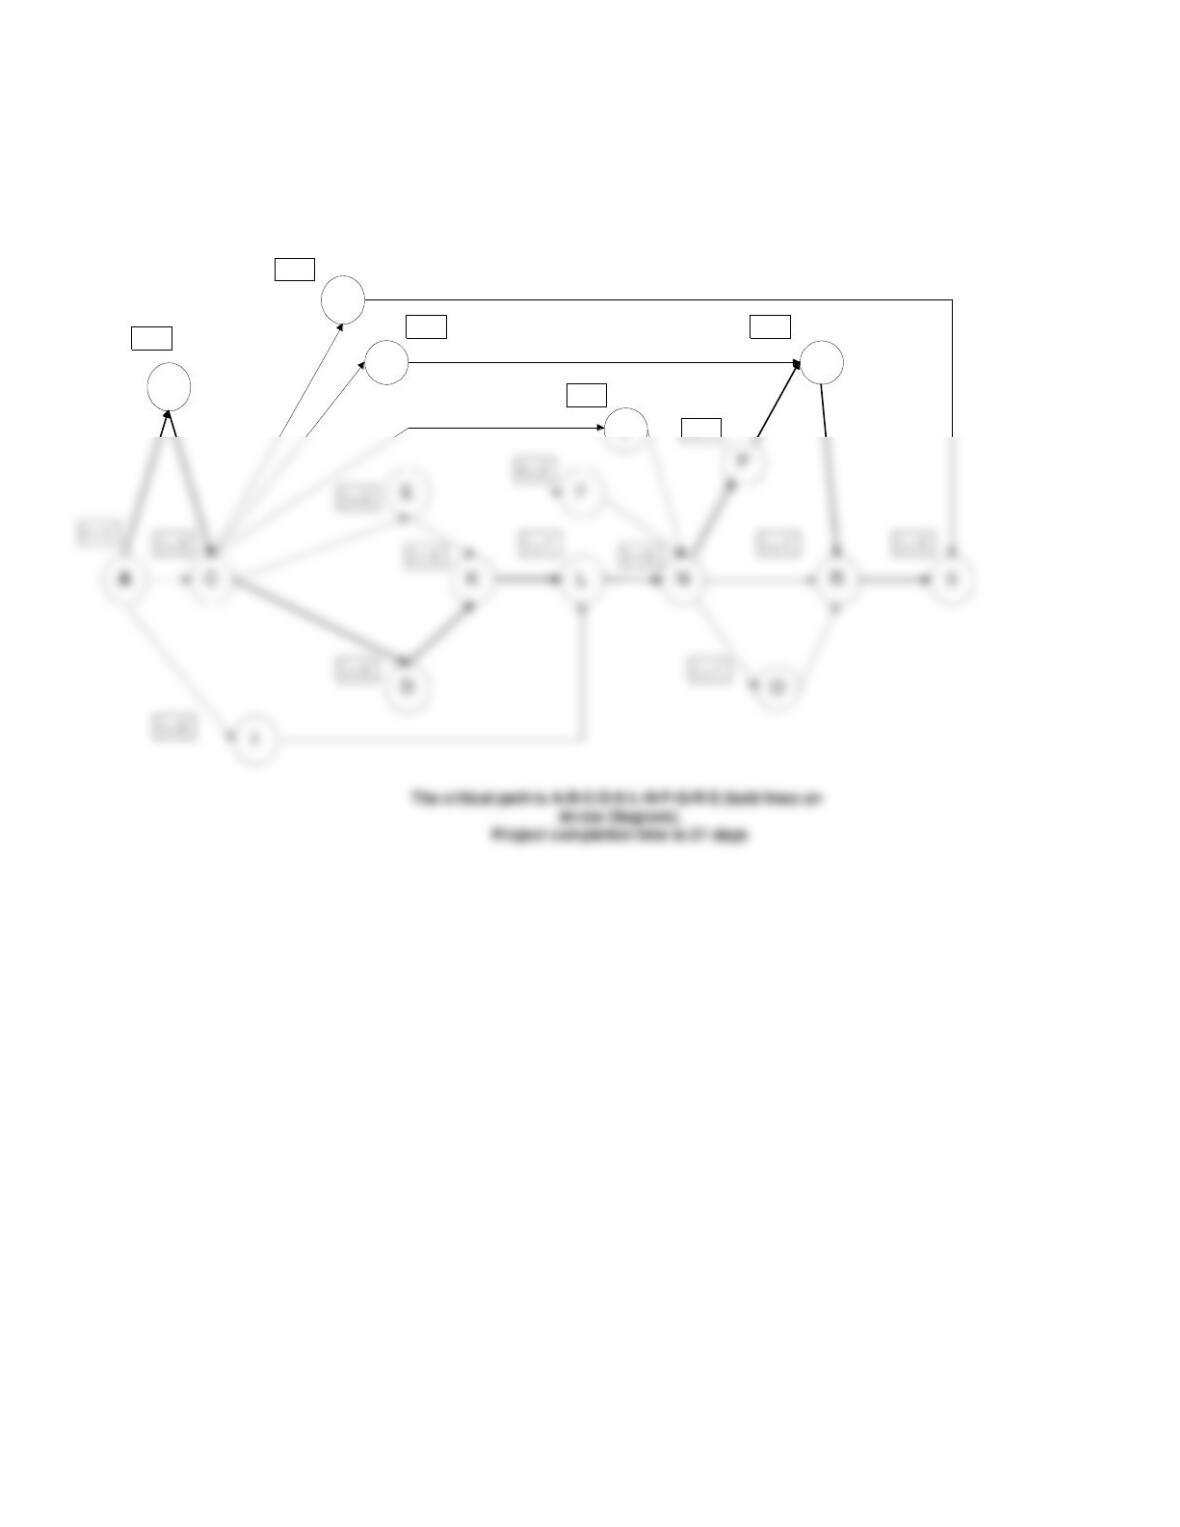
3. a) and b) Using data from the interrelationship digraph (see problem 1), an arrow diagram can be
established. The Arrow Diagram, shown above, shows precedent relationships for each activity.
The technique has been extended a little further by the use of the PERT/CPM technique in order
to calculate the critical path and the estimated project completion time, which are shown on the
diagram. The arrow diagram indicates that Joe and his team have a minimum of 21 days to
complete the project, if their single time estimates for each activity are accurate.
B
C
M
G
J
Q
INTERRELATIONSHIP DIAGRAPH DMZ PARTY PLAN
Strategy and Performance Excellence 7
B
M
G
J
Q
ARROW DIAGRAM FOR DMZ PARTY PLAN
t = 3 t = 2
t = 1
t = 2
t = 1
t = 1
WML/JRE 8/31/15