Chapter 10S – Acceptance Sampling
CHAPTER 10S
ACCEPTANCE SAMPLING
Teaching Notes
Accounting may be particularly appreciative of this segment on acceptance sampling since it involves
exactly the same principles as auditing.
There are three points in the production process where monitoring takes place: before production,
during production, and after production. The logic of checking conformance before production is to
make sure that inputs are acceptable. The logic of checking conformance during production is to make
sure that the conversion of inputs into outputs is proceeding in an acceptable manner. The logic of
Answers to Discussion and Review Questions
1. The objective of acceptance sampling is to make a decision on whether to accept or reject a
2. Process control is directed towards future output while lot control is concerned with passing or
3. An operating characteristic curve is the relationship between lot quality and probability of lot
4. The two basic factors in choosing between single and multiple sampling are the cost per
sample and the cost per observation. Single sampling is characterized by one sample of many
5. a. AOQ is the average outgoing quality. In a given case, it depends on the sampling plan
used (which determines the probability of acceptance) and the lot quality.
b. AOQL is the average outgoing quality limit. It refers to the worst possible outgoing
quality, and occurs at an intermediate quality level which is neither very good nor very
Chapter 10S – Acceptance Sampling
10S-2
Solutions:
1. Inspection cost is $12/hr. Replacement cost is $30 per defective. At a rate of 60 pieces per
hour, the inspection cost is
piece/20$.
.hr/p60
12$=
Chapter 10S – Acceptance Sampling
10S-3
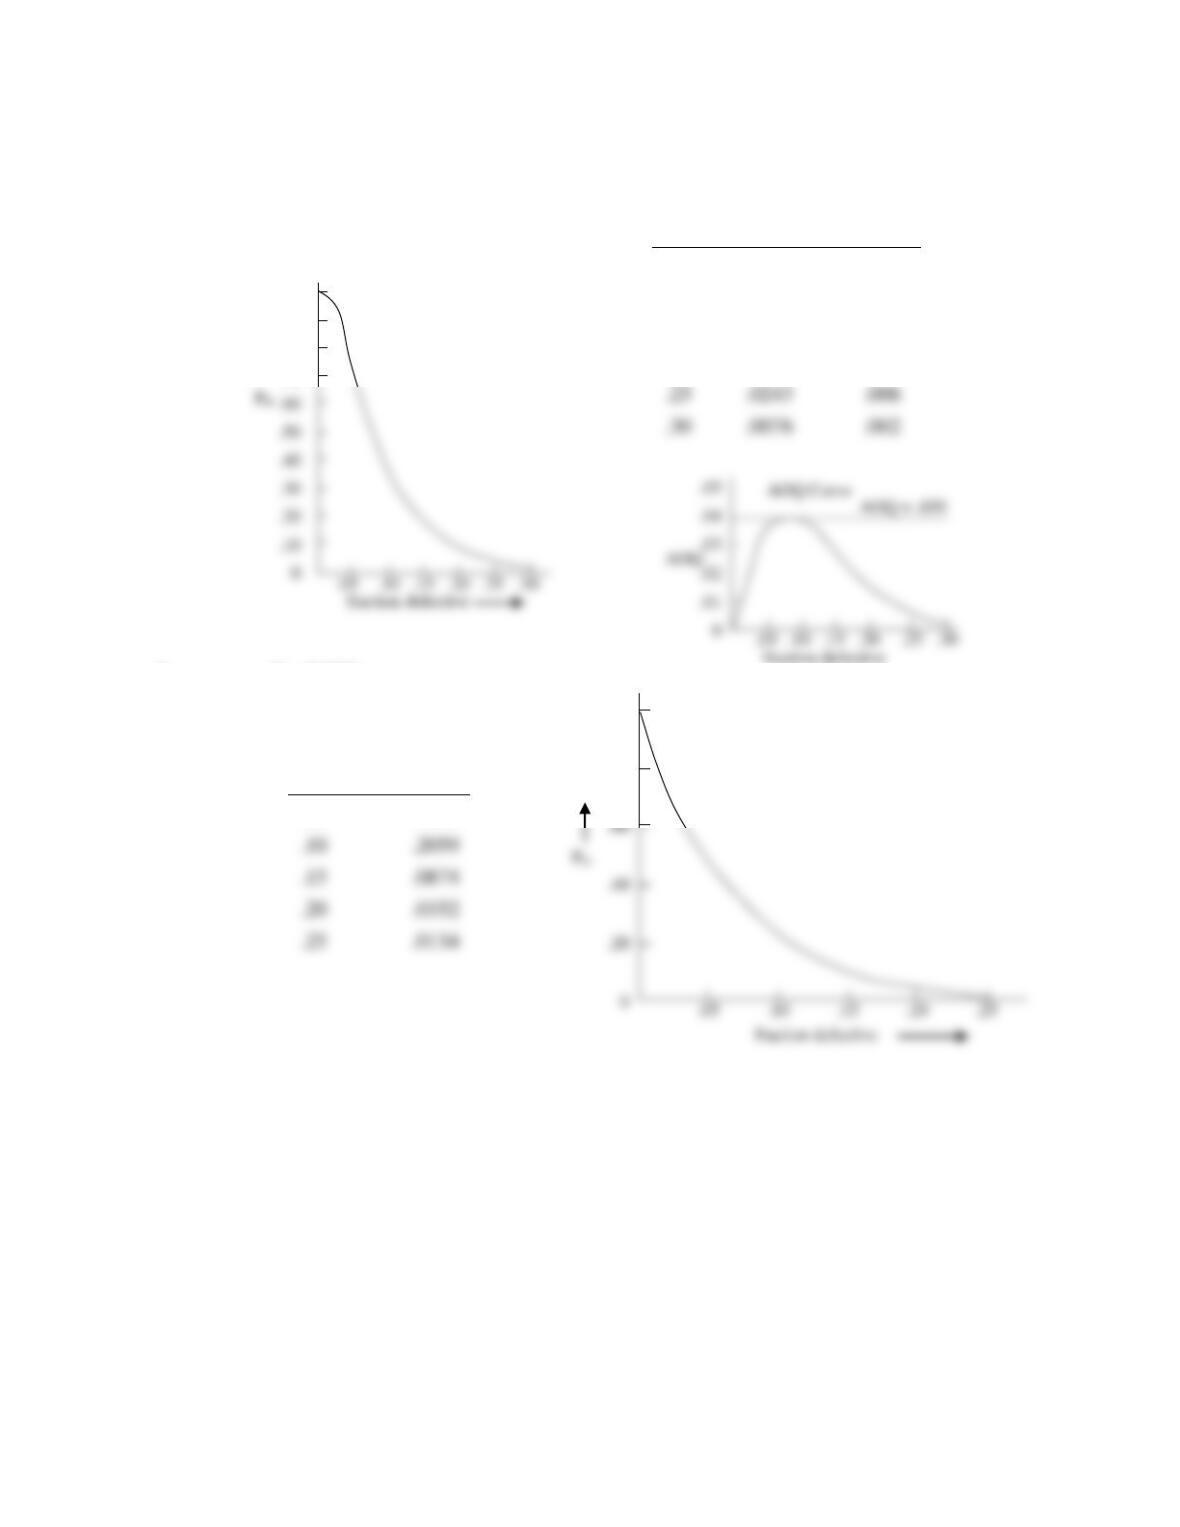
2. N = 4,000 [Use binomial table
n = 20 because n = 20]
c = 1
p
Pac
p(Pac)
.05
.7358
.037
.10
.3917
.039
.15
.1756
.026
.20
.0692
.014
3. a. N = 8,000
n = 15 [use binomial]
c = 0
p
Pac
.05
.4633
.10
.2059
.15
.0874
.20
.0352
.25
.0134
OC Curve
1.00
.90
.80
.70
OC curve
1.00
.80
a.
.25
.0243
.006
.30
.0076
.002
Chapter 10S – Acceptance Sampling
10S-4
b. N = 8,000
n = 150 [use Poisson]
c = 0
p
np
Pac
p(Pac)
.001
.15
.861
.009
.002
.30
.741
.0015
.003
.45
.638
.0019
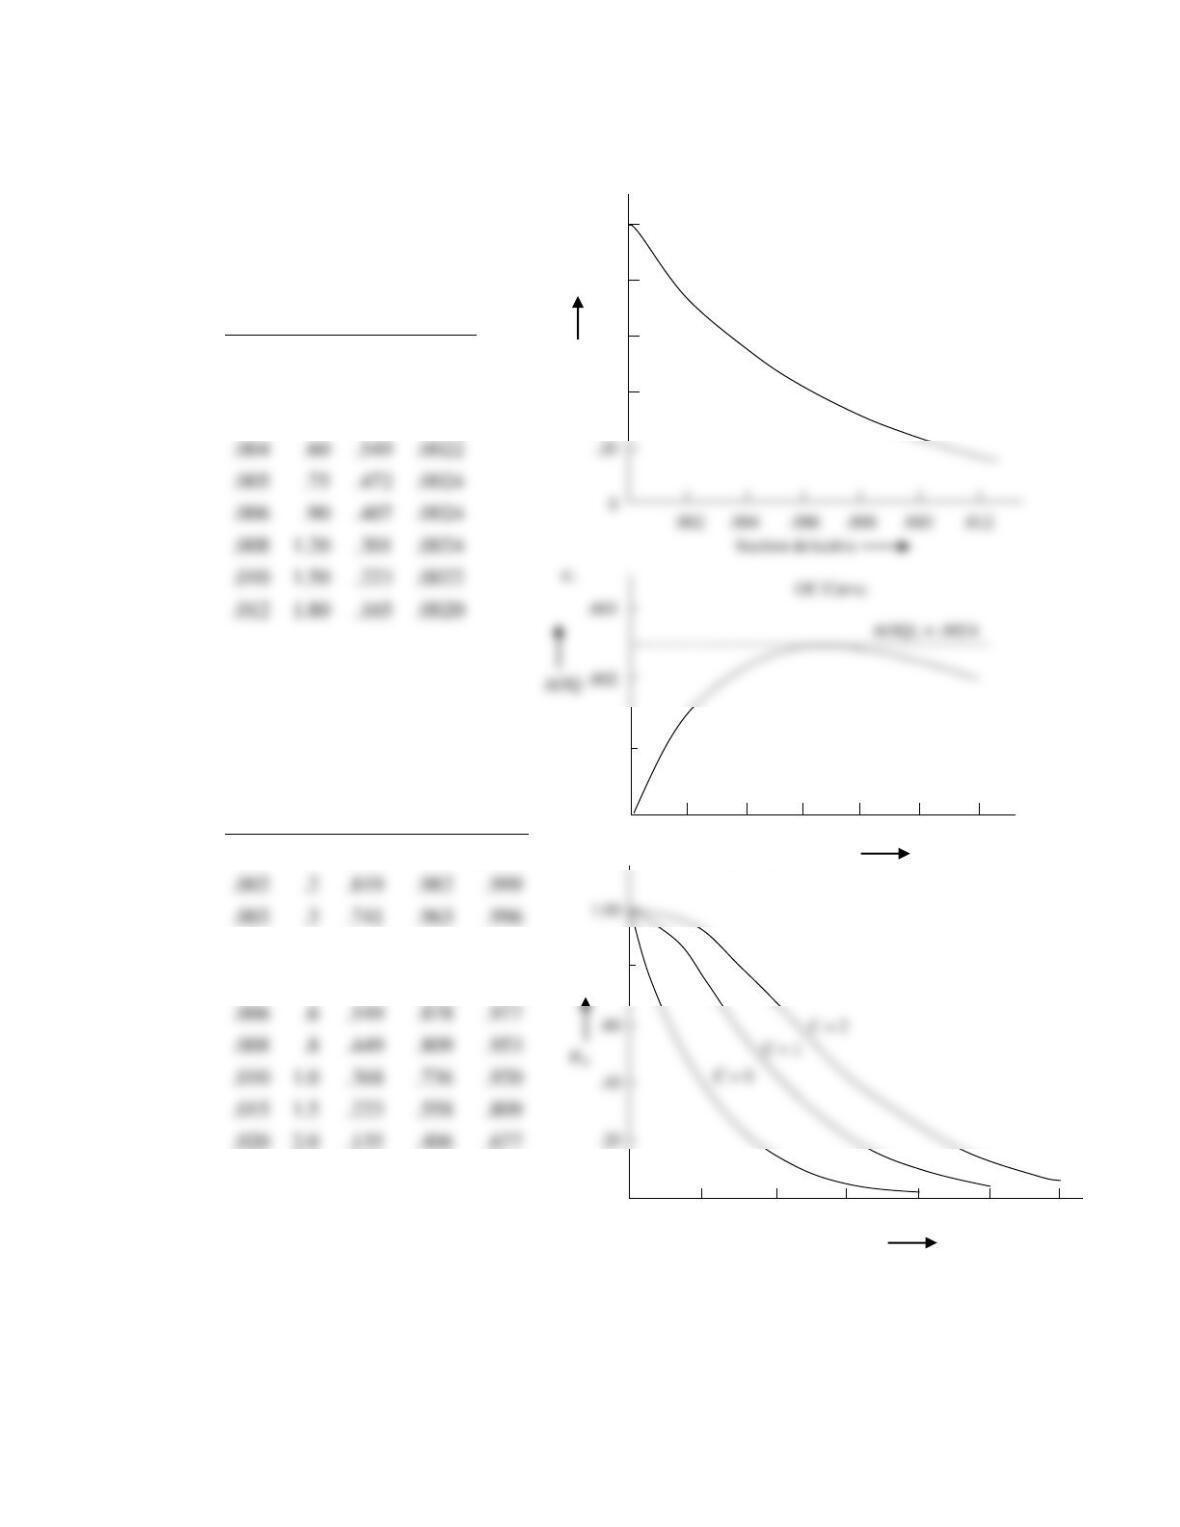
4. a.
[n = 100]
c = 0
c = 1
c = 2
p
np
Pac
Pac
Pac
.001
.1
.905
.995
1.000
.002
.2
.819
.982
.999
.003
.3
.741
.963
.996
.004
.4
.670
.938
.992
.005
.5
.607
.910
.986
.006
.6
.549
.878
.977
.008
.8
.449
.809
.953
.010
1.0
.368
.736
.920
.020
2.0
.135
.406
.677
C = 2
C = 1
C = 0
.030
3.0
.050
.199
.423
.040
4.0
.018
.092
.238
.050
5.0
.007
.040
.125
OC Curve
Pac
1.00
.80
.60
.40
.001
0
.002 .004 .006 .008 .010 .012
fraction defective
.80
.00
.01 .02 .03 .04 .05 .06
fraction defective
.004
.60
.549
.0022
.005
.75
.472
.0024
.006
.90
.407
.0024
.008
1.20
.301
.0024
.010
1.50
.223
.0022
.012
1.80
.165
.0020
fraction defective
OC Curve
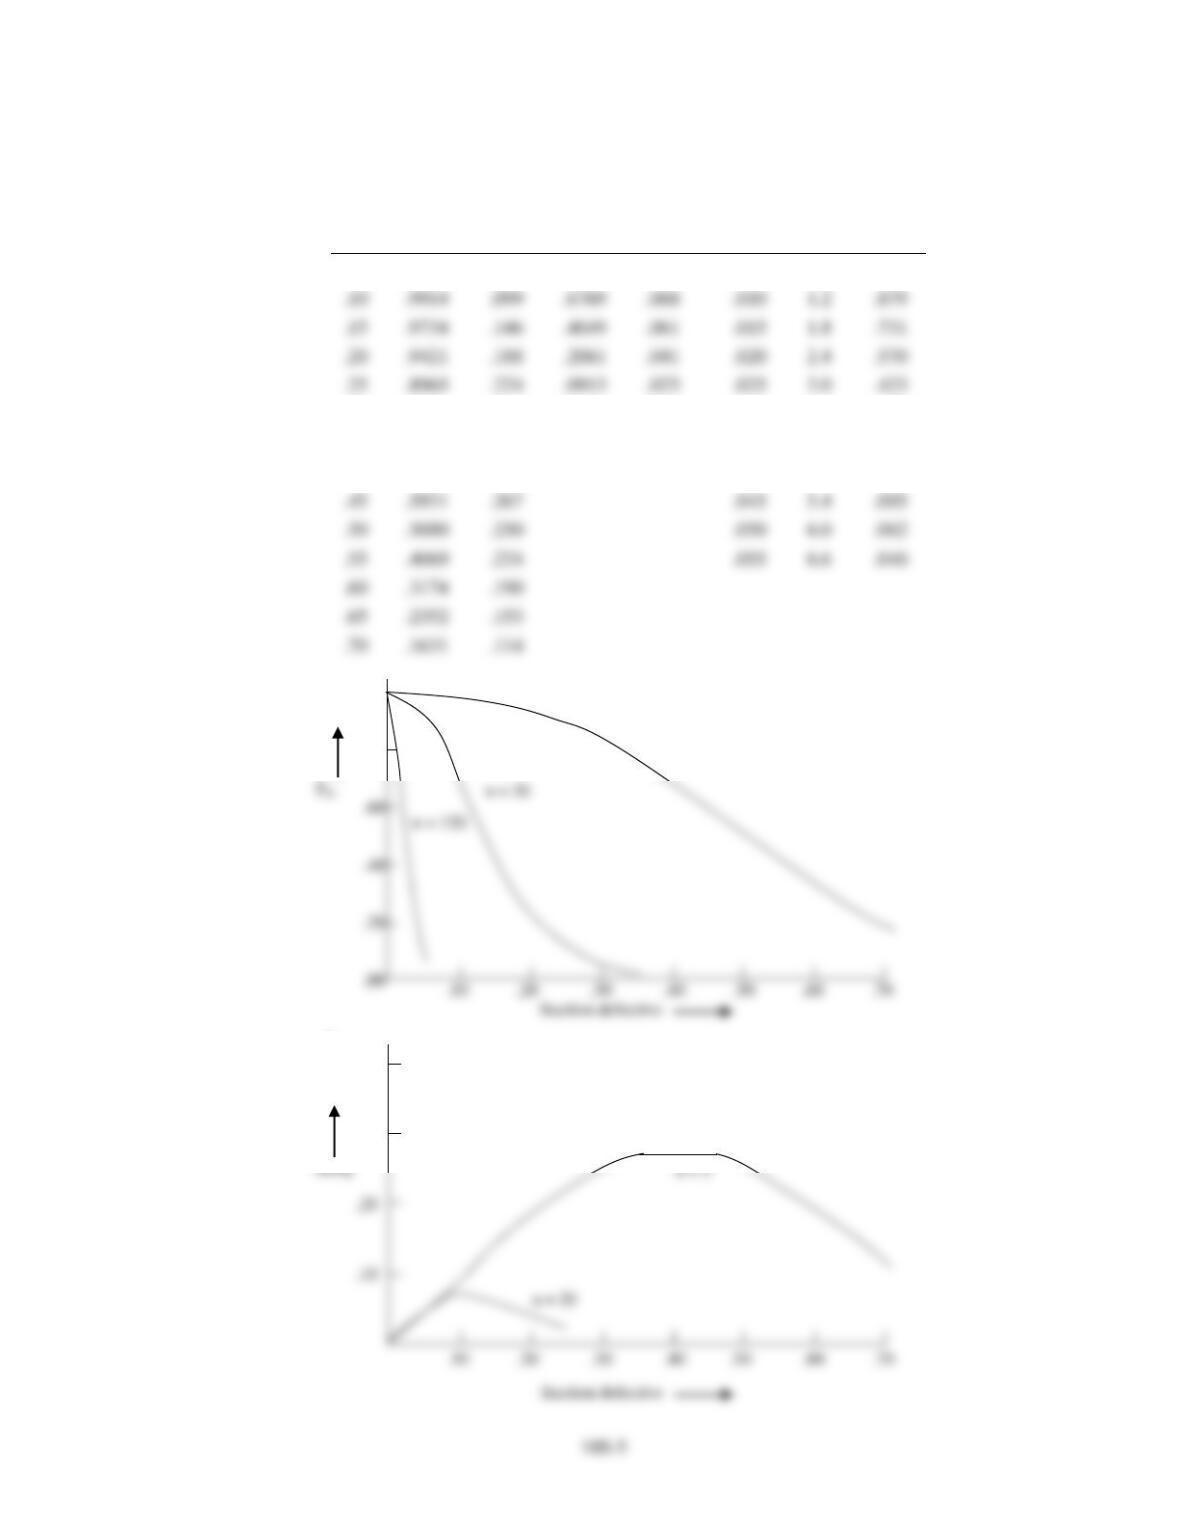
Chapter 10S – Acceptance Sampling
[Binomial table]
[Poisson table]
b.
n = 5
n = 20
n = 120
c = 2
p
Pac
AOQ
Pac
AOQ
p
np
Pac
.05
.9988
.050
.9245
.046
.005
.6
.977
.10
.9914
.099
.6769
.068
.010
1.2
.879
.15
.9734
.146
.4049
.061
.015
1.8
.731
.20
.9421
.188
.2061
.041
.020
2.4
.570
.25
.8965
.224
.0913
.023
.025
3.0
.423
.30
.8369
.251
.0355
.011
.030
3.6
.303
.35
.7648
.268
.035
4.2
.210
.40
.6826
.273
.040
4.8
.143
.45
.5931
.267
.045
5.4
.095
.50
.5000
.250
.050
6.0
.062
.55
.4069
.224
.055
6.6
.040
.60
.3174
.190
.65
.2352
.153
.70
.1631
.114
n = 5
n = 20
n = 120
1.00
.80
.40
.30
c.
n = 5
n = 20
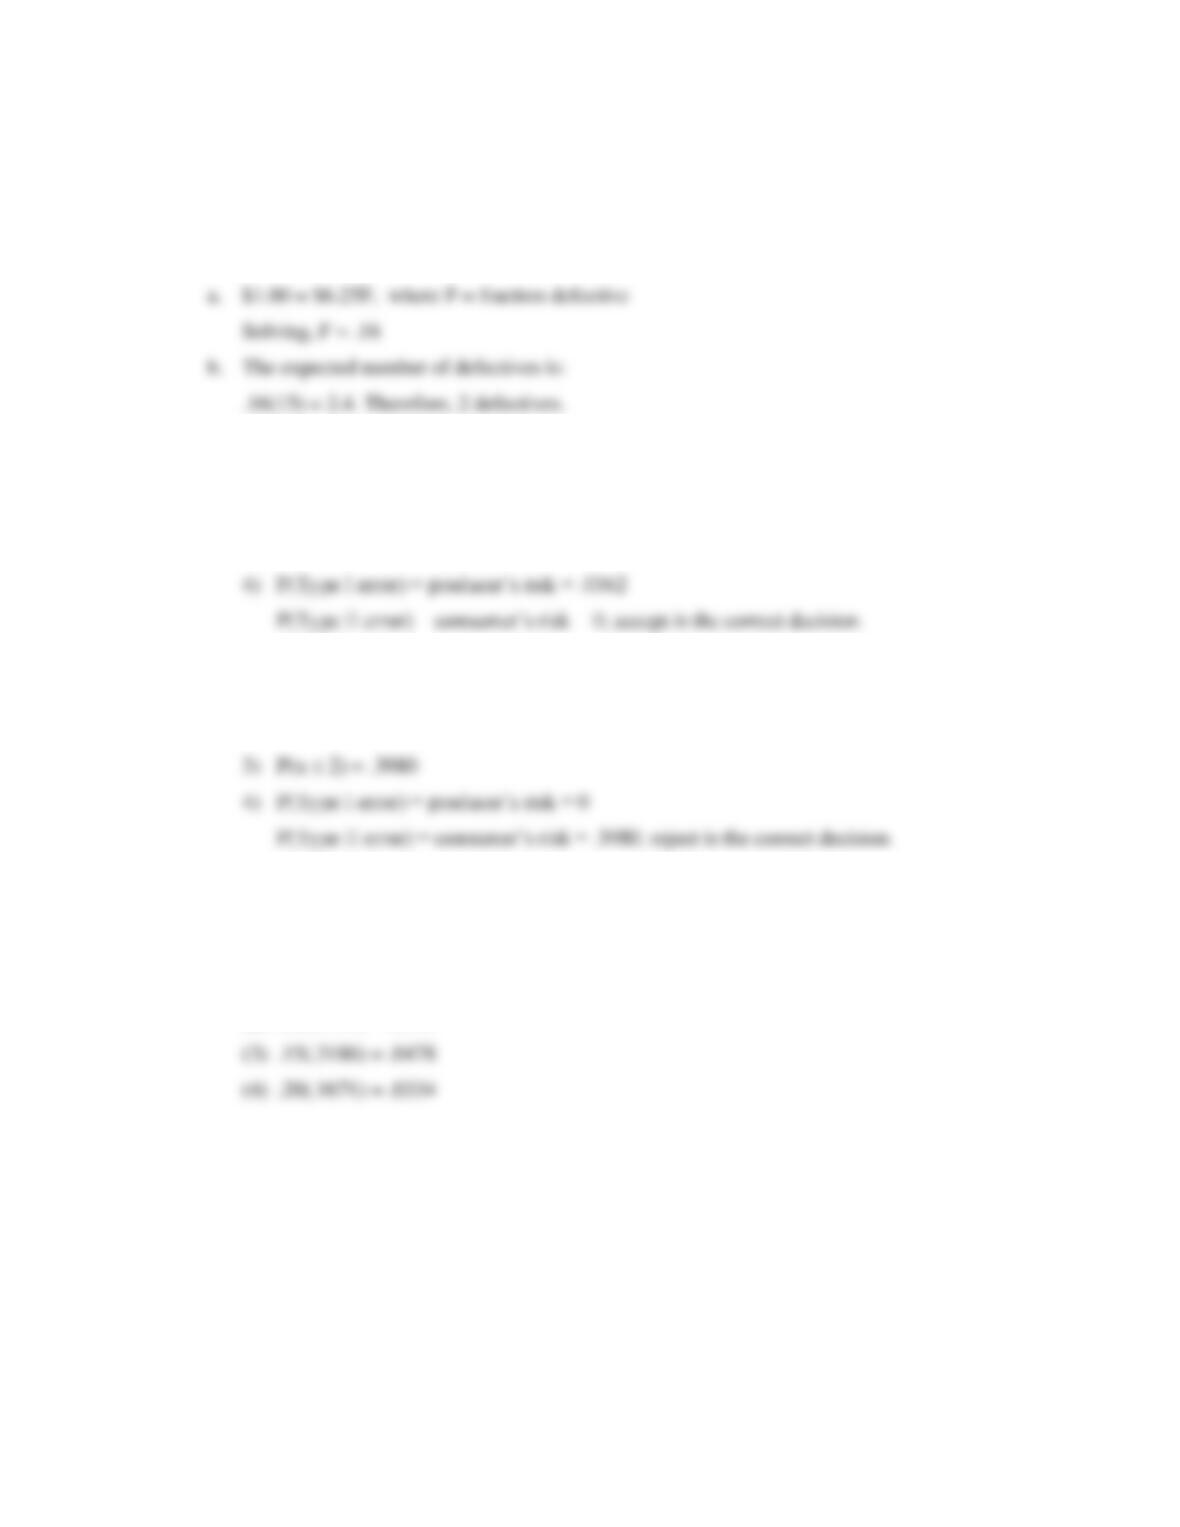
Chapter 10S – Acceptance Sampling
10S-6
5. n = 15 parts
replacement is $6.25/unit
inspection is $1/unit
c. If F = .05, with n = 15
1) Accept because probability is less than .16
2) 1 – .9638 = .0362
3) P(x 2) is .9638 [Appendix B, Table D]
d. If F = .20, with n = 15
1) Reject because probability exceeds .16
2) 1 – .3980 = .6020
6. a. Reject because there are 2 defectives in the sample and c = 1. A Type I error is possible.
b. Accept. A Type II error is possible.
c. [Assume a large lot size]
(1) .05(.8290) = .0415
(2) .10(.5490) = .0549