Page 16 of 29
3
0
4
424
6
5
236
3
6
128
0
7
0
0
8
126
2
9
324
3
11
0
12
128
3
18
126
1
19
234
2
20
246
3
21
120
1
22
0
23
112
1
24
237
3
25
129
2
26
1
27
0
Employee
Hours of
Overtime
Days
Absent
1
243
3
2
126
2
13
460
6
14
135
1
15
118
1
16
260
2
17
0
1
28
128
2
29
246
3
30
326
6
Days Absent
5
6
7
Hours of Overtime
Page 17 of 29
Multiple R
0.88224
3
Intercept
1.1839
7
0.2463
8
Square
0.77043
7
Error
0.84343
4
Residual
0.7113
8
Total
X Variable 1
5
9
9.
SUMMARY OUTPUT
Regression Statistics
R Square
0.77835
3
ANOVA
df
SS
MS
F
Significance
F
Regression
1
69.948
69.948
98.327
0
1.16E-10
Coefficie
nts
Standard
Error
t Stat
P-
value
Lower 95%
–
0.01350
9.9159
1.2E-
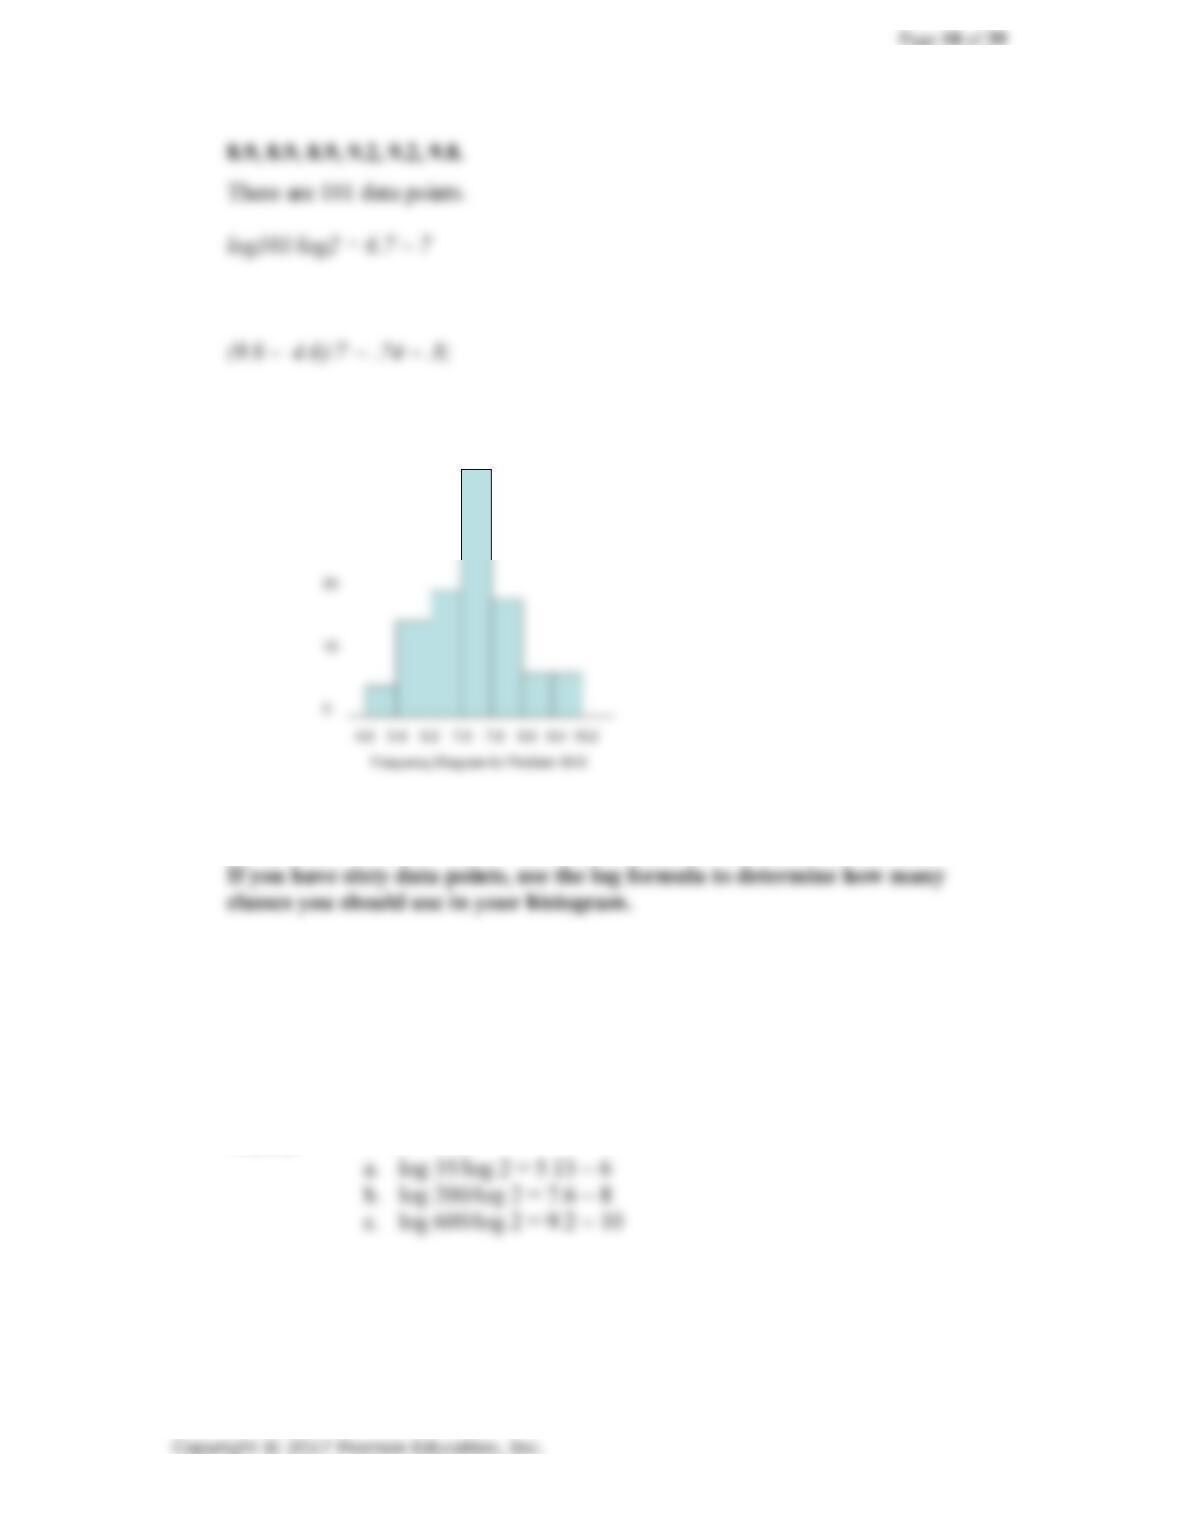
Develop a histogram using the following data:
6.5, 6.5, 6.5, 6.8, 6.8, 9.8, 9.8, 9.8, 9.8, 6.8, 6.8, 6.8, 6.8, 6.8, 6.8, 6.8, 6.8, 6.8, 6.8,
7.4, 7.4, 7.4, 7.7, 7.7, 7.7, 7.7, 7.7, 7.7, 7.7, 7.7, 7.7, 7.7, 7.7, 7.7, 7.7, 7.7, 7.7, 7.7,
10.
11.
The largest value is 9.8, the smallest value is 4.6.
Therefore, use the following classes in the frequency histogram below.
The data appear approximately normal.
log 60/log 2 = 5.9 ~ 6 classes. Remember, it is common practice to round upwards.
Use the logarithmic formula in the chapter to determine how may classes you
should use in your histogram for the following numbers of data:
a. 35
b. 200
c. 600
Answer:
40
30
12.
13.
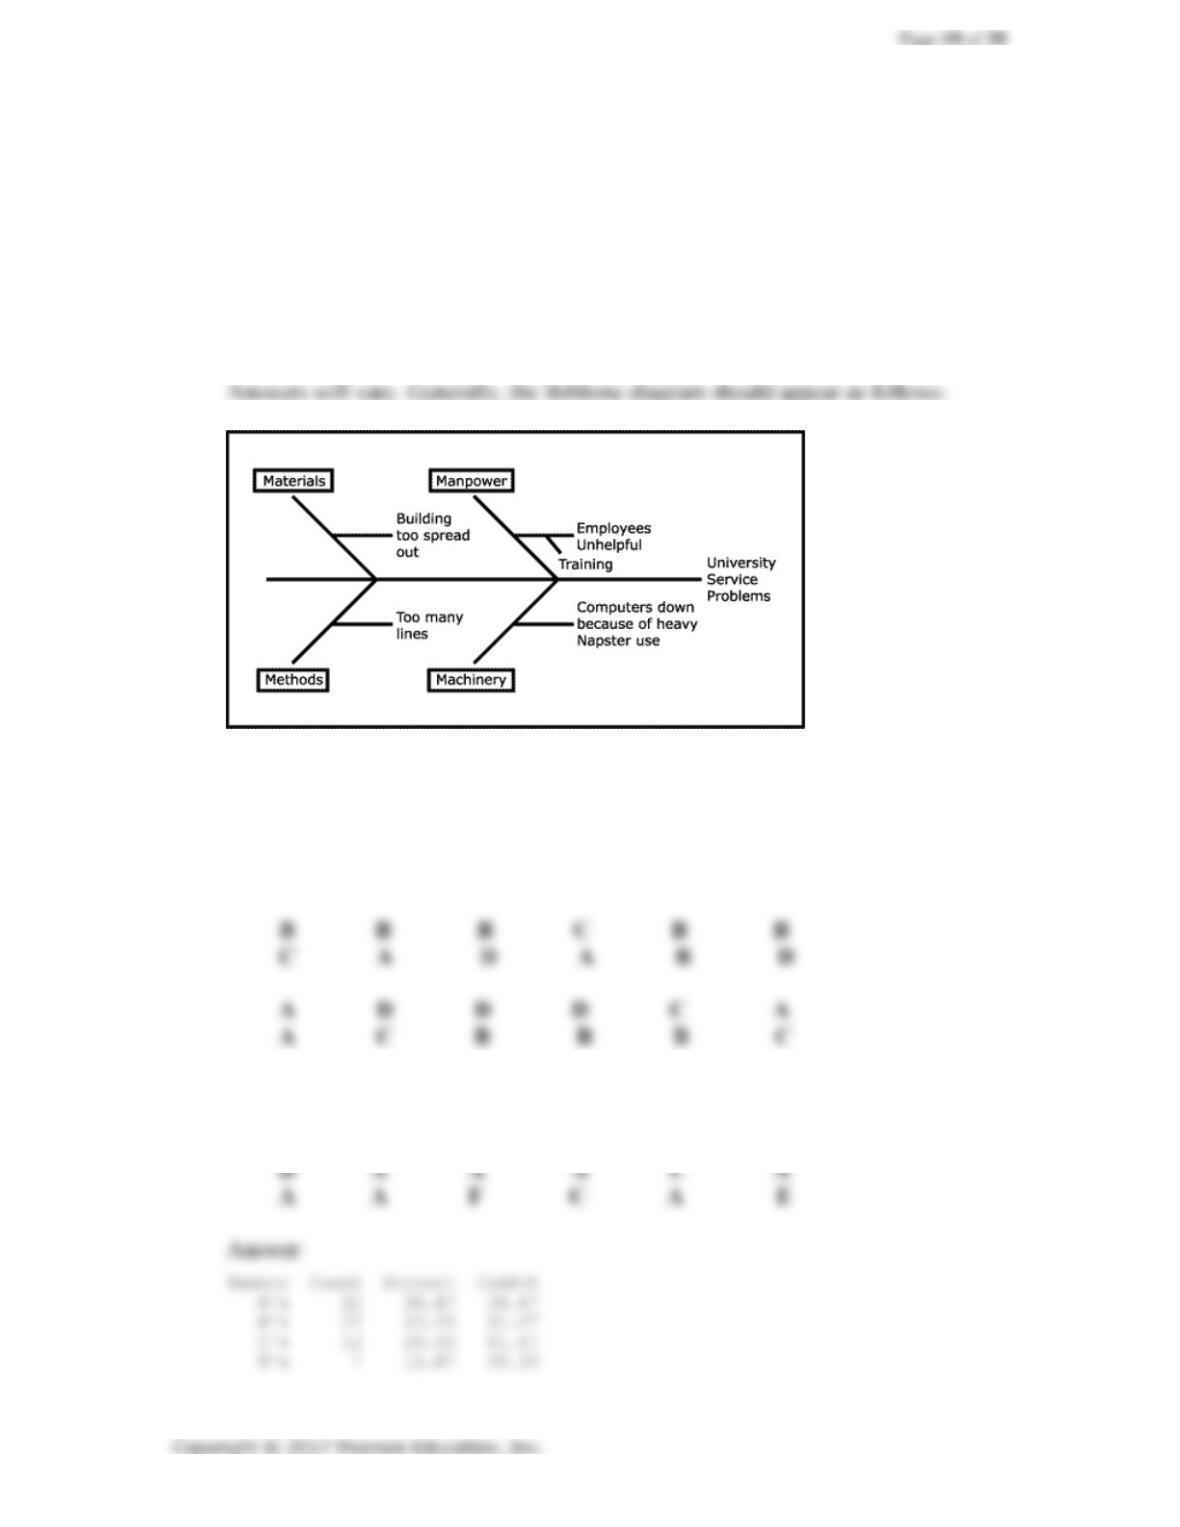
Think about the following questions, and develop fishbone diagrams for each
of them:
a. What is the major service problem in your university?
b. What is the major thing that interferes with your study?
c. What is the major problem with your school newspaper?
d. What is the major social problem in society?
For the following data, develop a Pareto analysis. The letters A, B, C, D, E, and
F are problems that occur in a process. Which cause should you focus on first?
A A A B A A
B C C E D A
C B C A B C
A B E A A B
Page 20 of 29
14.
If you eliminate causes A and B, defect will be reduced by 60%.
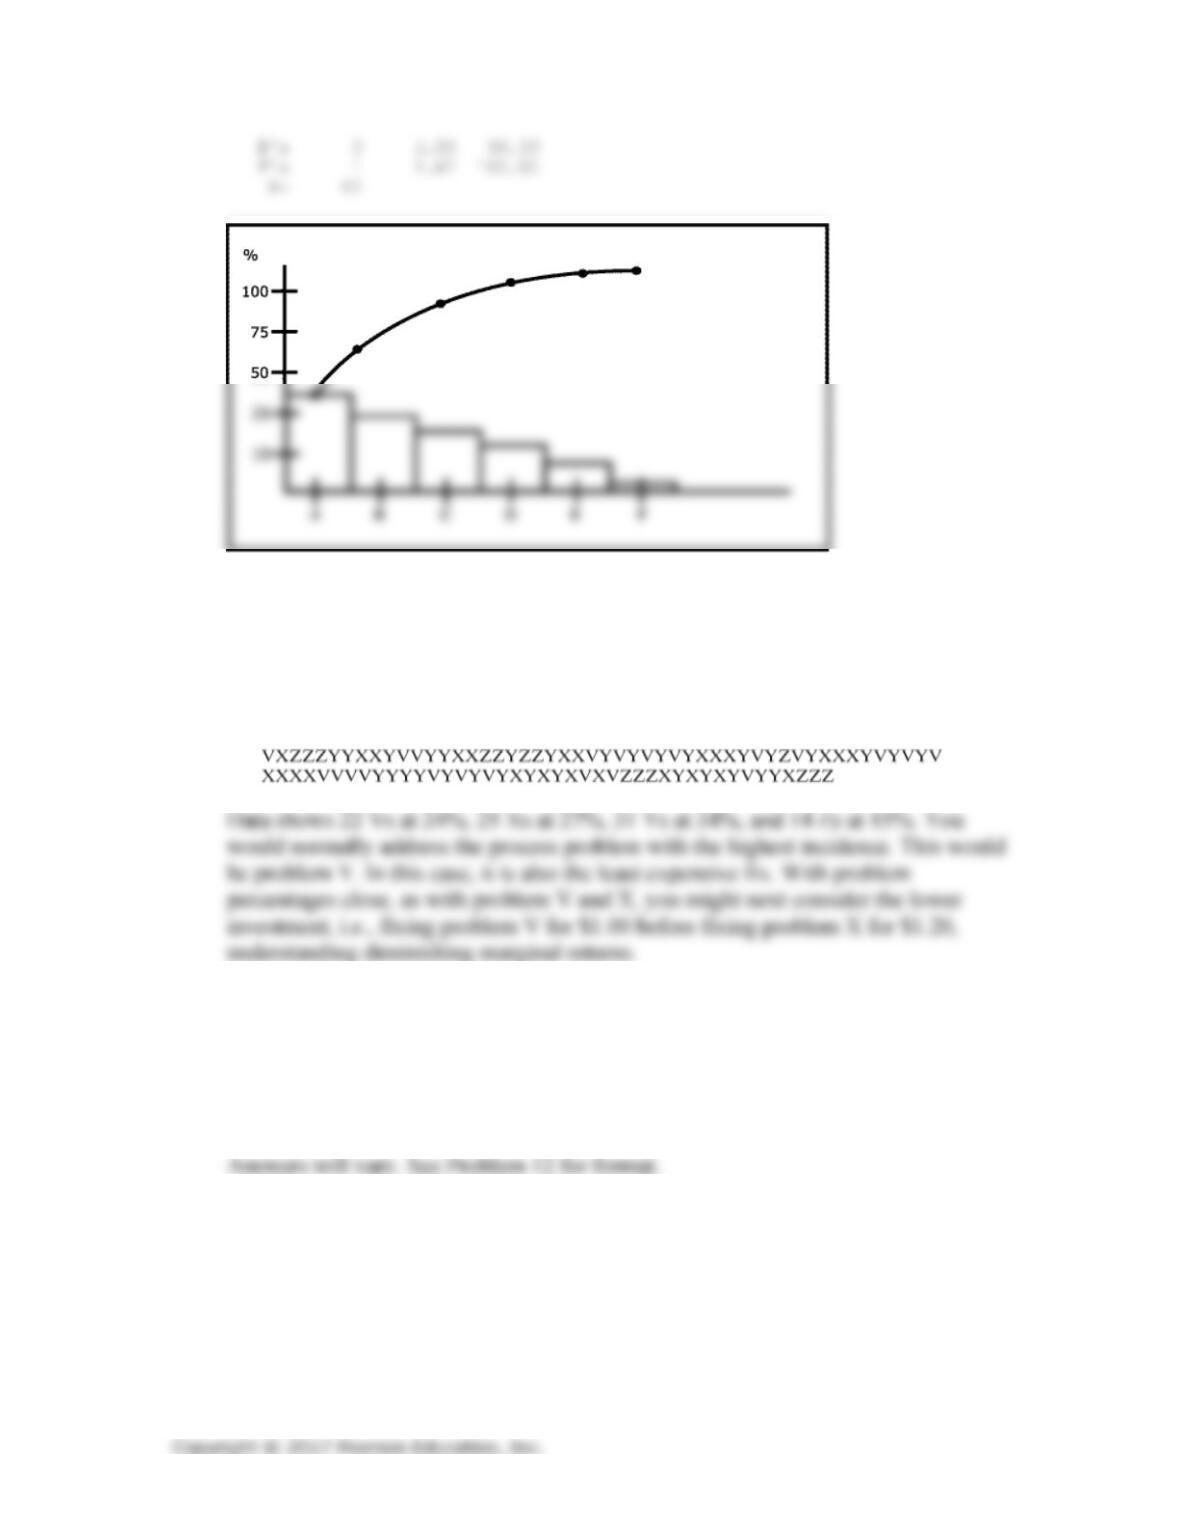
For the following data, develop a Pareto chart. The letters V, X, Y, and Z are
problems that occur in a process. Which cause should you address first if the
fixes for the problems are $1.00, $1.20, $.90, and $2.00 successively?
15.
Either alone or as a team, draw a fishbone diagram about the following topics:
a. What are the causes of poor grades?
b. Why do college students drink too much?
c. Why do I not have enough money?
d. What are the causes of poor response times on the Internet?
16.
Quality is Personal by Roberts and Sergesketter is a popular book. In it they
recommend using the basic tools of quality in our personal lives. Develop a
check sheet to keep track of personal defects you have in your life (such as
sleeping too late, being too grumpy, and so on). Use this check sheet for two
weeks to track these personal defects. After two weeks, perform a Pareto
analysis to determine where you have the greatest need for improvement.
Page 21 of 29
Next, use the fishbone diagram to identify the underlying causes of the
personal defects. After making changes, use a control chart to track your
defects.
Answers will vary.
17.
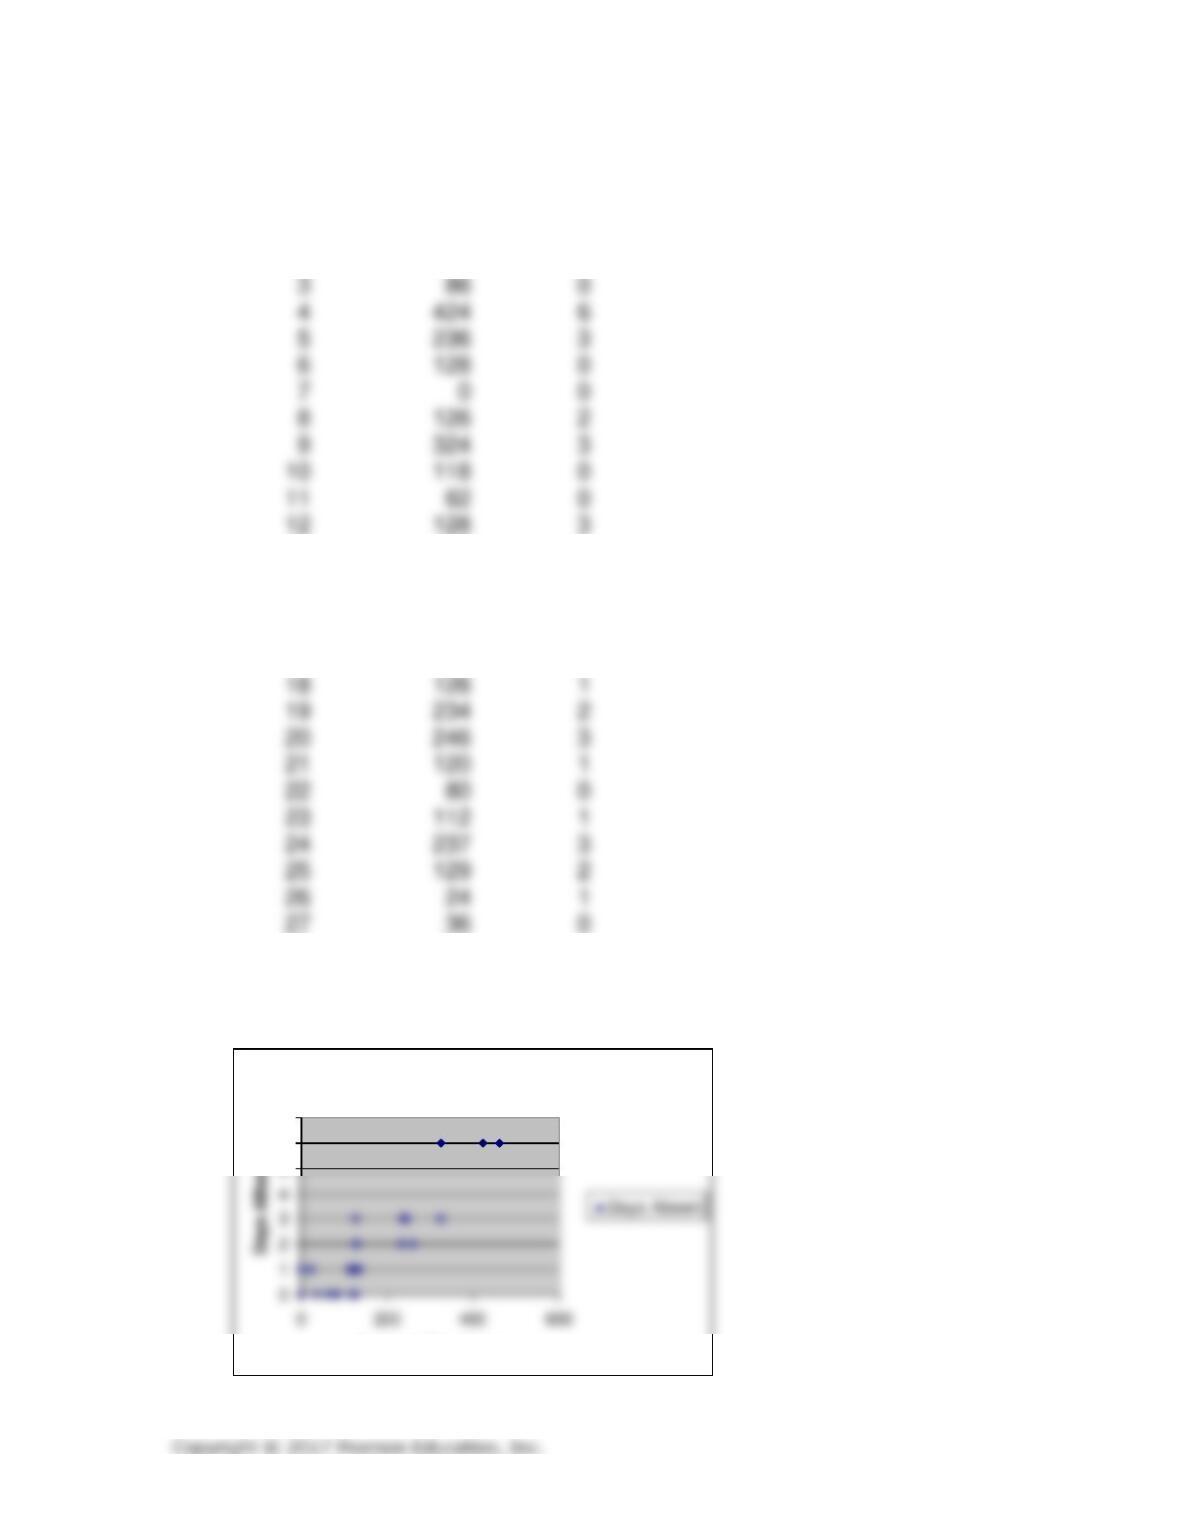
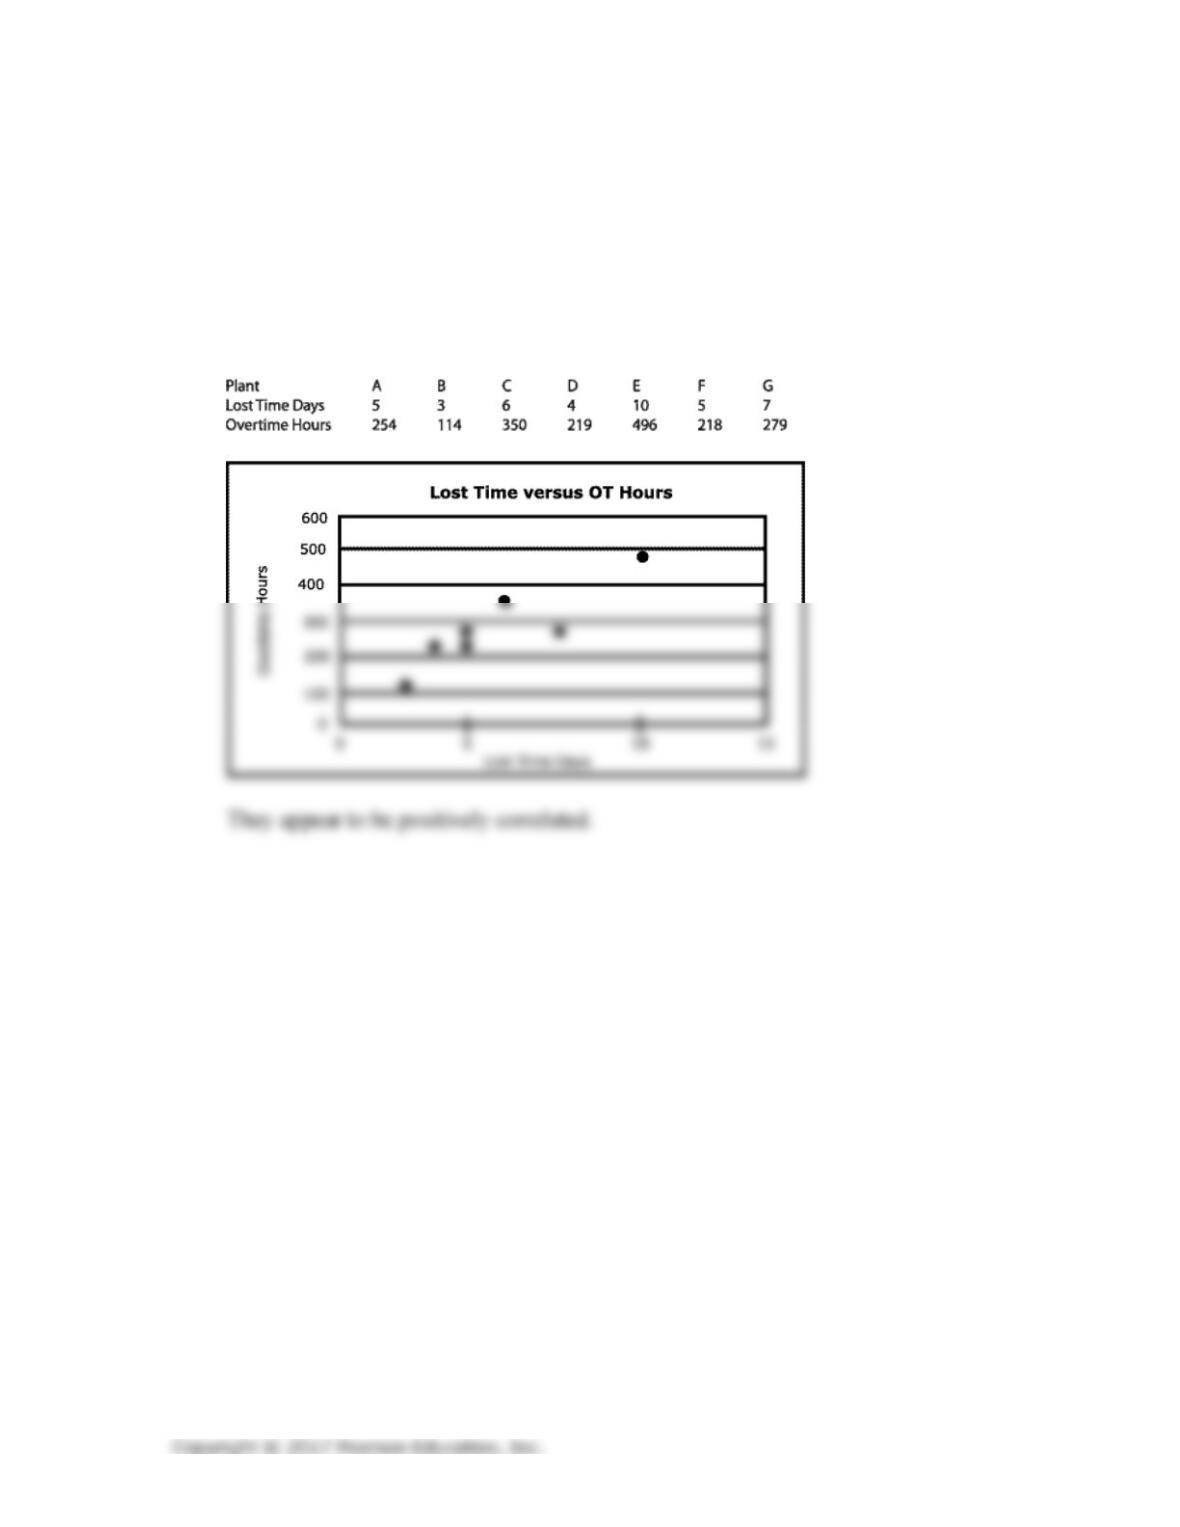
For the following data, draw a scatter diagram to see if time lost because of
injuries and overtime hours are related? What do you conclude?

18.
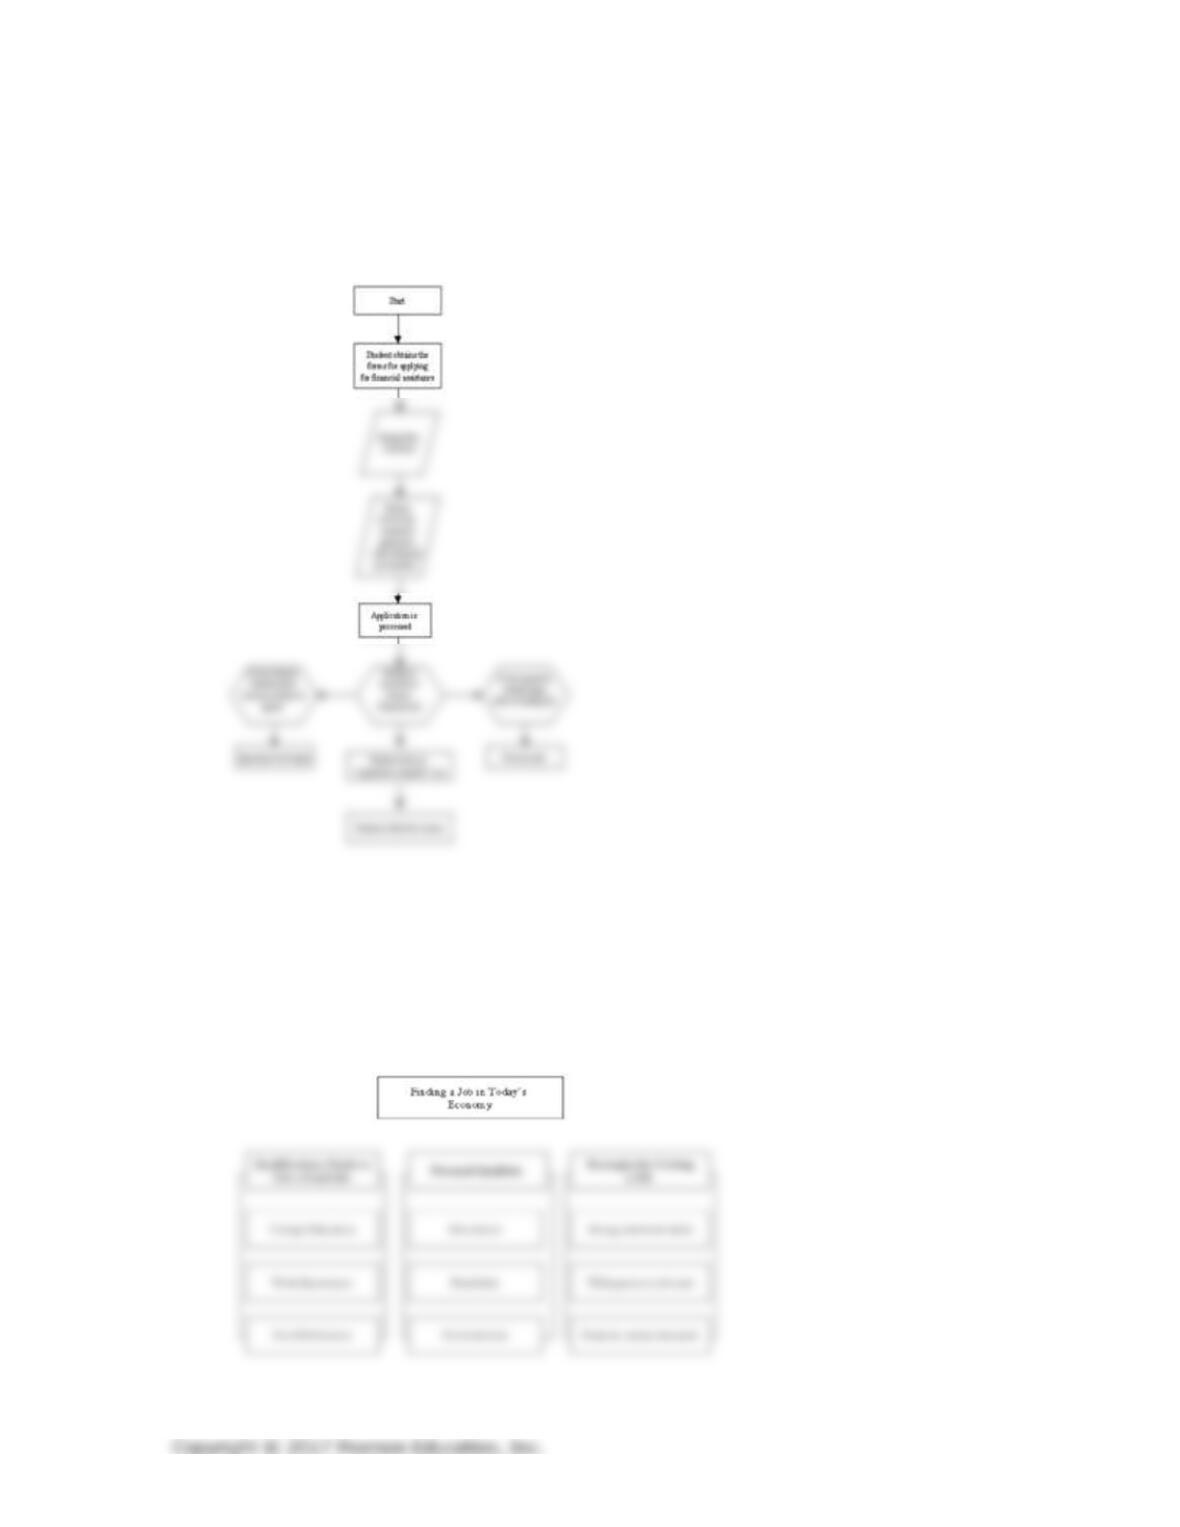
Develop a process map for the registration process at your university. Analyze
the number of value-added and nonvalue-added steps.
Answers will vary for this question. Below is an example of a process map for
registration at a large public university.
Page 23 of 29
19. Develop a process map for receiving financial aid at your university.
Analyze the process and develop a proposal for improvement.
Answers will vary for this question. Below is an example of a process map of the
process of receiving financial assistance at a large public university.
20.
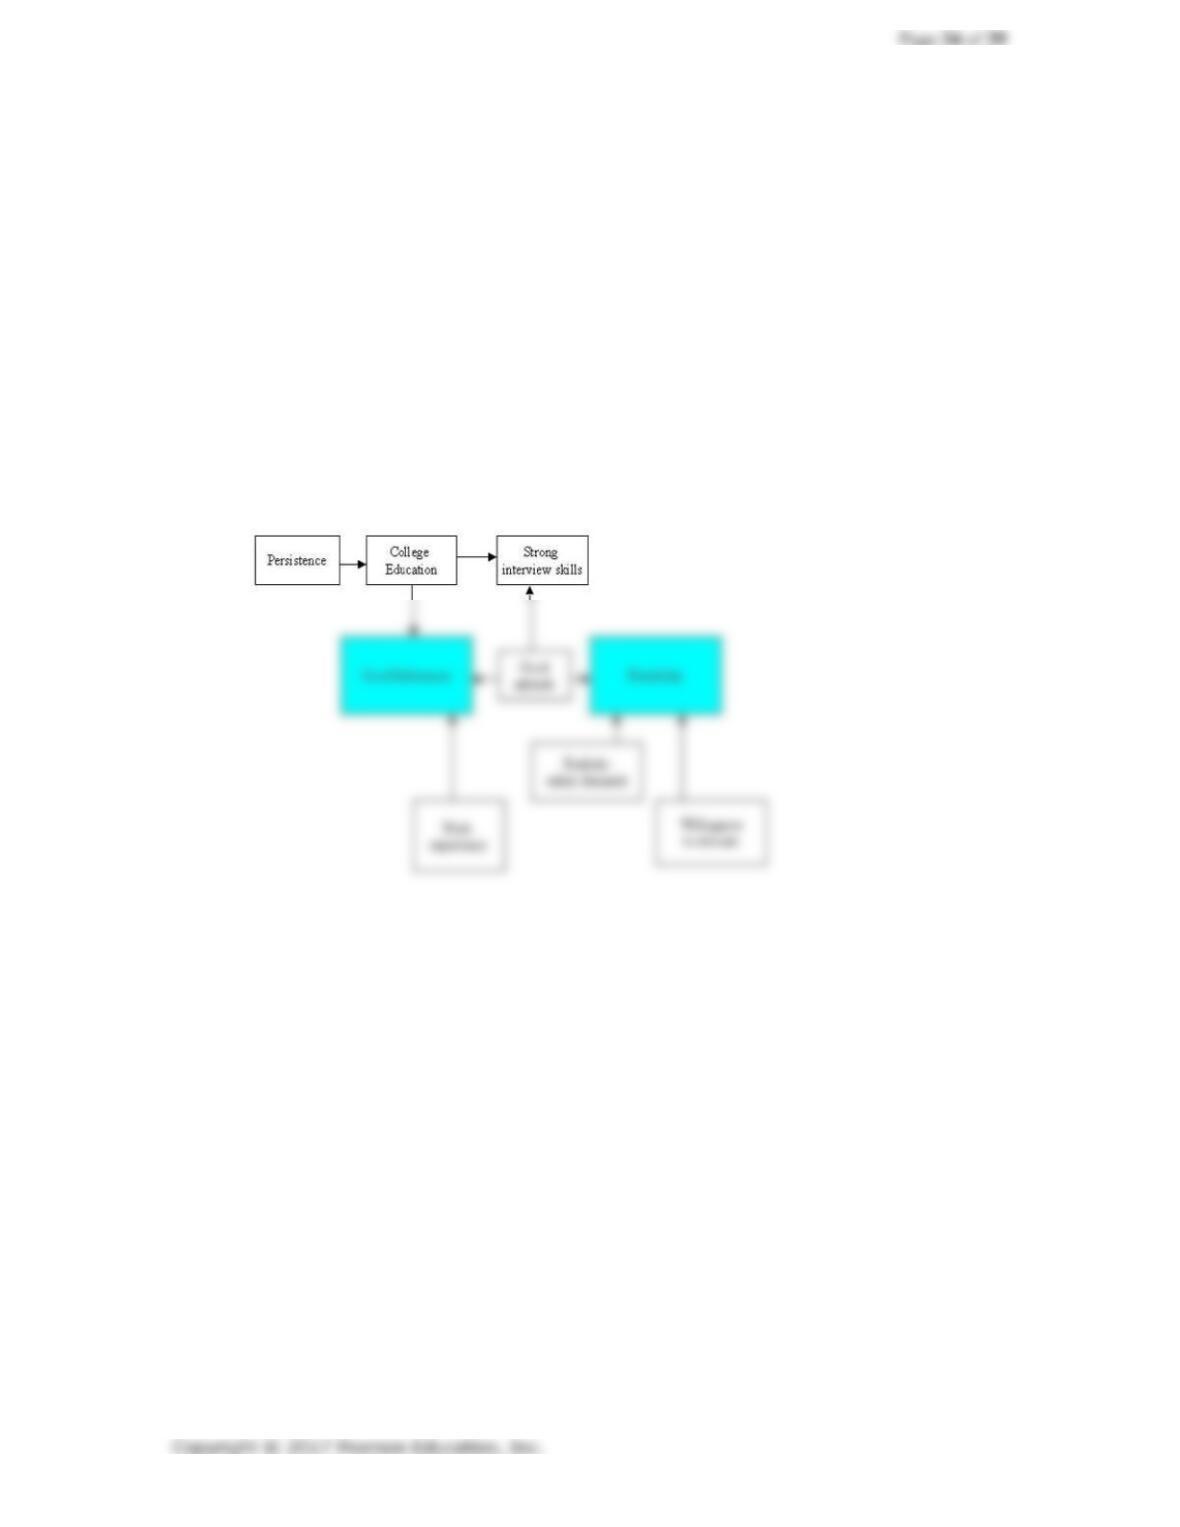
With a team of students, develop an affinity diagram relating to the following
statement, “What are issues relating to finding a job in the current economy?”
What did you find?
Answers will vary. Below is an example of an affinity diagram that relates to
finding a job in the current economy.
21.
22.
Form a team and develop an affinity diagram for the following problem
statement: What are issues associated with completing a university or college
degree in a reasonable amount of time?
This is an issue that affects many students. Use the format in Problem 20.
Using the affinity diagram from Problem 21, develop an interrelationship
digraph for the job search. What did you generalize from the interrelationship
digraph?
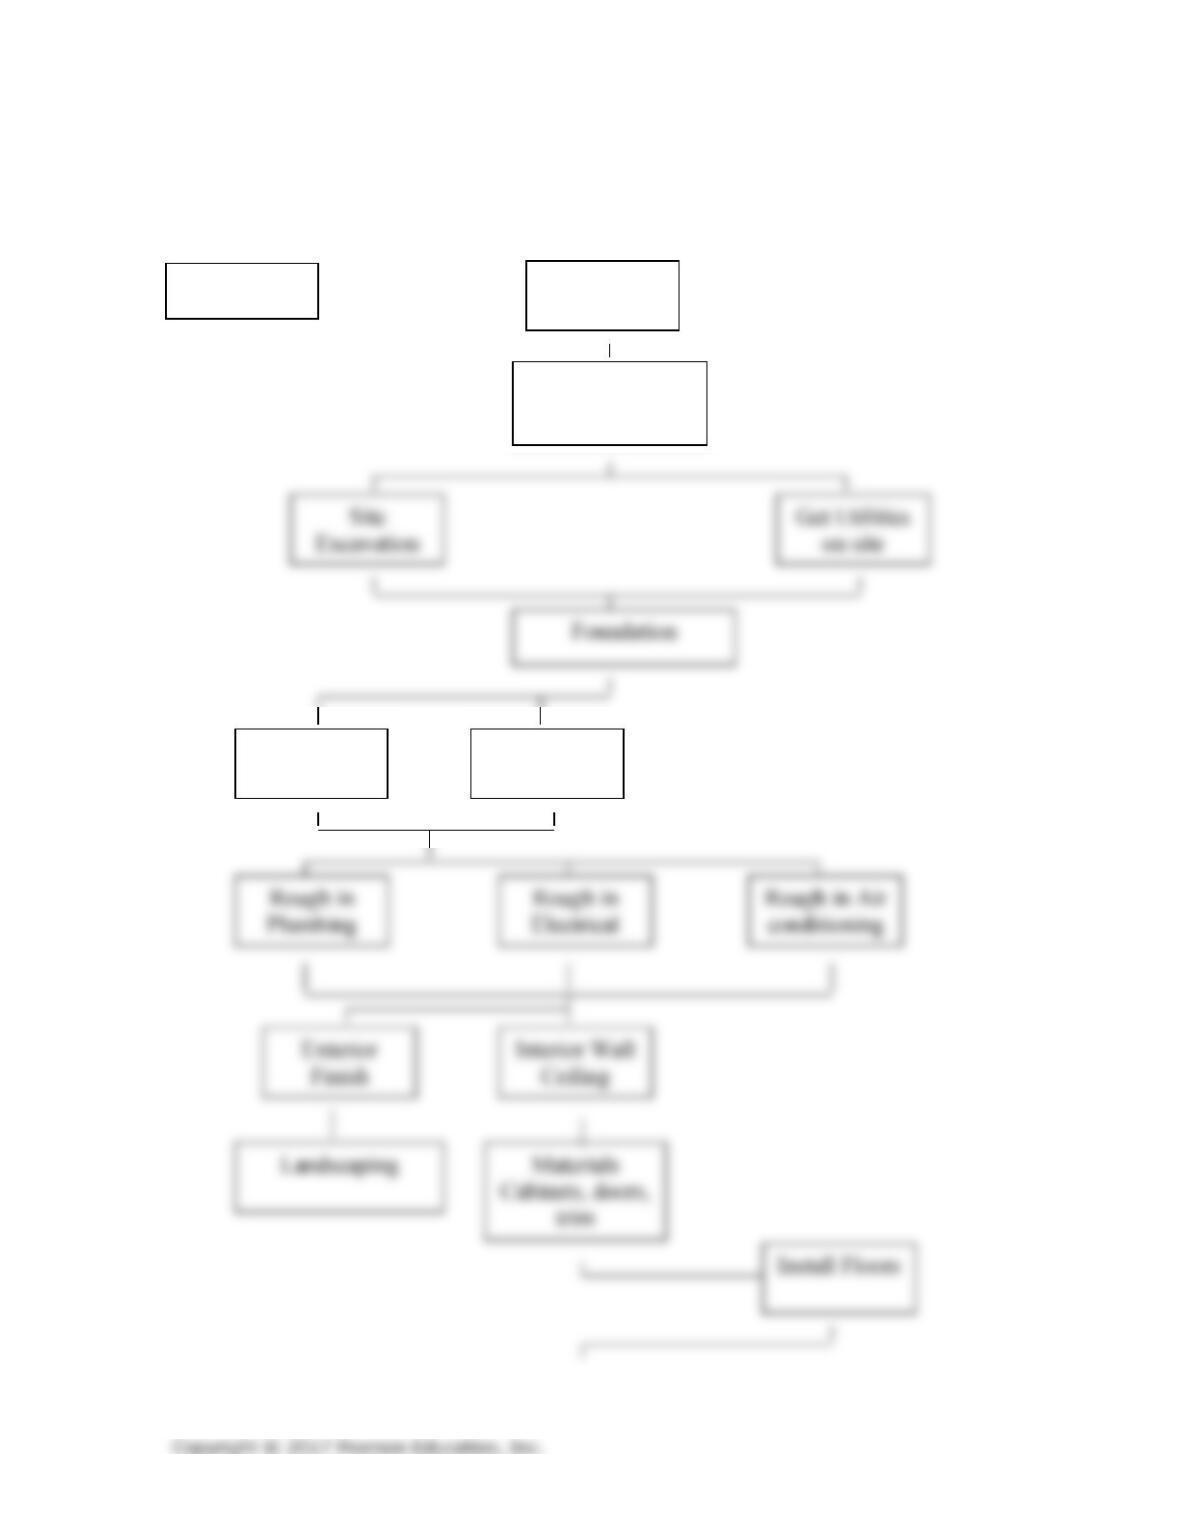
Answers will vary. One approach, based on Problem 20’s affinity diagram above, is
shown below.
Page 25 of 29
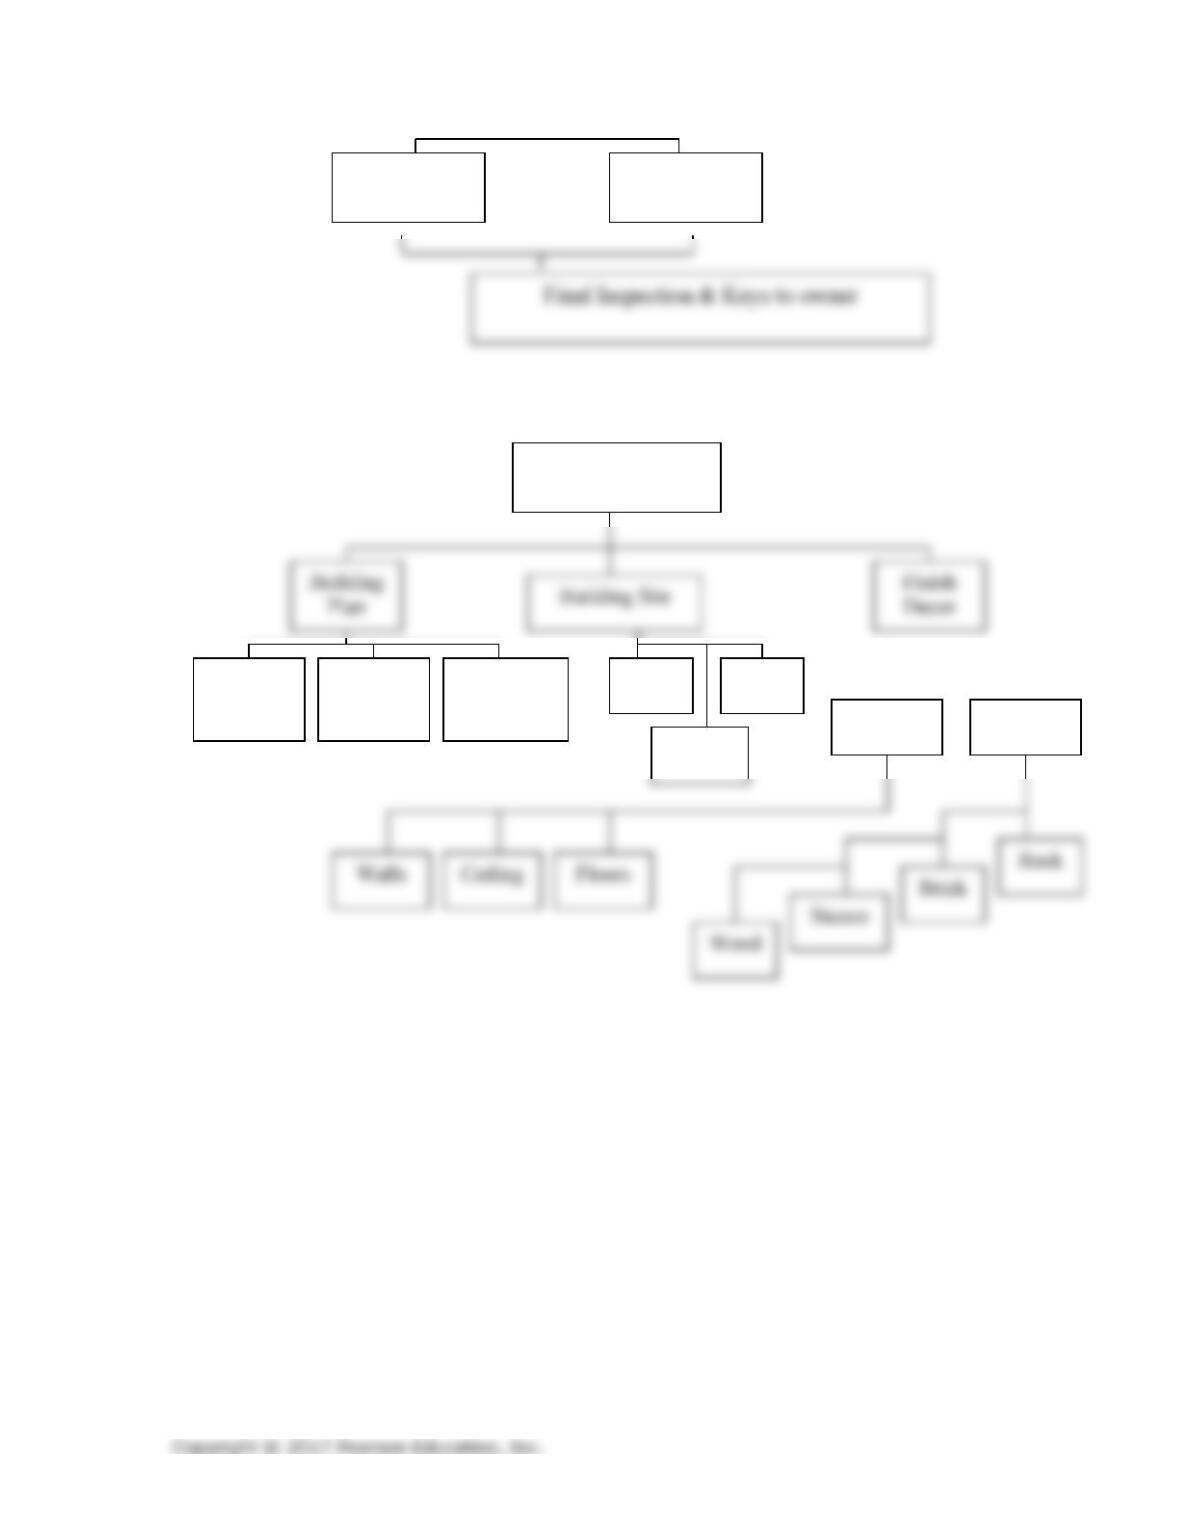
23. Develop a tree diagram for building a home.
A tree diagram could be developed for either decisions or tasks. Student solutions could
include a lot of detail or be brief. Some samples follow.
on site
Landscaping
Finish
Select
Location
Develop Building
Plan
Rough
Framing
Utilities to
House
Task Tree
Page 26 of 29
Decision Tree for Building a House
Brick
Ceiling
Plumbing
Finish
Electrical
Finish
General Style &
Size
#
Bedroom
& Bath
Living
Areas
Garage
how many
cars
Trees
Size
Terrain
Interior
Exterior
Page 27 of 29
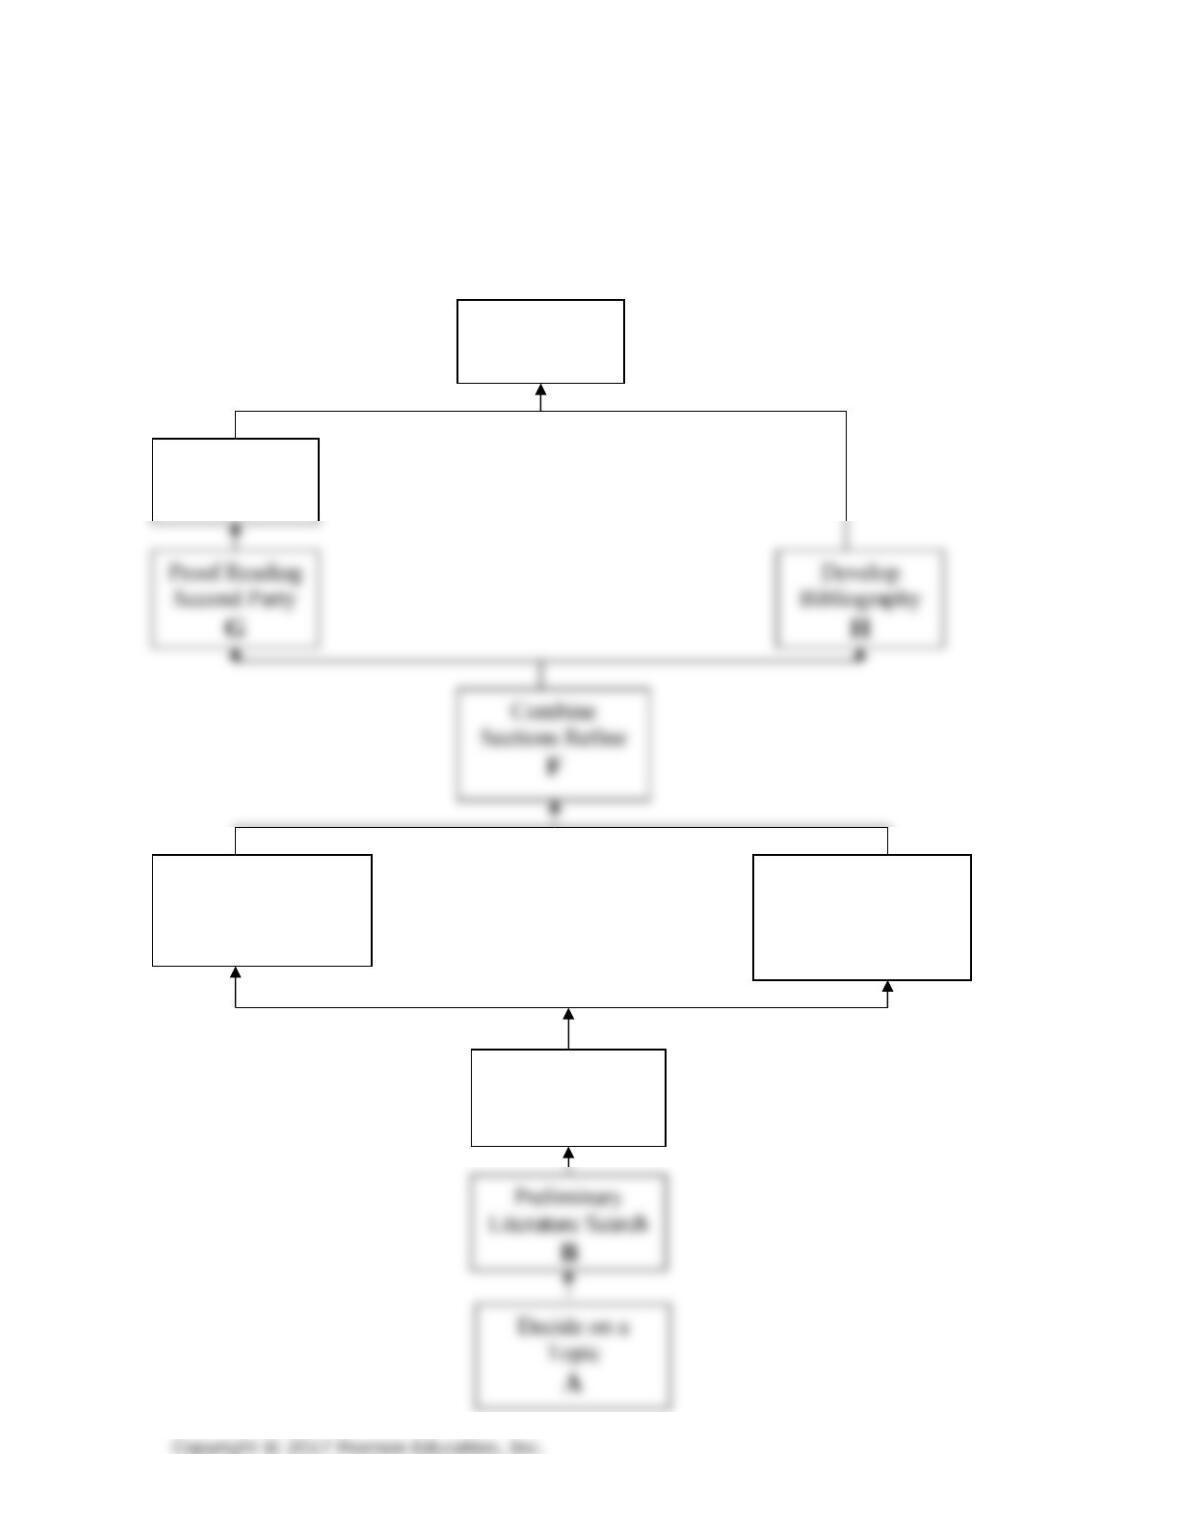
24. Develop a tree diagram for writing a major research paper. Now, take the
steps you identified for this project and develop an activity network diagram.
An example of a tree diagram flowing from bottom to top, with activity network diagram
node letters and arrows added:
Submit Papers
J
Corrections
I
Continue
Organization &
Write Sections
E
Preliminary
Outline
C
Detail Literature
Search
D

Page 28 of 29
25. Complete the analysis for the prioritization matrix information in the text by
finding the final rankings:
For this problem, the smaller result is the best.
Final Priority Vector by Machine
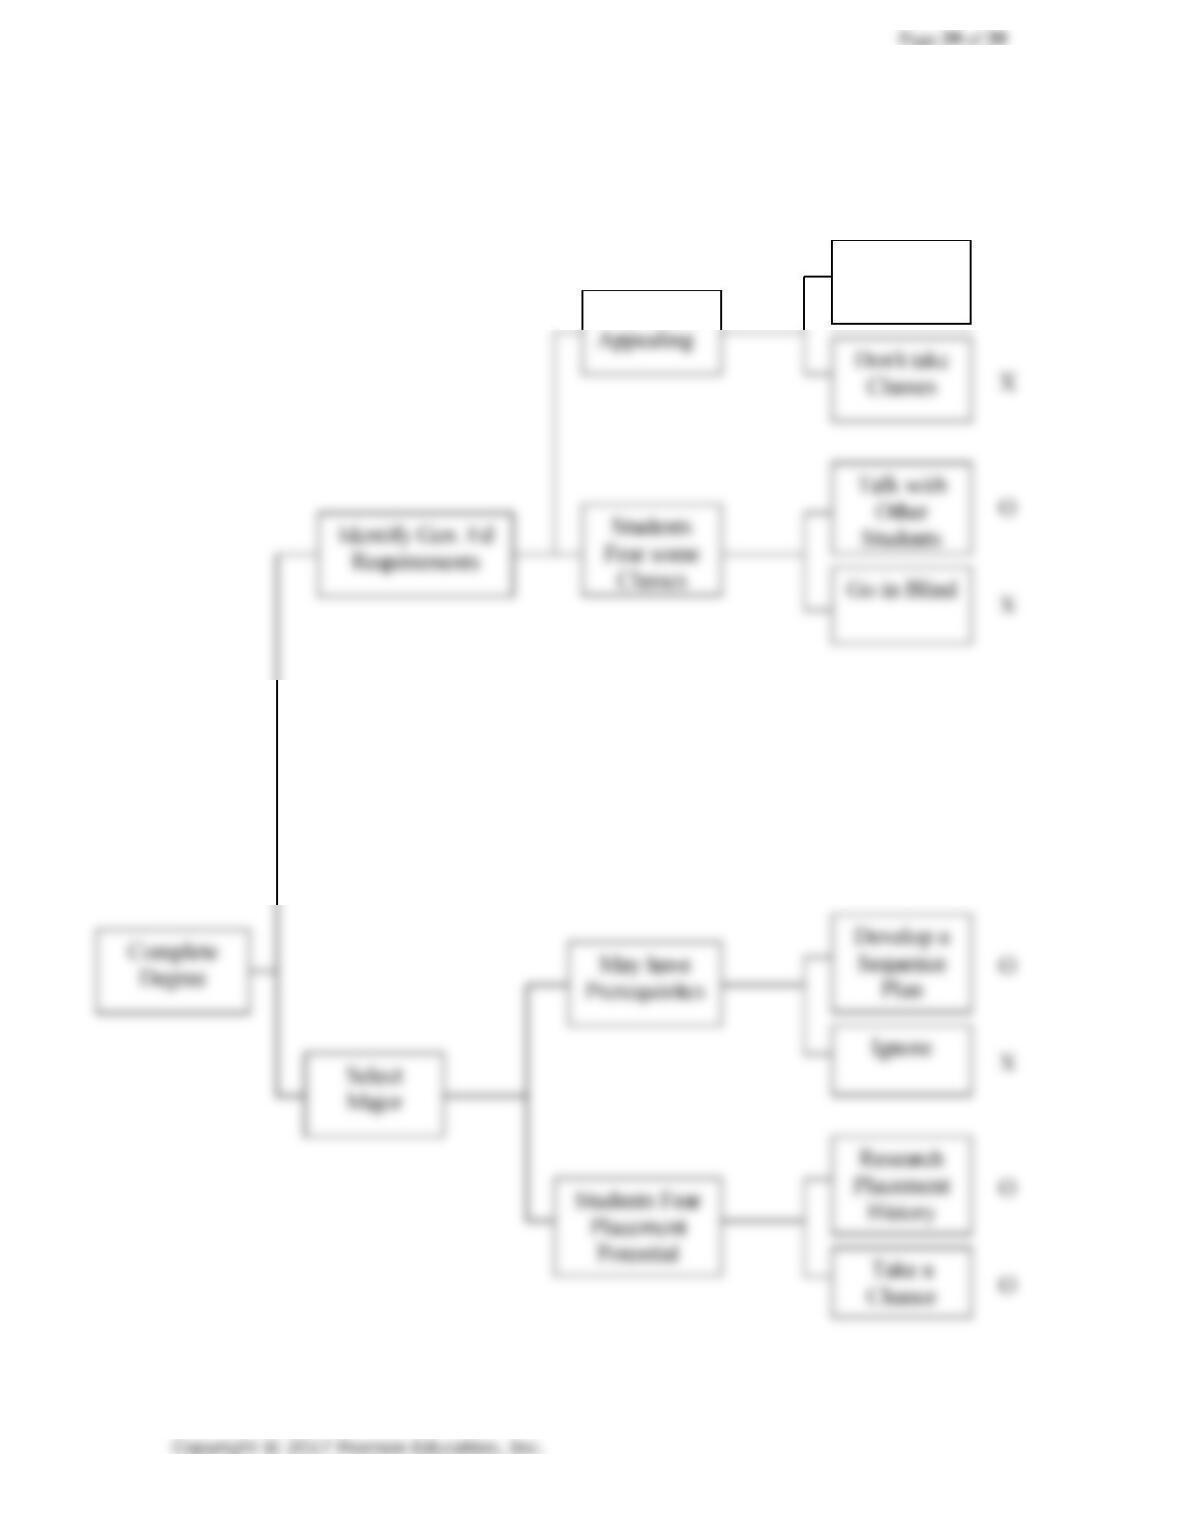
26. Develop a process decision chart for completing your college degree.
One of many potential solutions is presented below.
O
X
X
O
O
X
O
Recognize
Benefit
May not be
O