67
68
69
70
71
82
83
84
85
86
87
88
89
90
91
92
93
94
95
96
97
98
99
100
72
73
74
75
76
77
78
79
80
81
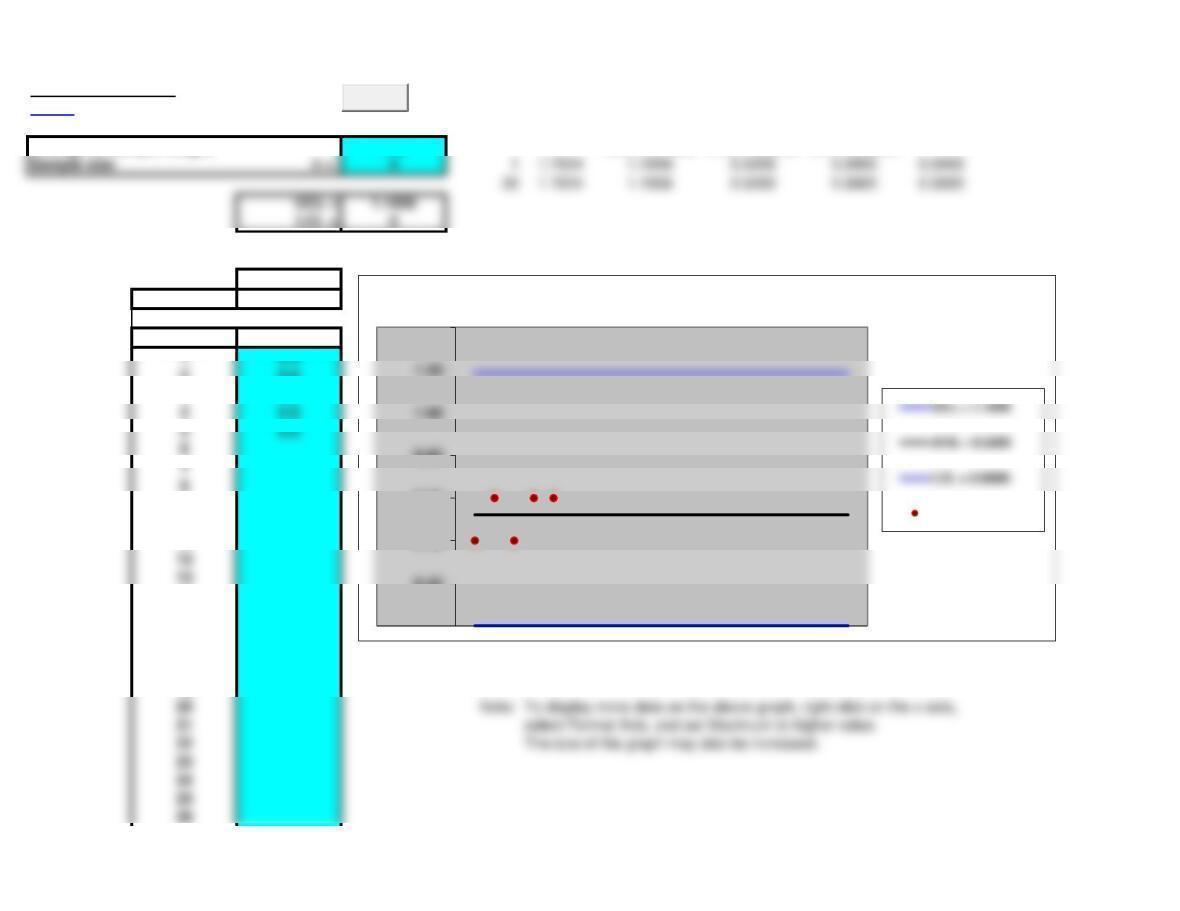
p-Chart
<Back
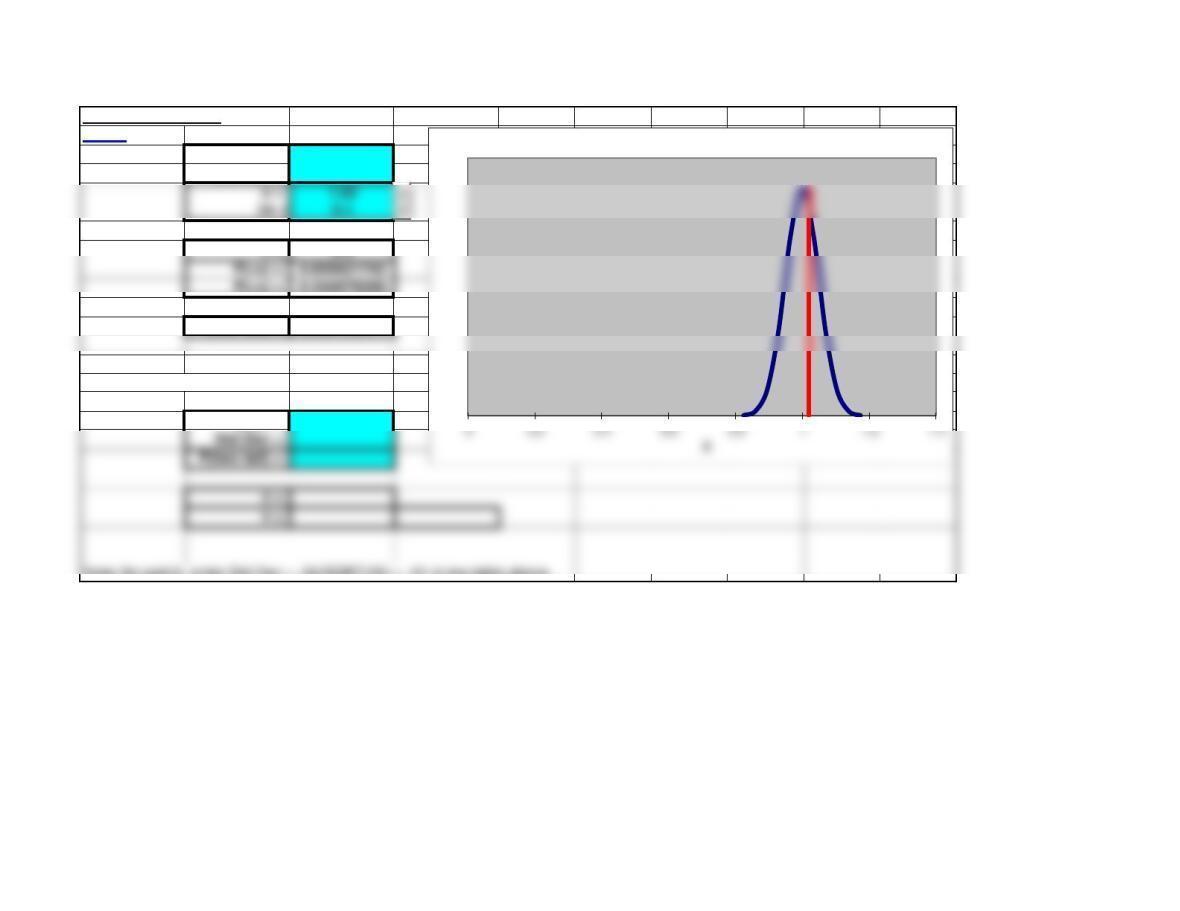
Average proportion 0.11 UCL = 0.2039 AVE = 0.1100 LCL = 0.0161
Sample size n = 100 10.235156 0.2039 0.1100 0.0161 0
Calculations:
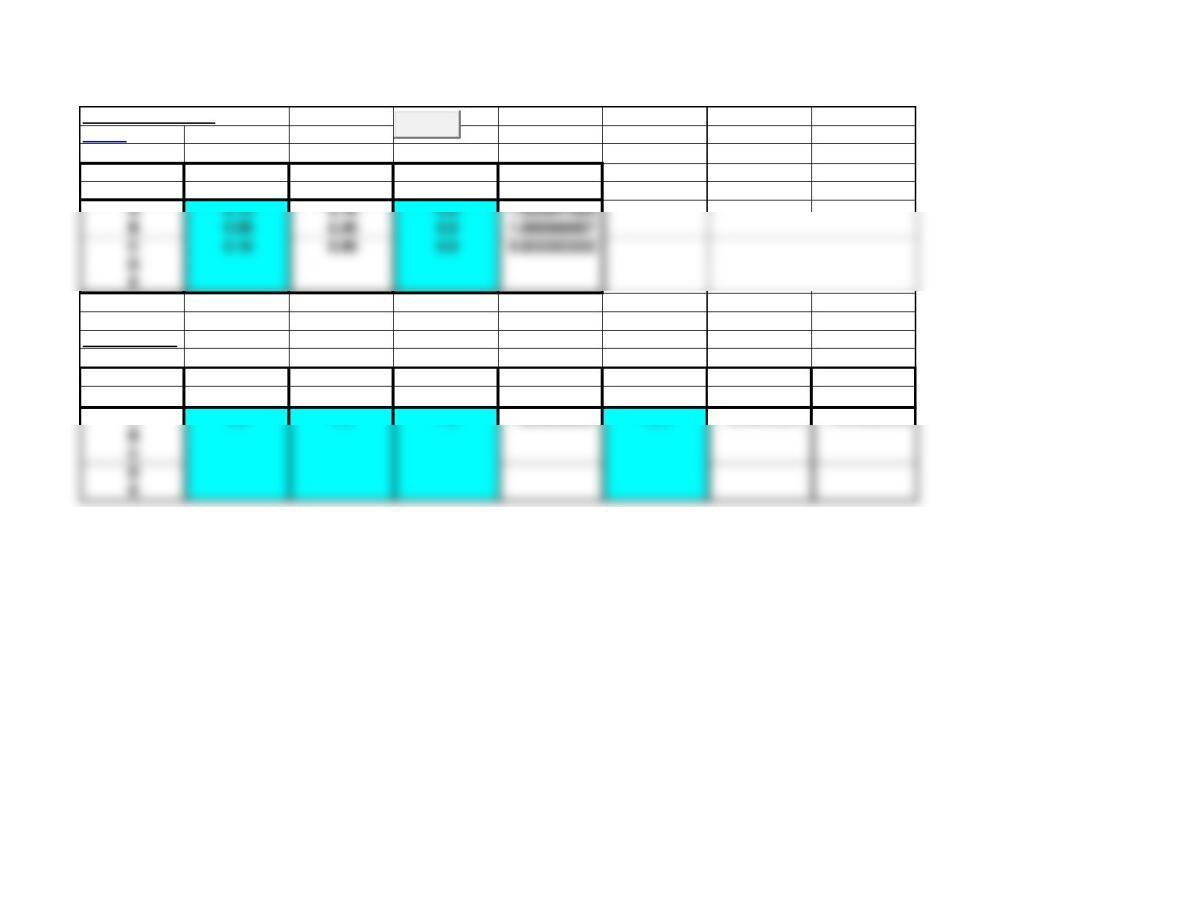
p
Average 0.11
Sample p
10.07
20.1
30.12
40.04
50.09
60.11
70.1
80.18
90.13
10 0.1
11 0.08
12 0.12
13 0.09
14 0.1
15 0.16
16 0.1
17 0.08
18 0.12
19 0.1
20 0.21
21 Note: To display more data on the above graph, right click on the x-axis,
24
0.05
0.10
0.15
0.20
0.25
p-Chart
UCL = 0.2039
AVE = 0.1100
LCL = 0.0161
Clear

35
36
37
38
39
40
41
42
43
44
45
46
47
48
49
50
51
52
53
54
55
57
58
59
60
61
62
63
64
25
26
27
28
29
30
31
32
33
34
65
66
67
68
69
80
81
82
83
84
85
86
87
88
89
90
91
92
93
94
95
96
97
98
99
100
70
71
72
73
74
75
76
77
78
79
<Back
UCL = 7.2434 AVE = 2.5000 LCL = 0.0000
Average defects/unit 2.5 18.824555 7.2434 2.5000 0.0000 0
z = 3 20 8.824555 7.2434 2.5000 0.0000 0
LCL = 0
Calculations:
c
Average 2.5
Sample c
1 3
2 2
3 4
4 5
5 1
6 2
7 4
8 1
9 2
10 1
11 3
12 4
13 2
14 4
15 2
16 1
17 3
18 1Note: To display more data on the above graph, right click on the x-axis,
21
0.00
1.00
3.00
4.00
5.00
8.00
9.00
10.00
0 5 10 15 20
c-Chart
LCL = 0.0000
Sample c’s
22
23
24
25
26
27
28
29
30
41
42
43
44
45
46
47
48
49
50
51
52
53
54
55
56
57
58
31
32
33
34
35
36
37
38
39
40

59
60
71
72
73
74
75
76
77
78
79
80
81
82
83
84
85
86
87
88
89
90
91
92
93
94
95
61
62
63
64
65
66
67
68
69
70

96
97
98
99
100
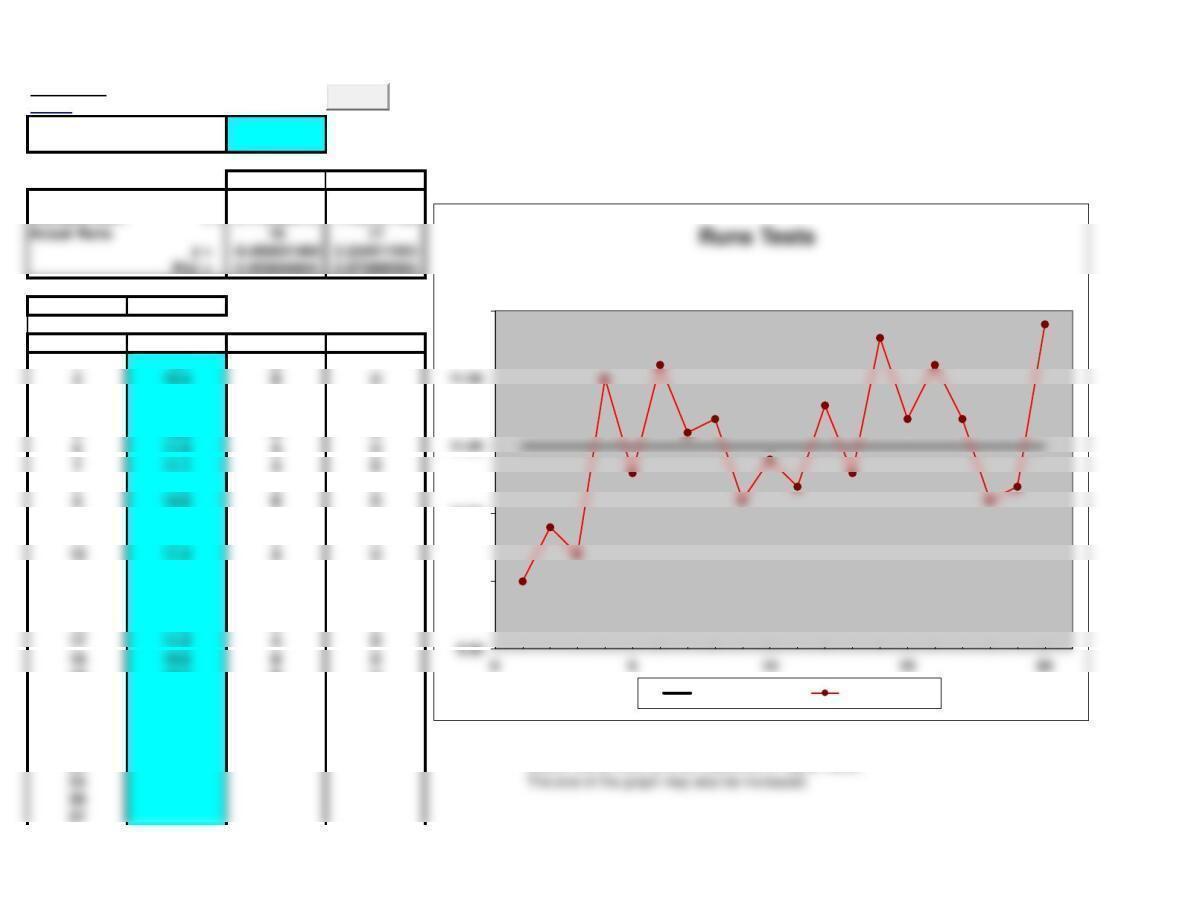
Runs Tests
<Back
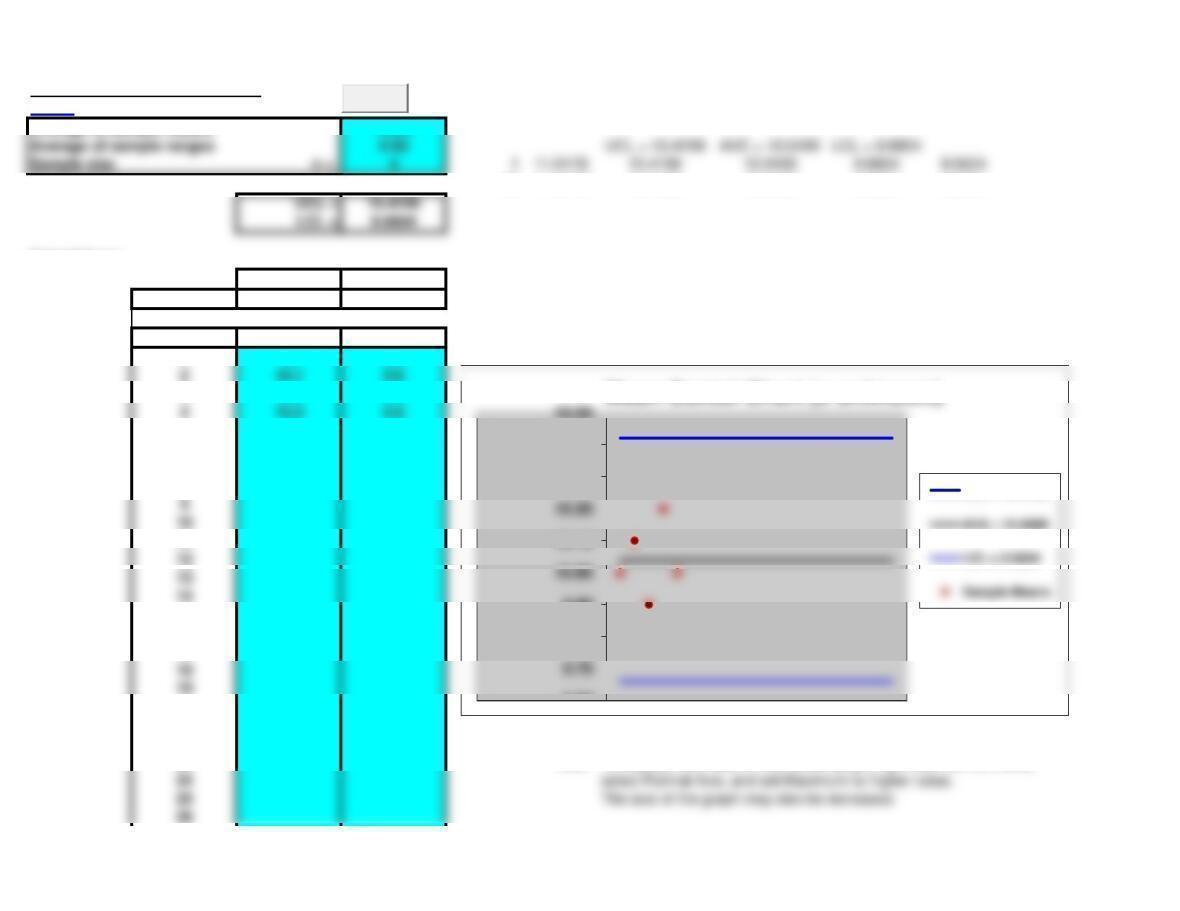
Number of observations 20
Median 11 Median = 11.0000
111.0000
Median U/D 20 11.0000
Expected runs E(r) = 11 13
Standard Deviatio
s = 2.179449472 1.798147195
Median 11
Sample Mean A/B U/D
110 B
210.4 B U
310.2 B D
411.5 A U
510.8 B D
611.6 A U
711.1 A D
811.2 A U
910.6 B D
10 10.9 B U
11 10.7 B D
12 11.3 A U
13 10.8 B D
14 11.8 A U
15 11.2 A D
16 11.6 A U
17 11.2 A D
18 10.6 B D
19 10.7 B U
20 11.9 A U
21
22
23 Note: To display more data on the above graph, right click on the x-axis,
24 select Format Axis, and set Maximum to higher value.
25 The size of the graph may also be increased.
26
27
10.00
10.50
12.00
Median = 11.0000 Sample Means
Clear
Actual Runs 10 17
35
36
37
38
39
40
41
42
43
44
45
46
47
48
49
50
51
52
53
54
55
56
57
58
59
60
61
62
63
64
65
66
67
68
69
28
29
30
31
32
33
34
80
81
82
83
84
85
86
87
88
89
90
91
92
93
94
95
96
97
98
99
100
70
71
72
73
74
75
76
77
78
79
Example 7,8,9
Process Capability
<Back
Standard Process Specification
Process Deviation Capability Width Cp
Non centered
Process Standard Lower Upper
Process Mean Deviation Specification Index Specification Index
Cpk
A9.2 0.3 7.5 1.888888889 10.5 1.444444444 1.444444444
Clear
Page 52
Solved Problem 1
Normal Distribution
<Back
Mean = 1
Std Dev = 0.05 0.825 0.017454
0.93 2.994549
z = 0.4 0.965 6.245079
1.07 2.994549
P(two tail) = 0.689156517 1.105 0.879672
1.175 0.017454
Normal Inverse 1.02 0
1.02 7.978846
Mean =
Std Dev =
P(two tail) =
z =
x =
Note: for part b, enter Std Dev = .05/SQRT(25) = .01 in top table above.
Page 53
Mean Control Chart (s unknown)
<Back
Average of sample means 10.04
20 11.0176 10.4196 10.0400 9.6604 9.0624
Calculations:
Mean Range
Average 10.04 0.52
Sample Mean Range
110 0.4
39.9 0.4
510 0.6
6
7
8
9
10
11
12
13
14
15
16
17
18
19
20
21
22
23 Note: To display more data on the above graph, right click on the x-axis,
26
9.60
9.80
9.90
10.10
10.30
10.40
Mean Contol Chart (sunknown)
UCL = 10.4196
Clear
Average of sample ranges 0.52 UCL = 10.4196 AVE = 10.0400 LCL = 9.6604
34
35
36
37
38
39
40
41
42
43
44
45
46
47
48
49
50
51
52
53
54
55
56
57
59
60
61
62
63
64
65
66
27
28
29
30
31
32
33
67
68
79
80
81
82
83
84
85
86
87
88
89
90
91
92
93
94
95
96
97
98
99
100
Table.
nA2
21.88
69
70
71
72
73
74
75
76
77
78
31.02
40.73
60.48
80.37
90.34
10 0.31
12 0.27
14 0.24
15 0.22
16 0.21
18 0.19
20 0.18
Range Control Chart
<Back
Average of sample ranges 0.52 UCL = 1.1856 AVE = 0.5200 LCL = 0.0000
Calculations:
Range
Average 0.52
Sample Range
10.4
20.6
30.4
40.6
50.6
6
8
9
10
11
12
13
14
15
16
17
18
19
23
24
25
26
0.00
0.20
0.40
0.60
0.80
1.40
Range Contol Chart
Sample Ranges
Clear
27
28
29
30
31
32
33
34
45
46
47
48
49
50
51
52
53
54
55
56
57
59
60
61
62
63
64
65
66
35
36
37
38
39
40
41
42
43
44
75
76
77
78
79
80
81
82
83
84
85
86
87
88
89
90
91
92
93
94
95
96
97
98
99
100
67
68
69
70
71
72
73
74