2011 2010 2009
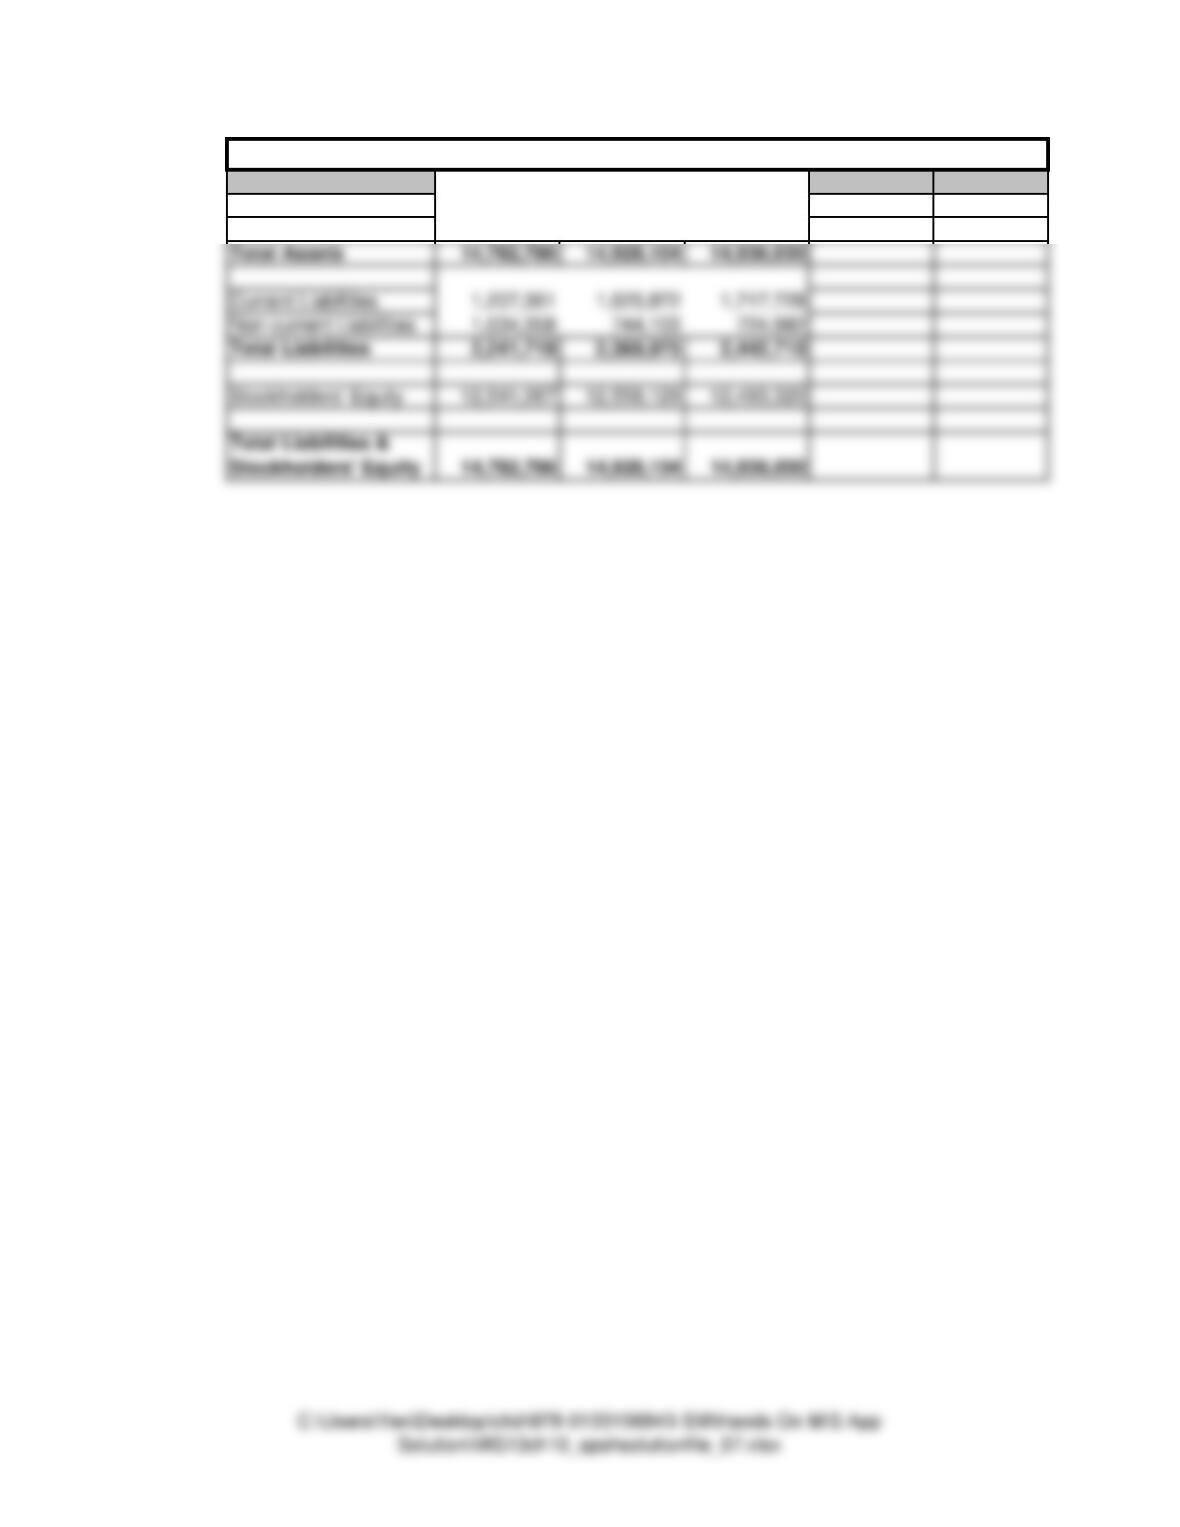
Current Assets 3,452,536 4,345,548 4,594,772
Other Assets 11,330,250 10,582,556 10,341,258
Balance Sheet – Yahoo! (in thousands)
2011 2010 2009
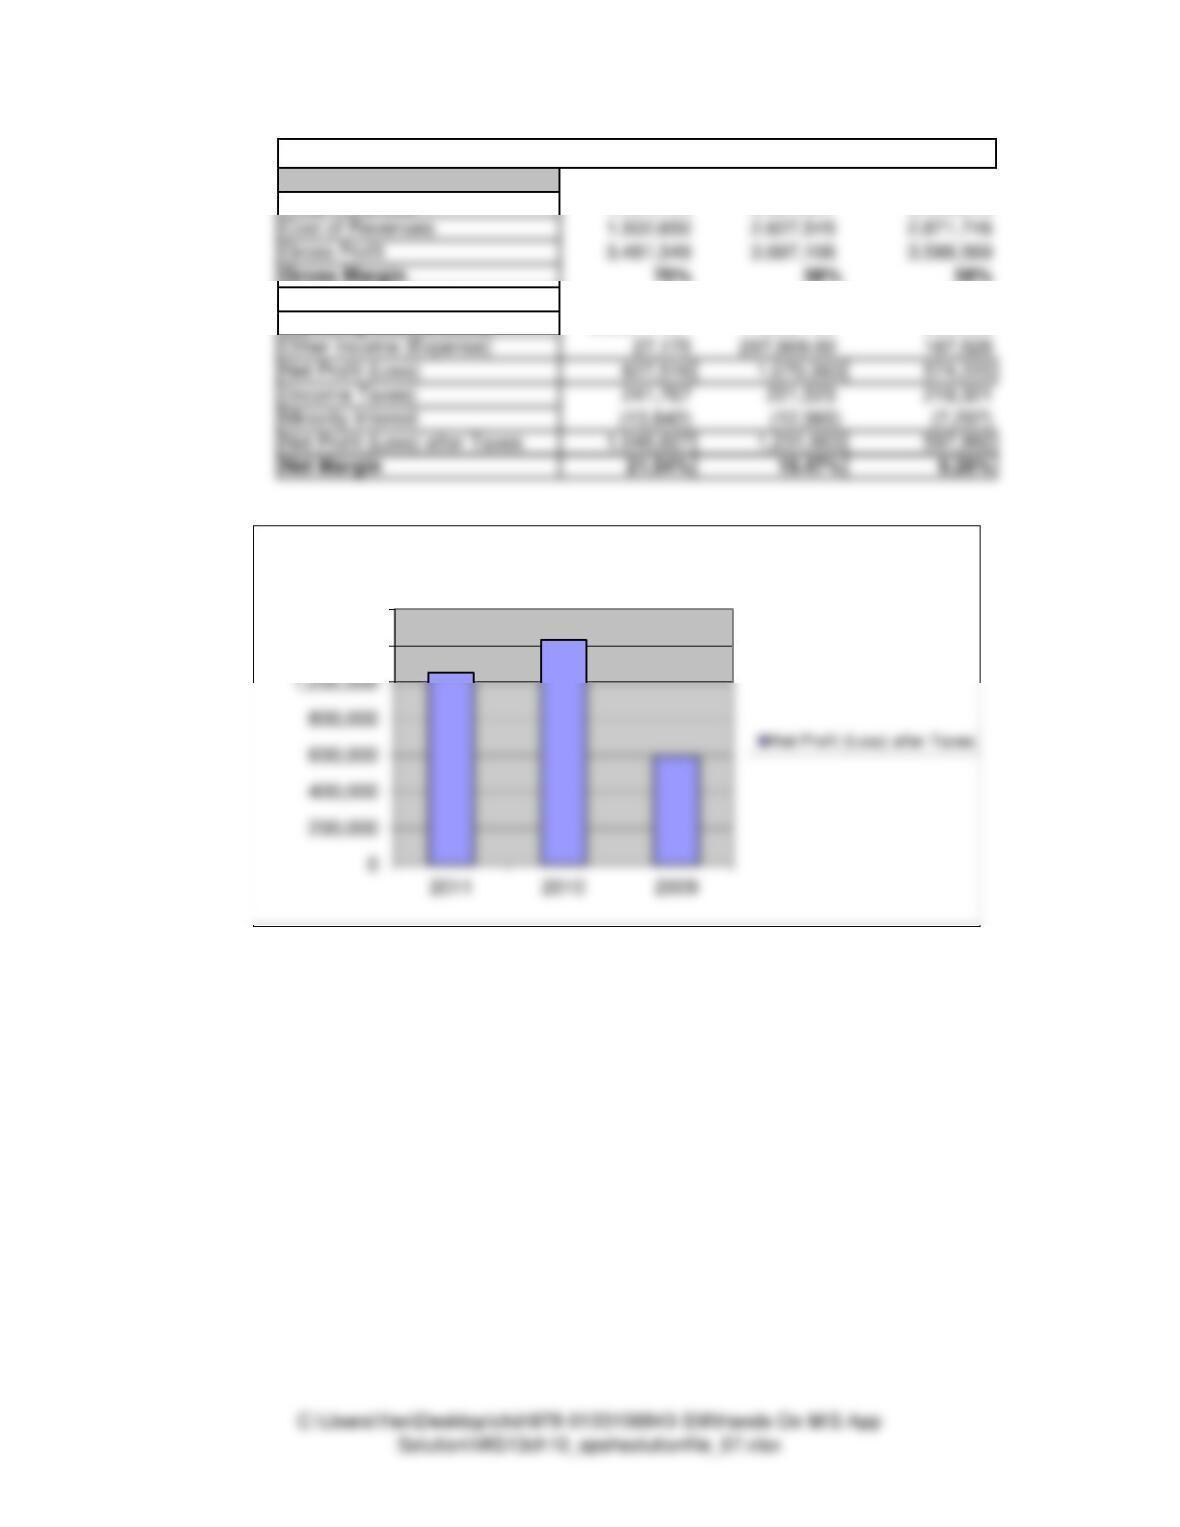
Total Revenues 4,984,199 6,324,651 6,460,315
Gross Margin 70% 58% 56%
Operating Expenses 2,681,208 2,924,582 3,201,877
Operating Income (Loss) 800,341.00 772,524.00 386,692
Other Income (Expense) 27,175 297,869.00 187,528
Net Profit (Loss) 827,516 1,070,393 574,220
(Income Taxes) 241,767 221,523 219,321
Minority Interest (13,842) (12,965) (7,297)
Net Profit (Loss) after Taxes 1,048,827 1,231,663 597,992
Net Margin 21.04% 19.47% 9.26%
Income Statement – Yahoo! (in Thousands)
1,200,000
1,400,000
Net Profit (Loss) after Taxes
Cost of Revenues 1,502,650 2,627,545 2,871,746
Gross Profit 3,481,549 3,697,106 3,588,569