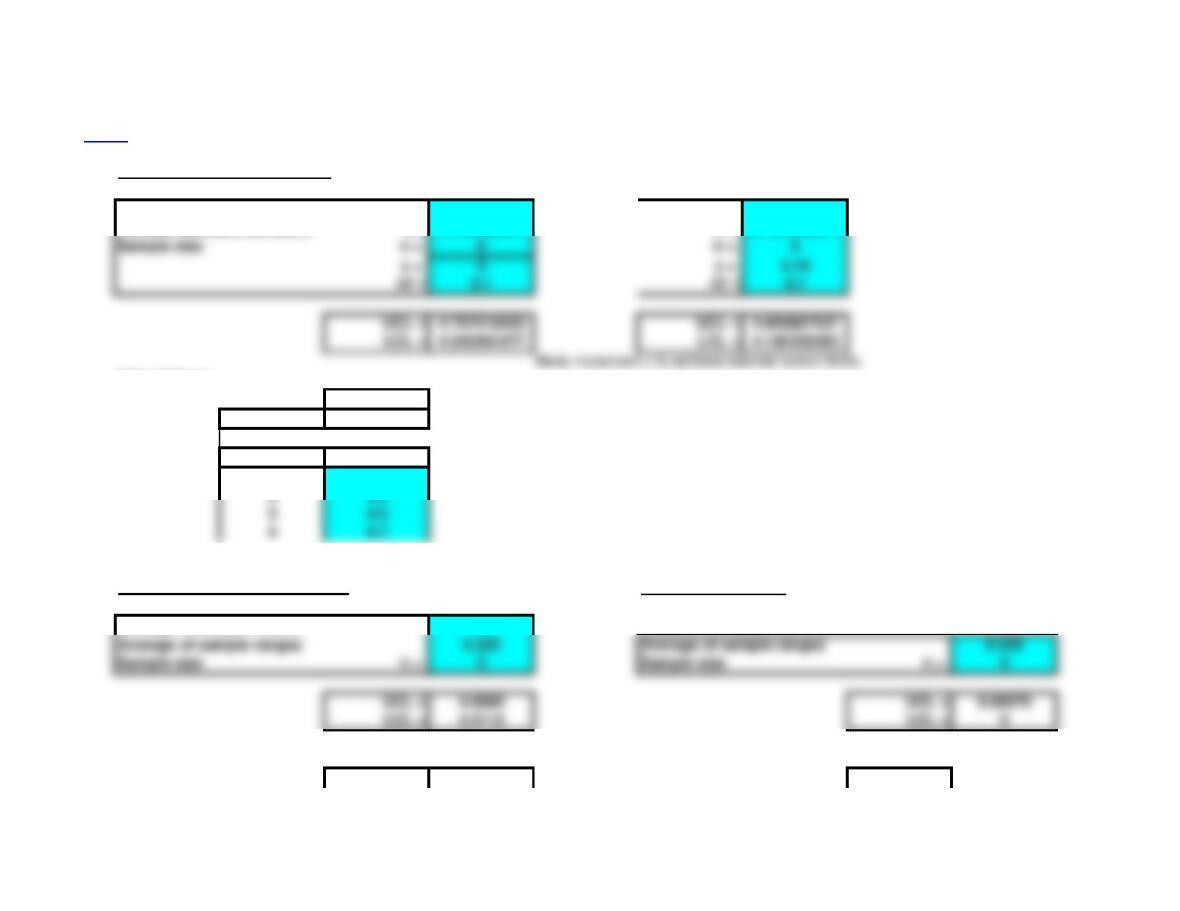
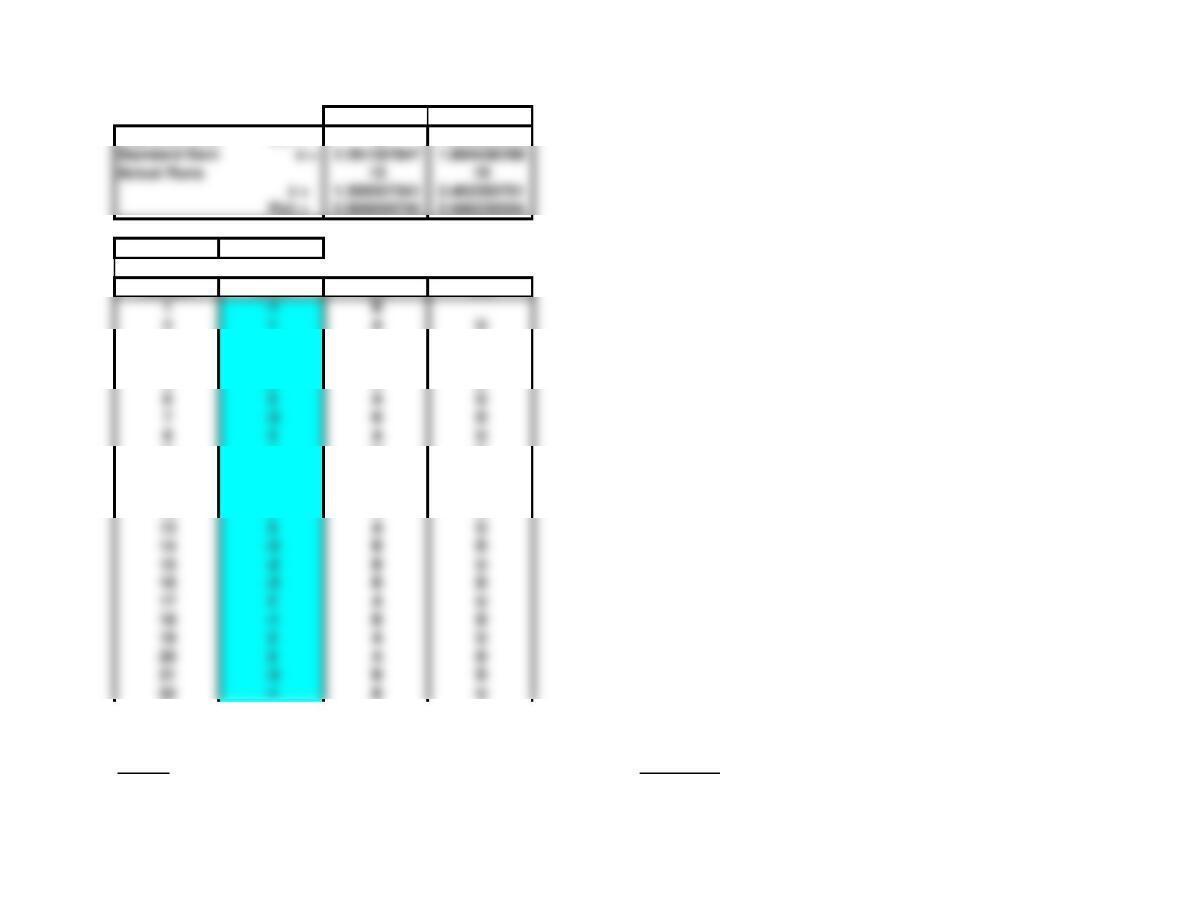
UCL = 16.26632152
LCL = 0
Calculations:
c
Average 7.857142857
Sample c
1 4
210
314
4 8
5 9
6 6
7 5
812
913
Chapter 10 – Problems 8-12 Note: This worksheet displays results only, you must copy the shaded
<Back area into the corresponding template to make additional calculations.
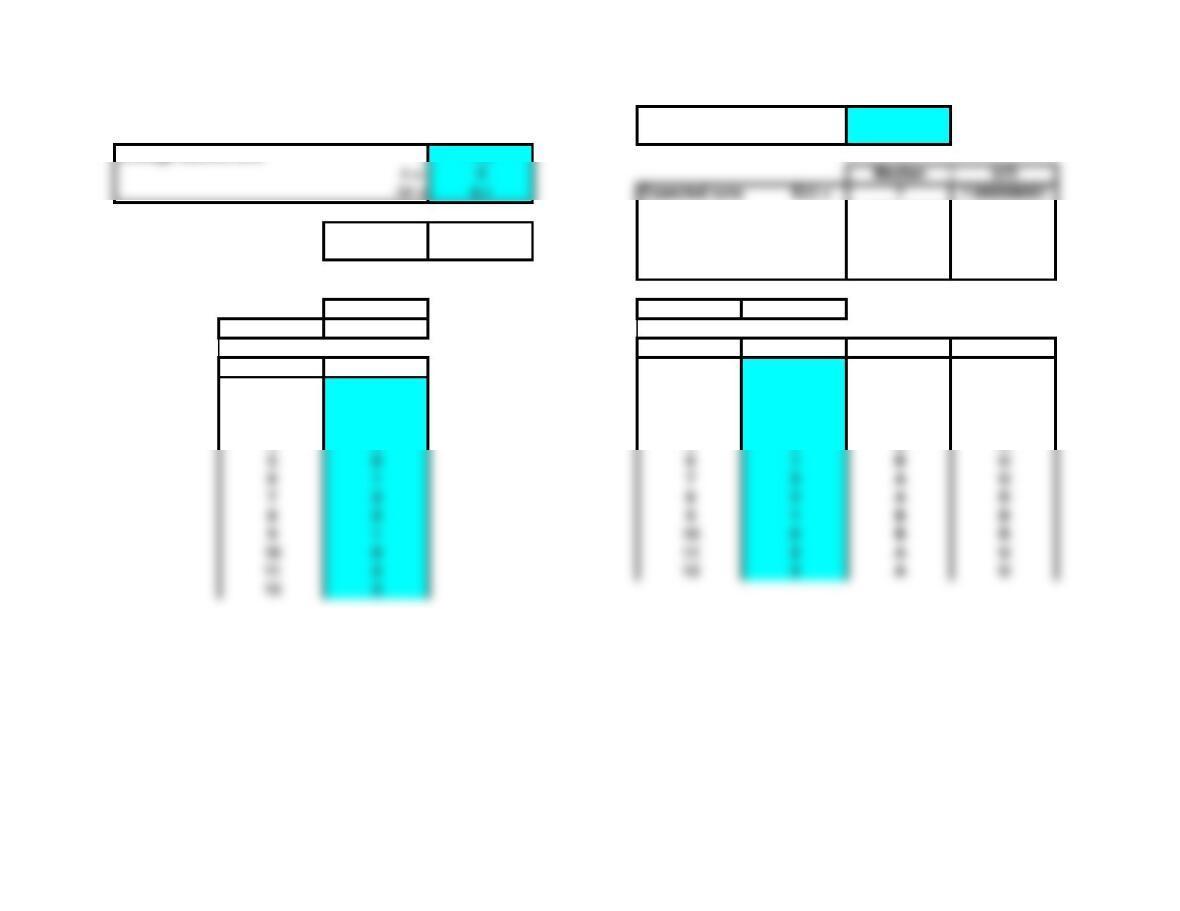
8. c-Chart
Average defects/unit 1.5
z = 3
Calculations:
c
Average 1.5
Sample c
1 2
2 3
3 1
4 0
5 1
6 3
7 2
8 0
9 2
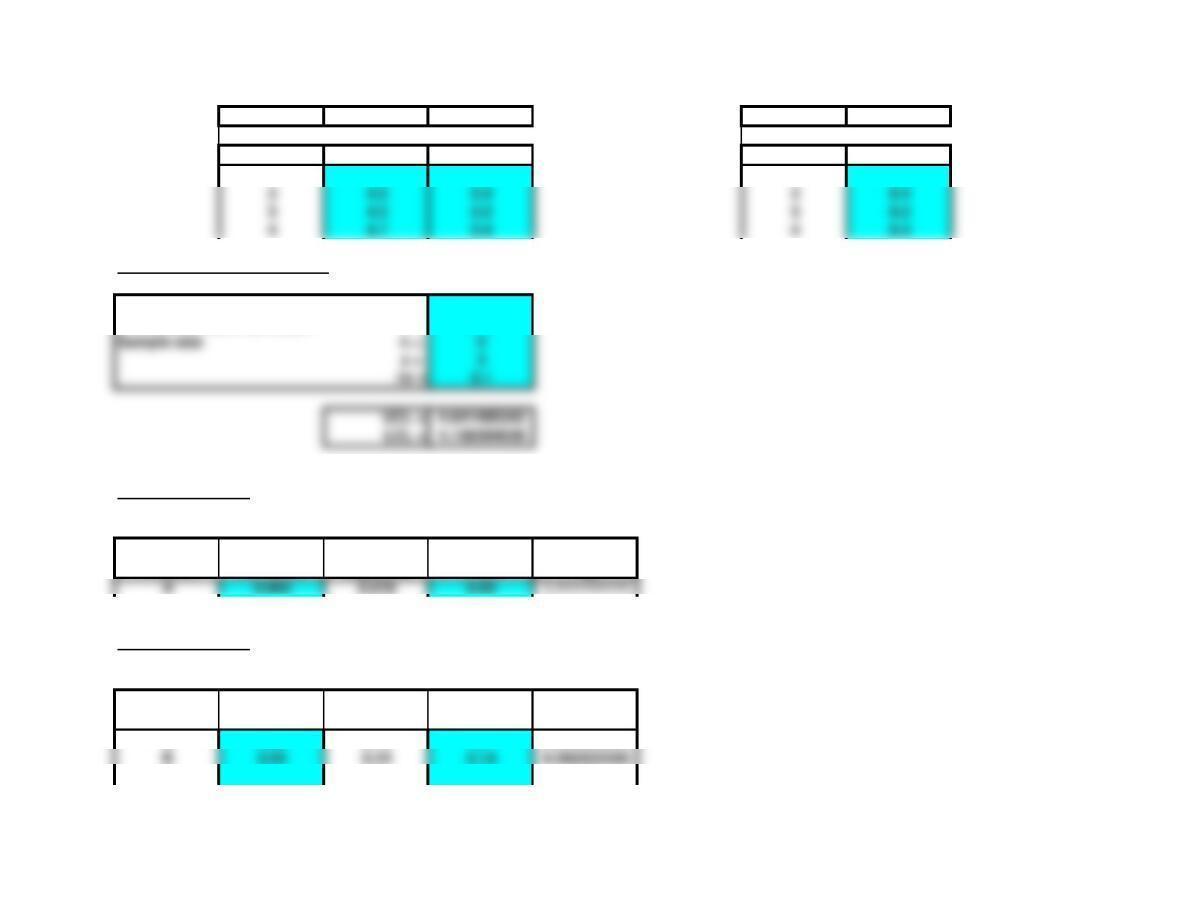
9. p-Chart
Average proportion 0.054375
Dz = 0.1
UCL = 0.098818326
LCL = 0.009931674
Calculations:
p
Average 0.054375
Sample p
10.05
20.03
30.05
40.07
50.04
60.06
70.08
80.04
90.05
10 0.09
11 0.03
12 0.04
13 0.05
14 0.06
15 0.06
12. Mean Control Chart (s known) Runs Tests
Average of sample means 3.85 Number of observations 39
Process standard deviation s = 0.146 Median 3.85
Sample size n = 100
z = 3 Median U/D
Dz = 0.1 Expected runs E(r) = 20.5 25.66666667
Standard Deviatio
s = 3.082207001 2.571208103
P(z) = 0.582695958 0.805164722
Calculations:
Mean Median 3.85
Average 3.85
Sample Mean A/B U/D
Sample Mean 1 3.86 A
13.86 23.9 A U
23.9 33.83 B D
33.83 43.81 B D
43.81 53.84 B U
53.84 63.83 B D
63.83 73.87 A U
73.87 83.88 A U
83.88 93.84 B D
93.84 10 3.8 B D
10 3.8 11 3.88 A U
11 3.88 12 3.86 A D
12 3.86 13 3.88 A U
13 3.88 14 3.81 B D
14 3.81 15 3.83 B U
15 3.83 16 3.86 A U
16 3.86 17 3.82 B D
17 3.82 18 3.86 A U
18 3.86 19 3.84 B D
19 3.84 20 3.87 A U
20 3.87 21 3.84 B D
21 3.84 22 3.82 B D
22 3.82 23 3.89 A U
23 3.89 24 3.86 A D
24 3.86 25 3.88 A U
25 3.88 26 3.9 A U
26 3.9 27 3.81 B D
27 3.81 28 3.86 A U
29 3.98 30 3.96 A D
30 3.96 31 3.88 A D
31 3.88 32 3.76 B D
32 3.76 33 3.83 B U
33 3.83 34 3.77 B D
34 3.77 35 3.86 A U
35 3.86 36 3.8 B D
36 3.8 37 3.84 B U
37 3.84 38 3.79 B D
38 3.79 39 3.85 B U
39 3.85
28 3.86 29 3.98 A U
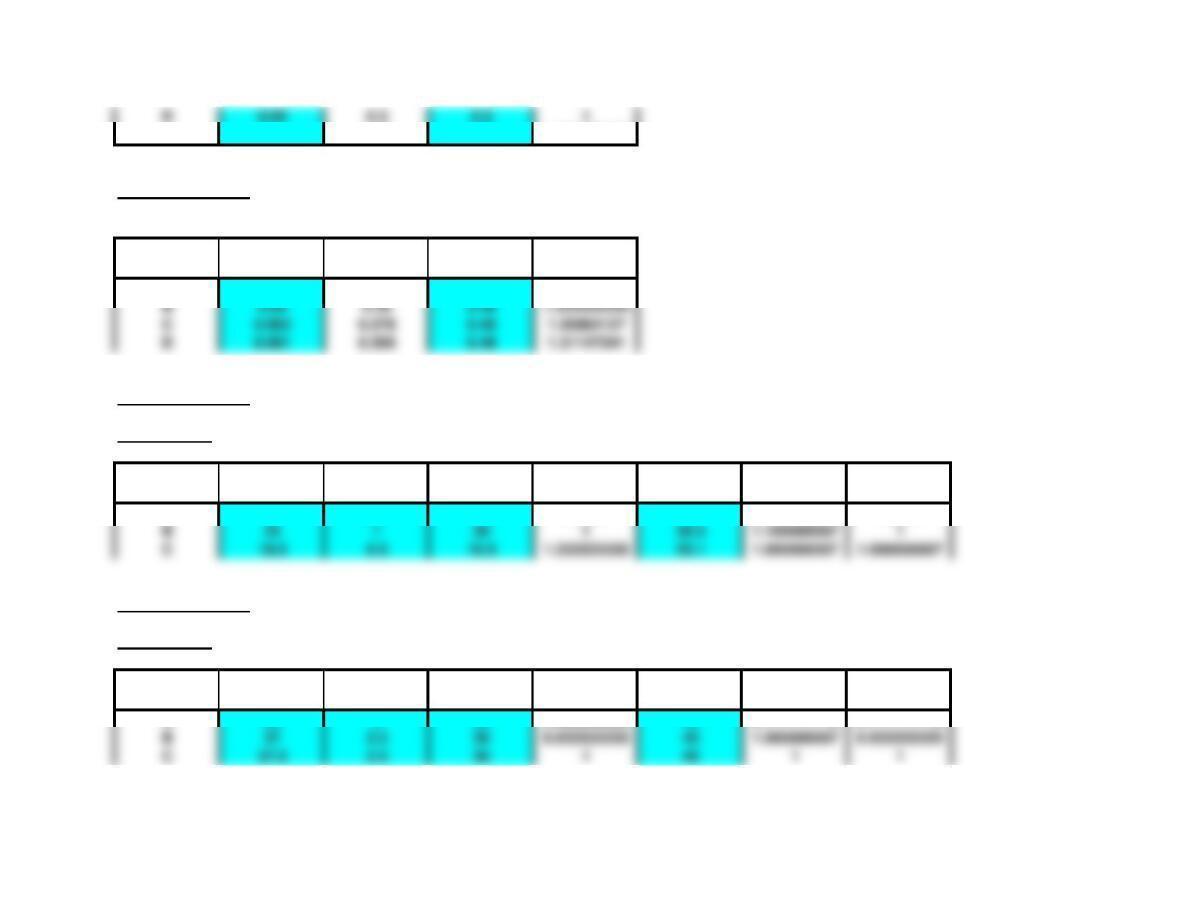
Chapter 10 – Problems 15-19 Note: This worksheet displays results only, you must copy the shaded
<Back area into the corresponding template to make additional calculations.
15. Runs Tests
Number of observations 60
Median 31
Median U/D
Median 30.945
Sample Mean A/B U/D
127.69 B
228.13 B U
333.02 A U
430.31 B D
531.59 A U
633.64 A U
734.73 A U
835.09 A U
933.39 A D
10 32.51 A D
11 27.98 B D
12 31.25 A U
13 33.98 A U
14 25.56 B D
15 24.46 B D
16 29.65 B U
17 31.08 A U
18 33.03 A U
Standard Deviatio
20 25.19 B D
22 20.02 B D
23 26.67 B U
24 36.4 A U
25 32.07 A D
26 44.1 A U
27 41.44 A D
28 29.62 B D
29 30.12 B U
30 26.39 B D
31 40.54 A U
32 36.31 A D
33 27.14 B D
34 30.38 B U
35 31.96 A U
36 32.03 A U
37 34.4 A U
38 25.67 B D
39 35.8 A U
40 32.23 A D
41 26.76 B D
42 30.51 B U
43 29.35 B D
44 24.09 B D
45 22.45 B D
46 25.16 B U
47 26.11 B U
48 29.84 B U
49 31.75 A U
50 29.14 B D
51 37.78 A U
52 34.16 A D
53 38.28 A U
54 29.49 B D
55 30.81 B U
56 30.6 B D
21 28.6 B U
57 34.46 A U
58 35.1 A U
60 34.9 A U
19. Runs Tests
Number of observations 20
Median 2.5
Median U/D
Expected runs E(r) = 11 13
Actual Runs 13 14
Median 2.5
Sample Mean A/B U/D
1 3 A
2 2 B D
3 4 A U
4 5 A U
5 1 B D
6 2 B U
7 4 A U
8 1 B D
59 31.76 A D

17 3 A U
18 1 B D
19 3 A U
20 4 A U
Chapter 10 – Problems 20-29 Note: This worksheet displays results only, you must copy the shaded
<Back area into the corresponding template to make additional calculations.
20. Mean Control Chart (s known)
a-d. Average of sample means 4.5 e-f. 4.5
Process standard deviation s = 0.191942974 s = 0.191942974
Calculations:
Mean
Average 4.5
Sample Mean
14.3
24.5
34.5
44.7
g. Mean Control Chart (s unknown) Range Control Chart
Average of sample means 4.5
Calculations: Calculations:
Mean Range Range
Sample size n = 5 n = 5
Average 4.5 0.325 Average 0.325
Sample Mean Range Sample Range
14.3 0.3 10.3
i. Mean Control Chart (s known)
Average of sample means 4.4
Process standard deviation s = 0.18
Sample size n = 5
21. Process Capability
Standard Process Specification
Process Deviation Capability Width
Cp
22. Process Capability
Standard Process Specification
Process Deviation Capability Width
Cp
A0.02 0.12 0.1 0.833333333
C0.1 0.6 0.36 0.6
24.5 0.4 20.4
34.5 0.2 30.2
44.7 0.4 40.4
E0.01 0.06 0.08 1.333333333
23. Process Capability
Standard Process Specification
Process Deviation Capability Width
Cp
A0.059 0.354 0.48 1.355932203
24. Process Capability
Non centered
Standard Process Lower Upper
Process Deviation Capability Specification Index Specification Index
Cpk
A15 0.32 14.1 0.9375 16 1.041666667 0.9375
26. Process Capability
Non centered
Standard Process Lower Upper
Process Deviation Capability Specification Index Specification Index
Cpk
A38 330 0.888888889 45 0.777777778 0.777777778
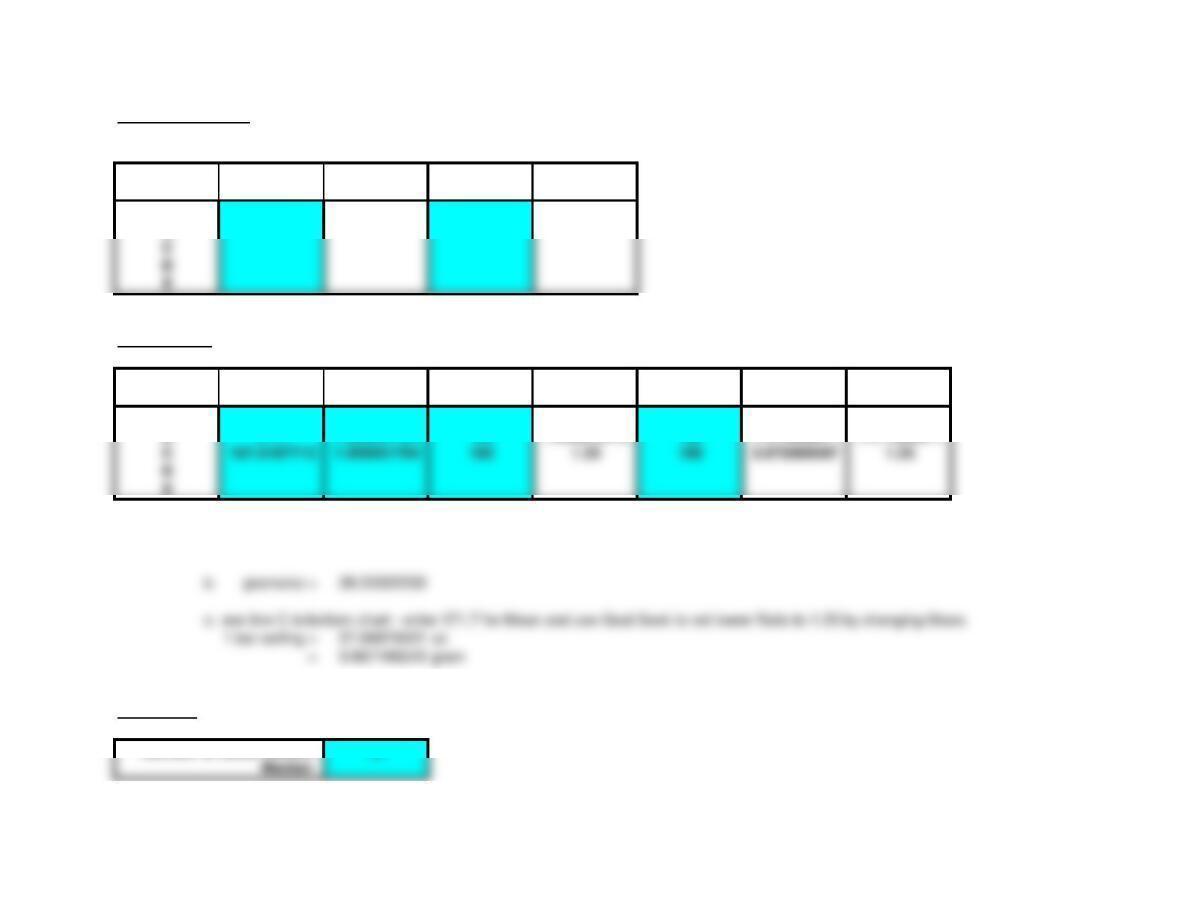
27. Process Capability
Standard Process Specification
Process Deviation Capability Width Cp
A2.506125077 15.03675046 20 1.33007461
B
Non centered
Standard Process Lower Upper
Process Deviation Capability Specification Index Specification Index Cpk
A
B171.7 1.959591794 160 1.990210416 180 1.411858671 1.411858671
D
a. Enter guess for standard deviation in top table, then use Goal Seek to set Cp to 1.33 by changing standard deviation.
28. Runs Tests
Number of observations 22
C
D
Median U/D
Expected runs E(r) = 12 14.33333333
Median 0
Sample Mean A/B U/D
1-1 B
2 1 A U
3-1 B D
4 3 A U
5 2 A D
6 3 A U
7-3 B D
8 4 A U
9-1 B D
10 2 A U
11 -1 B D
12 2 A U
13 3 A U
14 -3 B D
15 -2 B U
16 -3 B D
17 2 A U
18 -1 B D
19 3 A U
20 2 A D
21 -3 B D
22 -1 B U
29. c-Chart Runs Tests
Actual Runs 15 19
Number of observations 12
Median 1.5
Average defects/unit 1.5
Standard Deviatio
s = 1.658312395 1.345775283
UCL = 3.949489743 Actual Runs 6 6
LCL = 0 z = -0.603022689 –1.238443512
P(z) = 0.453506405 0.784448345
Calculations:
c Median 1.5
Average 1.5
Sample Mean A/B U/D
Sample c 1 1 B
1 1 2 0 B D
2 0 3 3 A U
3 3 4 2 A D
4 2 5 0 B D
5 0 6 1 B U
6 1 7 3 A U
7 3 8 2 A D
8 2 9 1 B D