Basic Template: You can simply copy the basic template below and paste into another worksheet.
^Top
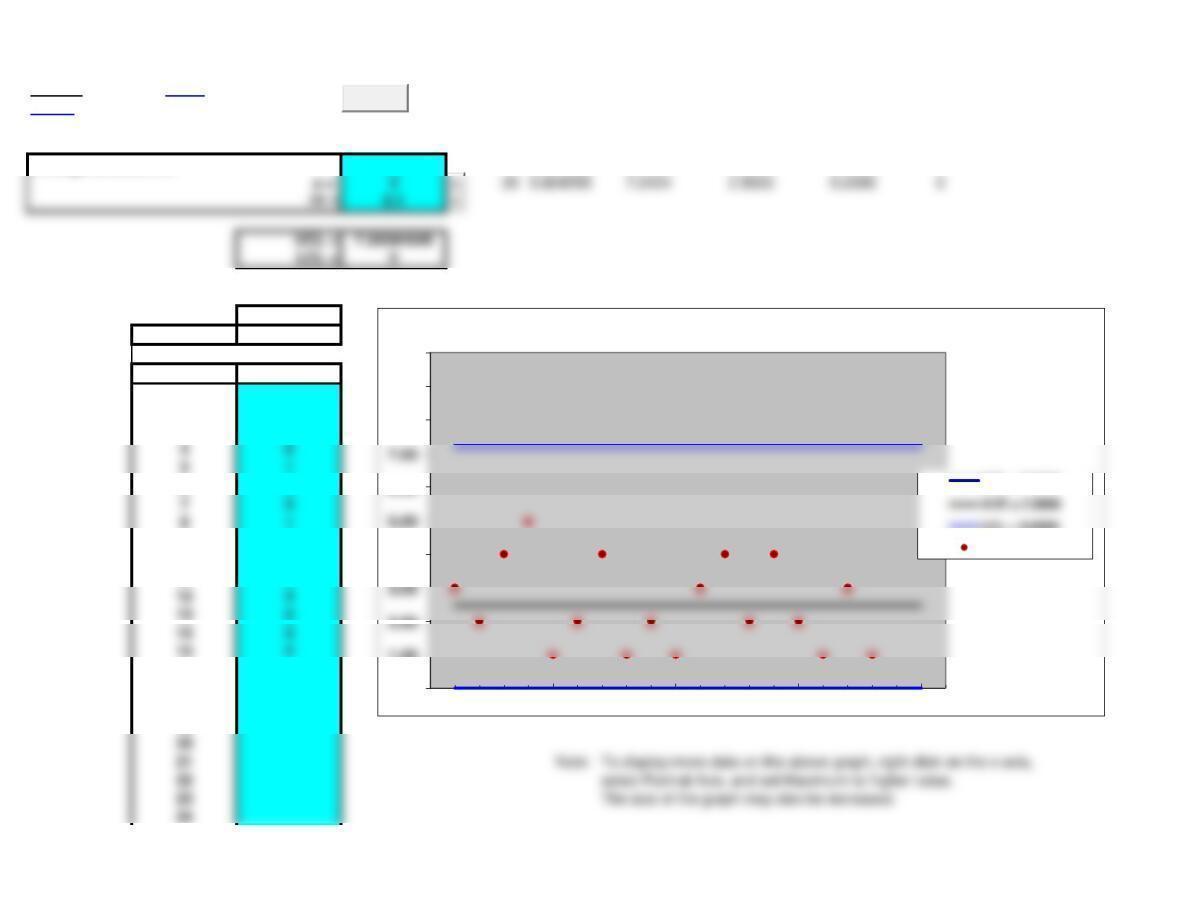
p-Chart
Average proportion 0.11
UCL = 0.203866927
LCL = 0.016133073
Calculations:
p
Average 0.11
Sample p
10.04
20.1
30.12
40.03
50.09
60.11
70.1
80.22
90.13
10 0.1
11 0.08
12 0.12
13 0.09
14 0.1
15 0.21
16 0.1
17 0.08
18 0.12
19 0.1
20 0.16
Sample size n = 100
c-Chart Basic
<Back
UCL = 7.2434 AVE = 2.5000 LCL = 0.0000
Average defects/unit 2.5 18.824555 7.2434 2.5000 0.0000 0
Calculations:
c
Average 2.5
Sample c
1 3
2 2
3 4
4 5
6 2
7 4
8 1
9 2
10 1
11 3
12 4
13 2
14 4
15 2
16 1
17 3
18 1
19
20
24
0.00
1.00
4.00
6.00
8.00
9.00
10.00
0 5 10 15 20
c-Chart
UCL = 7.2434
LCL = 0.0000
Sample c’s
Clear

30
31
32
33
34
35
36
37
38
39
40
41
42
43
44
45
46
47
48
49
50
51
52
53
54
55
57
58
59
60
61
62
63
64
25
26
27
28
29
75
76
77
78
79
80
81
82
83
84
85
86
87
88
89
90
91
92
93
94
95
96
97
98
99
100
65
66
67
68
69
70
71
72
73
74
Basic Template: You can simply copy the basic template below and paste into another worksheet.
^Top
c-Chart
Average defects/unit 2.5
Calculations:
c
Average 2.5
Sample c
1 3
2 2
3 4
4 5
5 1
6 2
7 4
8 1
9 2
Runs Tests
<Back
Number of observations 20
Median 11 Median = 11.0000
111.0000
Median U/D 20 11.0000
Expected runs E(r) = 11 13
Median 11
Sample Mean A/B U/D
110 B
210.4 B U
310.2 B D
411.5 A U
510.8 B D
611.6 A U
711.1 A D
811.2 A U
910.6 B D
10 10.9 B U
11 10.7 B D
12 11.3 A U
13 10.8 B D
14 11.8 A U
15 11.2 A D
16 11.6 A U
17 11.2 A D
18 10.6 B D
19 10.7 B U
20 11.9 A U
21
22
23
9.50
11.50
0 5 10 15 20
Runs Tests
Median = 11.0000 Sample Means
Clear
Standard Deviatio
Actual Runs 10 17
34
35
36
37
38
39
40
41
42
43
44
45
46
47
48
49
50
51
52
53
54
55
56
57
58
59
60
61
62
63
64
65
66
67
68
69
28
29
30
31
32
33
79
80
81
82
83
84
85
86
87
88
89
90
91
92
93
94
95
96
97
98
99
100
70
71
72
73
74
75
76
77
78
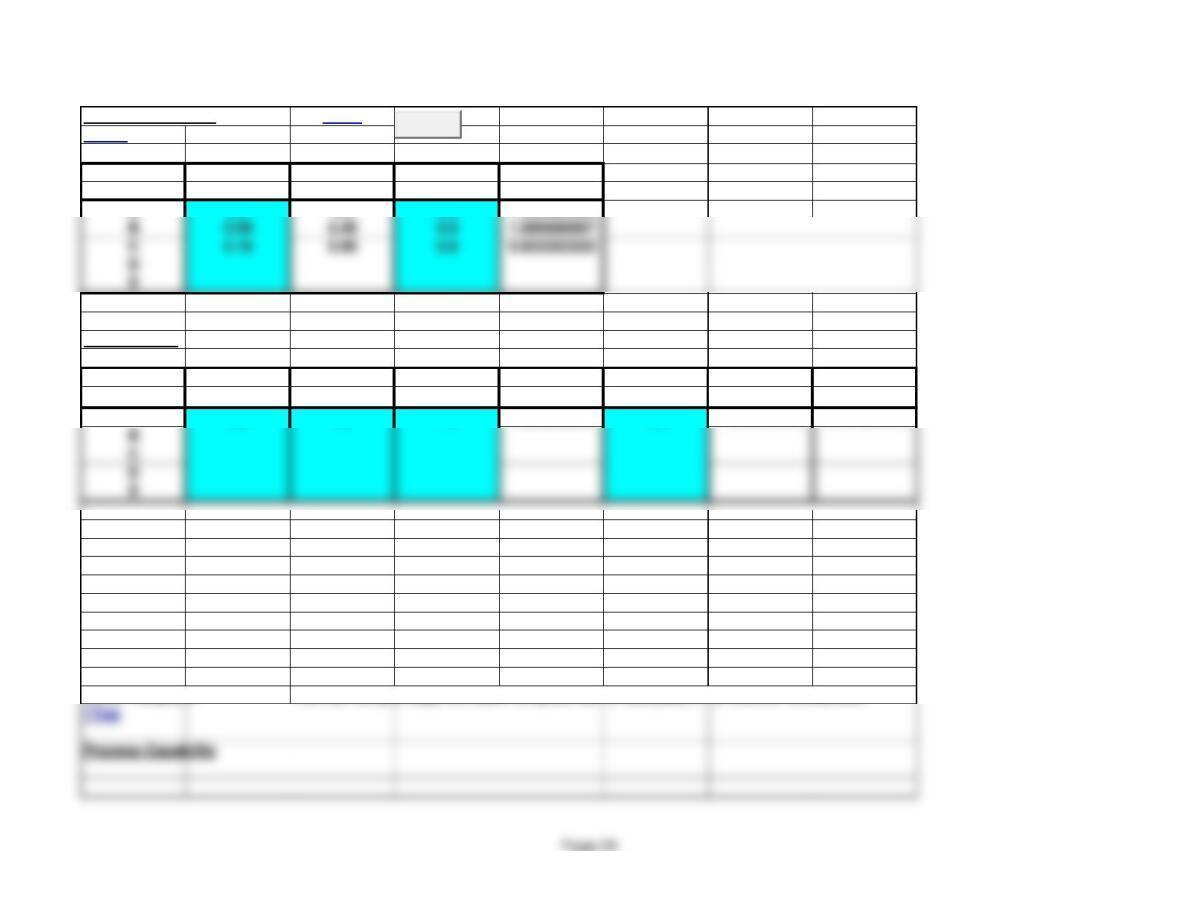
Process Capability
Process Capability Basic
<Back
Standard Process Specification
Process Deviation Capability Width Cp
A0.1 0.6 0.8 1.333333333
Non centered
Process Standard Lower Upper
Process Mean Deviation Specification Index Specification Index
Cpk
A9.2 0.3 7.5 1.888888889 10.5 1.444444444 1.444444444
Basic Template: You can simply copy the basic template below and paste into another worksheet.
^Top
Process Capability
Clear
Process Capability
Standard Machine Specification
Machine Deviation Capability Width
Cp
A0.1 0.6 0.8 1.333333333
Non centered
Process Standard Lower Upper
Machine Mean Deviation Specification Ratio Specification Ratio
Cpk
A9.2 0.3 7.5 1.888888889 10.5 1.444444444 1.444444444
Lecture Suggestions – Chapter 10
<Back
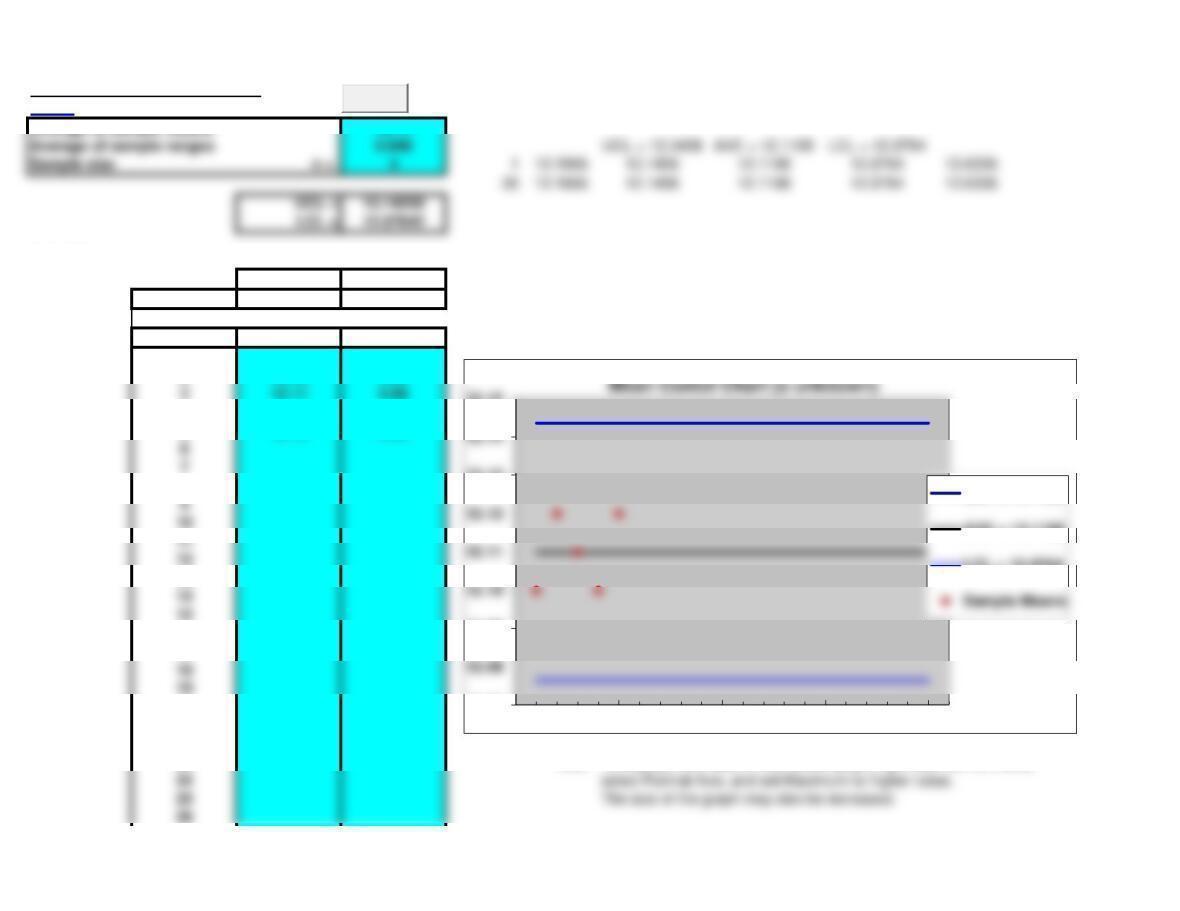
Example 1: Mean Control Chart (s known)
2. Enter the five sample means (12.10, 12.12, 12.11, 12.10, and 12.12) in the Calculation table at the
bottom of the template (enter under the heading “Mean” and to the right of the Sample numbers 1-5).
3. Point out that the template computes the average of sample means = 12.11, and the 5 sample
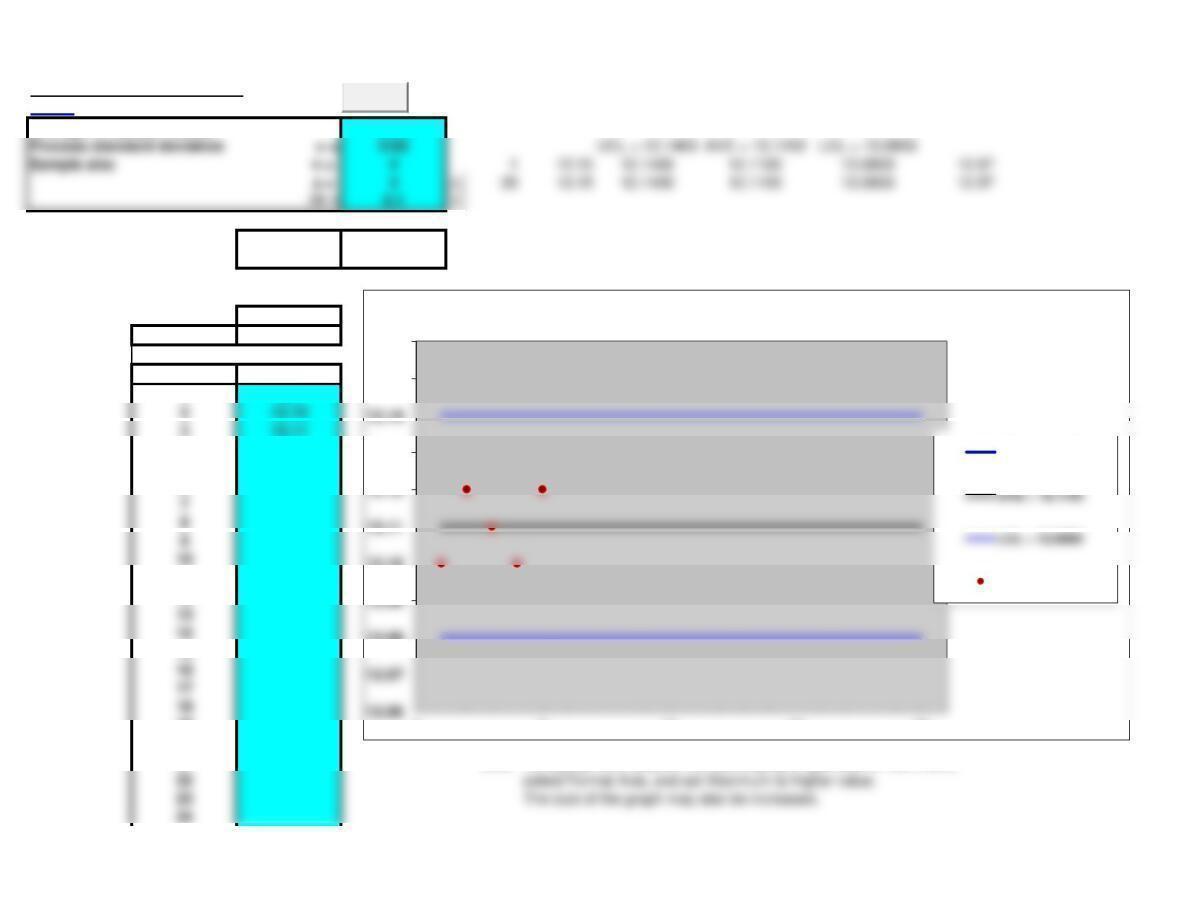
4. Enter the following data in the table in the top middle of the template:
a. Average of sample means = 12.11 (as calculated)
b. Process standard deviation = .02 (given)
c. Sample size = 4 (given)
d. z = 3 (number of standard deviations)
5. Point out that the upper and lower control limits are calculated and also graphed on the chart
to the right. Note that all the sample means are well within 3-sigma control limits.
z, and watching the upper and lower limits on the chart.
7. Goal Seek example: what z value would correspond to control limits from 12.095 to 12.125?
Solution:
a. Select the command Tools / Goal seek
b. Set cell: D10
c. To value: 12.095
d. By changing cell: D6
Mean Control Chart (s known)
<Back
Average of sample means 12.11
UCL = 12.14
LCL = 12.08
Calculations:
Mean
Average 12.11
Sample Mean
112.1
412.1
512.12
6
7
8
9
10
11
12
13
14
15
16
17
18
19
20
21 Note: To display more data on the above graph, right click on the x-axis,
24
12.08
12.10
12.13
12.15
12.16
0 5 10 15 20
Mean Contol Chart (sknown)
UCL = 12.1400
Sample Means
Clear
Sample size n = 4 112.15 12.1400 12.1100 12.0800 12.07

32
33
34
35
36
37
38
39
40
41
42
43
44
45
46
47
48
49
50
51
52
53
54
55
57
58
59
60
61
62
63
64
25
26
27
28
29
30
31
65
66
77
78
79
80
81
82
83
84
85
86
87
88
89
90
91
92
93
94
95
96
97
98
99
100
67
68
69
70
71
72
73
74
75
76
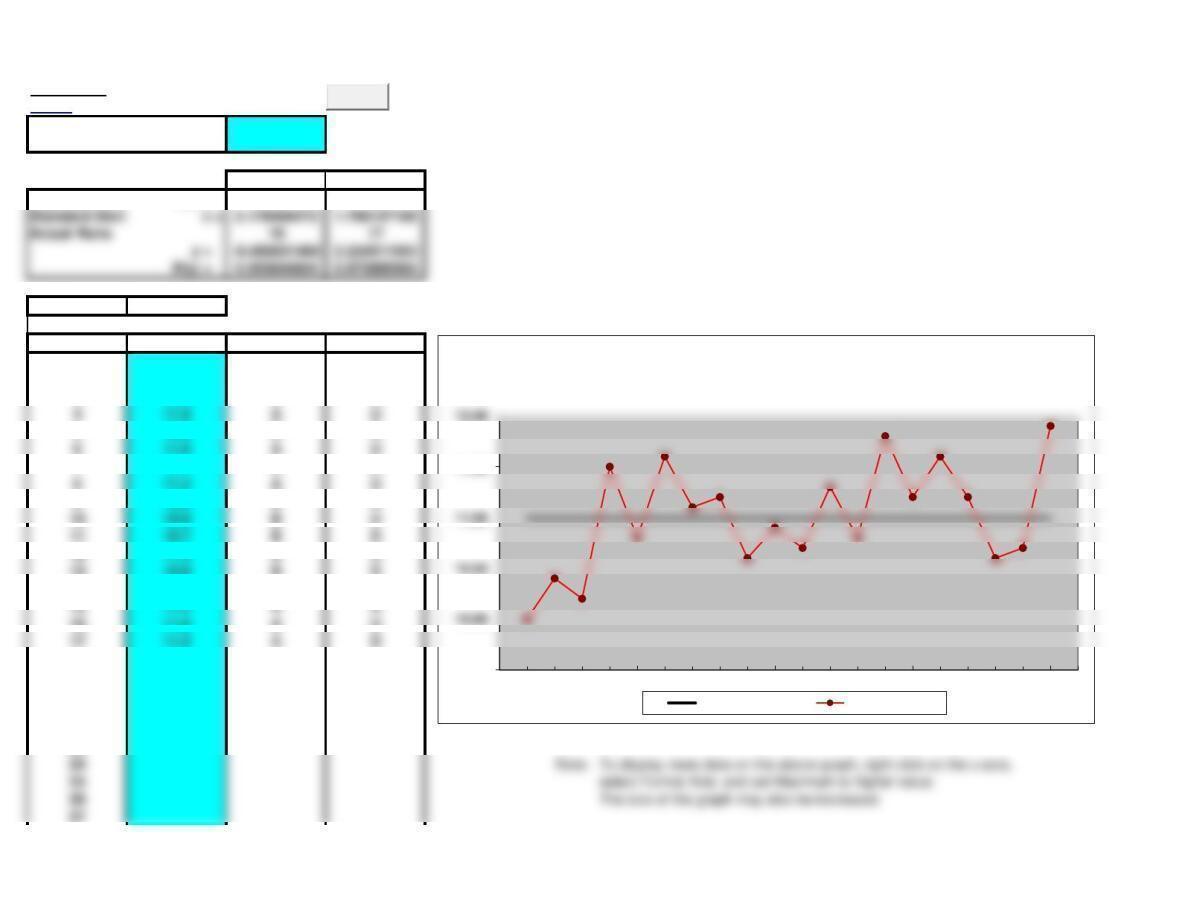
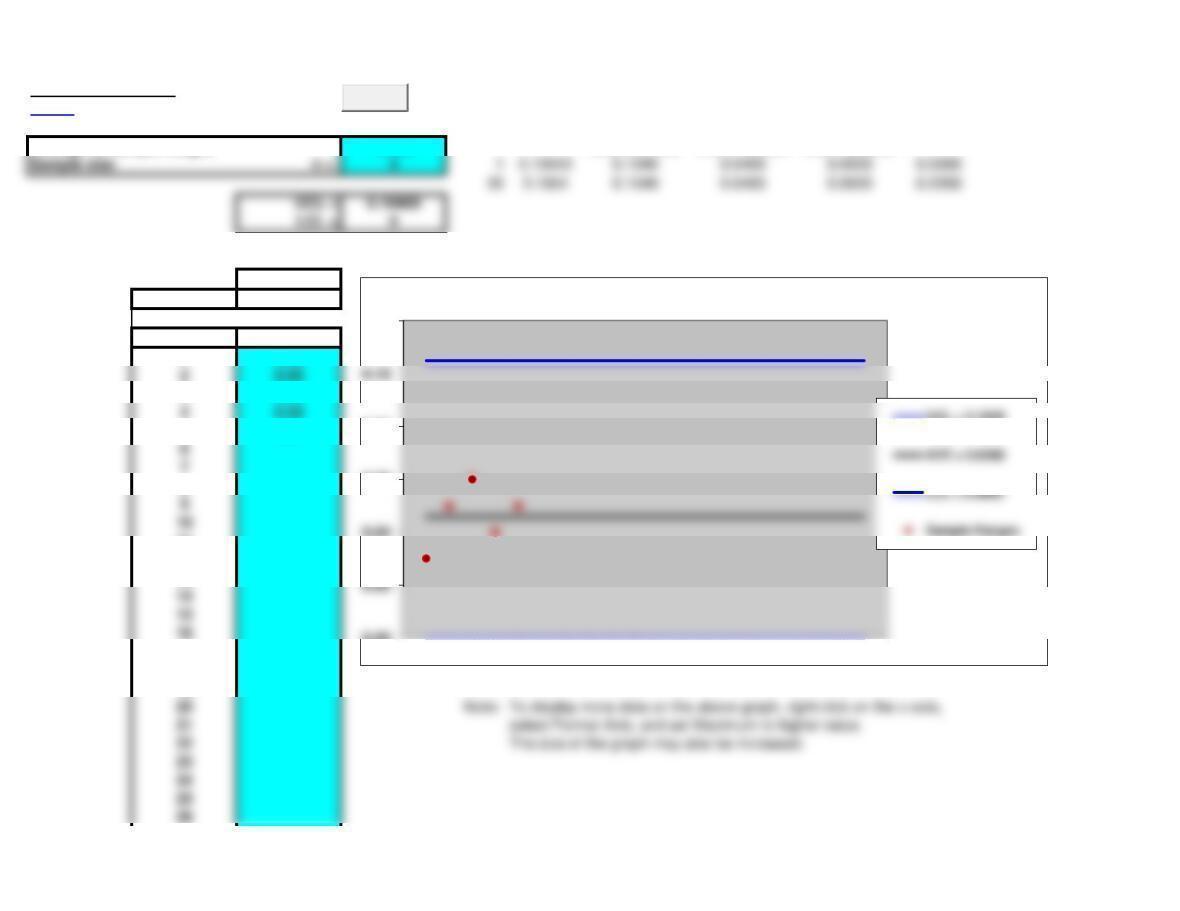
Mean Control Chart (s unknown)
<Back
Average of sample means 12.11
Calculations:
Mean Range
Average 12.11 0.046
Sample Mean Range
112.1 0.03
212.12 0.05
312.11 0.06
412.1 0.04
512.12 0.05
6
8
9
10
11
12
13
14
15
16
17
18
19
20
21
22
23 Note: To display more data on the above graph, right click on the x-axis,
26
12.07
12.09
12.13
12.15
0 5 10 15 20
UCL = 12.1436
AVE = 12.1100
LCL = 12.0764
Clear
Average of sample ranges 0.046 UCL = 12.1436 AVE = 12.1100 LCL = 12.0764
34
35
36
37
38
39
40
41
42
43
44
45
46
47
48
49
50
51
52
53
54
55
56
57
59
60
61
62
63
64
65
66
27
28
29
30
31
32
33
67
68
79
80
81
82
83
84
85
86
87
88
89
90
91
92
93
94
95
96
97
98
99
100
Table.
nA2
69
70
71
72
73
74
75
76
77
78

31.02
40.73
50.58
70.42
90.34
11 0.29
13 0.25
14 0.24
15 0.22
17 0.20
19 0.19
20 0.18
Range Control Chart
<Back
Average of sample ranges 0.046 UCL = 0.1049 AVE = 0.0460 LCL = 0.0000
Calculations:
Range
Average 0.046
Sample Range
10.03
20.05
30.06
40.04
50.05
6
8
9
10
11
12
13
14
15
16
17
18
19
23
24
25
26
0.00
0.04
0.06
0.08
0.12
0 5 10 15 20
Range Contol Chart
UCL = 0.1049
Clear
27
28
29
30
31
32
33
34
45
46
47
48
49
50
51
52
53
54
55
56
57
59
60
61
62
63
64
65
66
35
36
37
38
39
40
41
42
43
44