Excel Templates to accompany Operations Management, Eleventh Edition
created by Lee Tangedahl
Copyright © 2012 by The McGraw Hill Companies, Inc. All rights reserved.
Chapter Ten – Quality Control
Templates: Normal Distribution (B) Example 5
Mean Control Chart (s known) (B) Example 6
Mean Control Chart (s unknown) (B) Example 7,8,9
Range Control Chart (B)
p-Chart (B) Solved Problems: Solved Problem 1
Process Capability (B) Solved Problem 3
Lecture Suggestions Solved Problem 6
Examples: Example 1 Problems: Problems 1-7
Example 2 Problems 8-12
Example 3 Problems 15-19
Example 4 Problems 20-29
See Instructions template for complete instructions.
c-Chart (B) Solved Problem 2
Runs Tests Solved Problem 2d
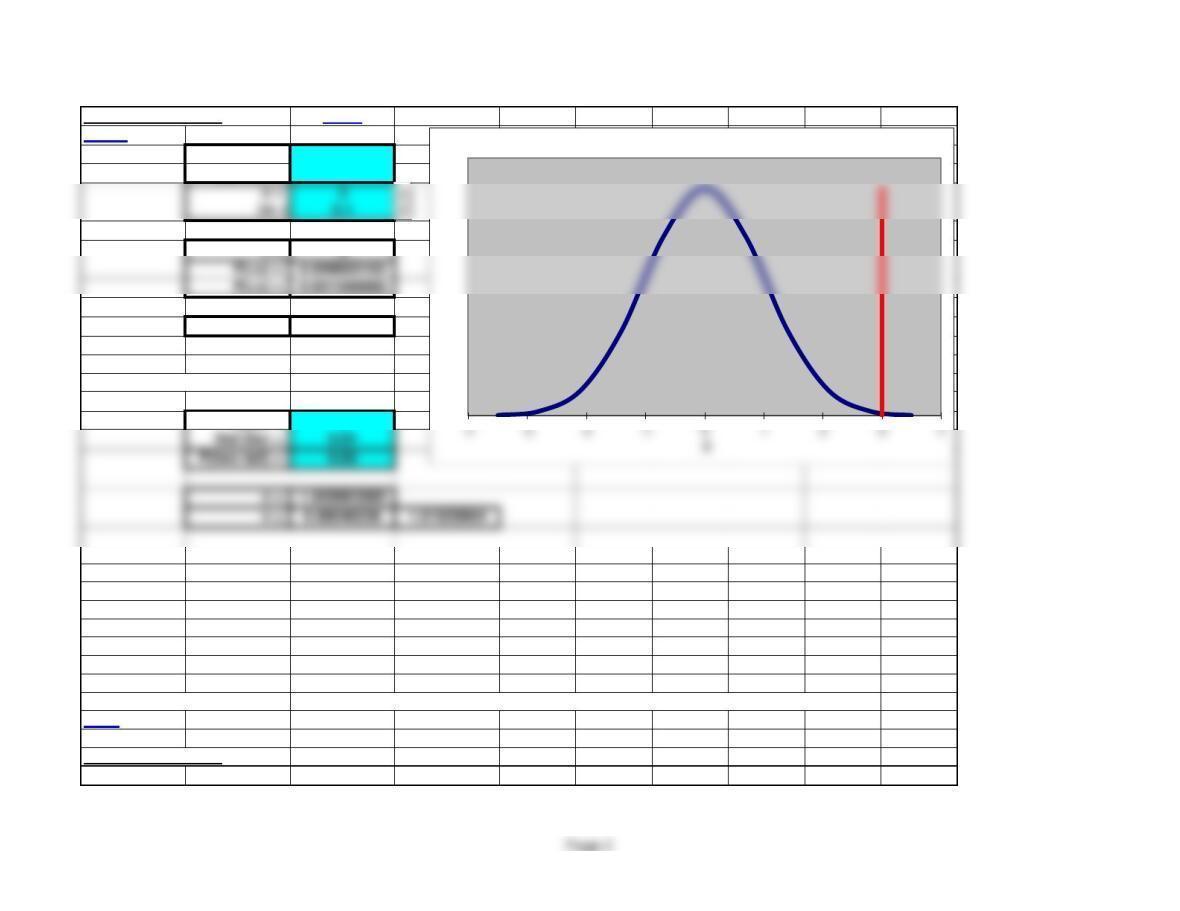
Normal
Normal Distribution Basic
<Back
Mean = 0
Std Dev = 1 -3.5 0.000873
-1.4 0.149727
z = 3 -0.7 0.312254
1.4 0.149727
P(two tail) = 0.002699796 2.1 0.043984
2.8 0.007915
3.5 0.000873
Normal Inverse 3 0
30.398942
Mean = 1
Basic Template: You can simply copy the basic template below and paste into another worksheet.
^Top
Normal Distribution
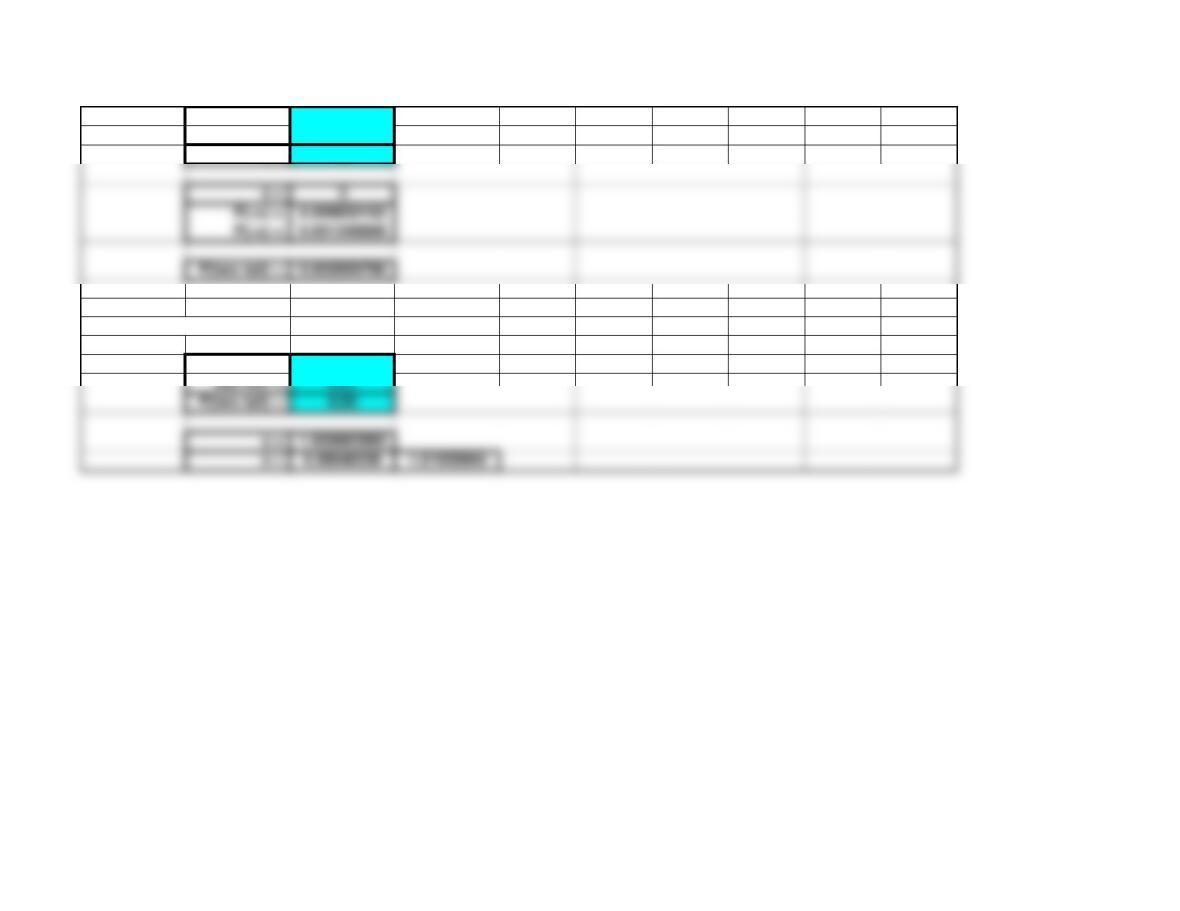
Normal
Mean = 0
Std Dev = 1
x = 3
Normal Inverse
Mean = 1
Std Dev = 0.01
z = 1.959963985
x = 0.98040036 1.01959964
Page 3
z = 3
Mean Control Chart (s known)
<Back Basic
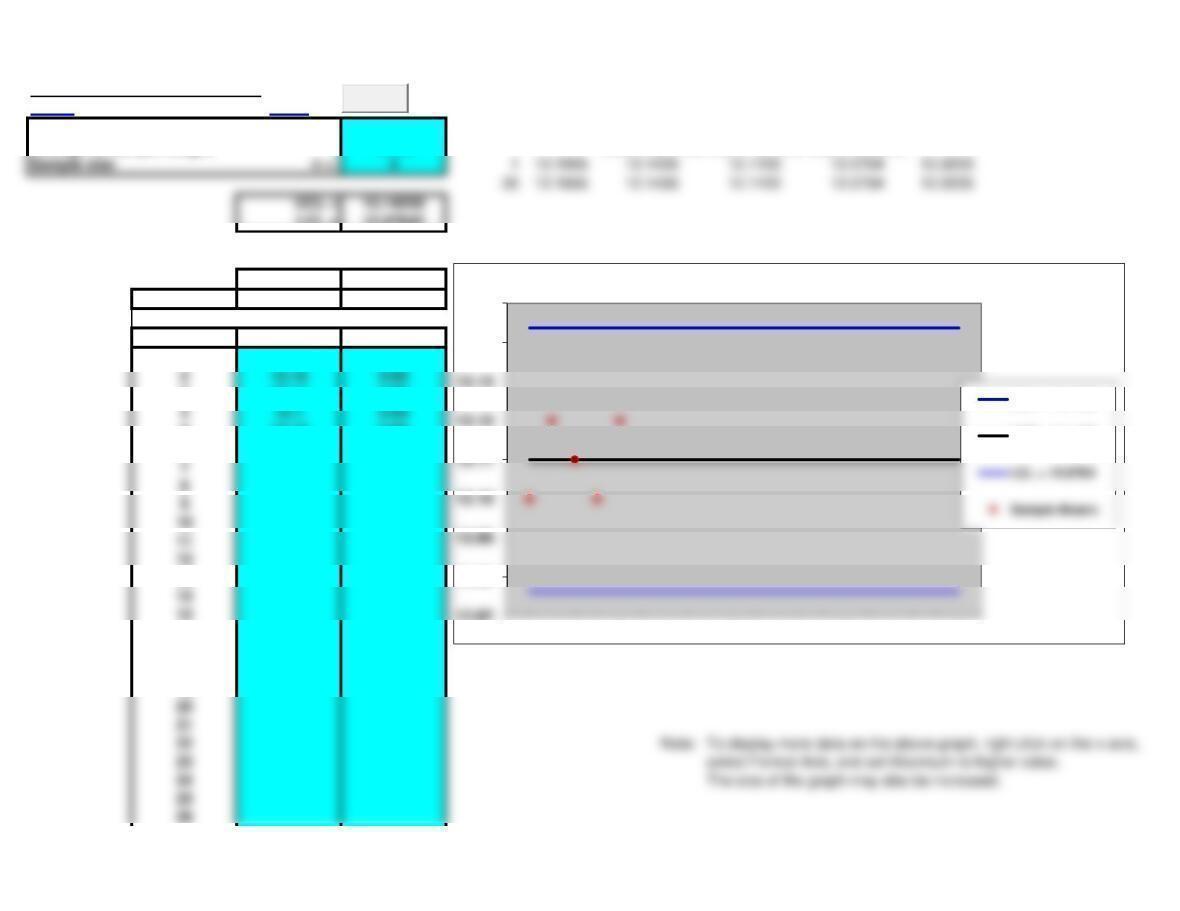
Average of sample means 12.11
Process standard deviation s = 0.02 UCL = 12.1400 AVE = 12.1100 LCL = 12.0800
Calculations:
Mean
Average 12.11
Sample Mean
112.1
212.12
312.11
412.1
6
7
8
9
10
11
12
13
14
15
16
17
18
19
20
21 Note: To display more data on the above graph, right click on the x-axis,
24
12.06
12.07
12.10
12.15
12.16
0 5 10 15 20
Mean Contol Chart (sknown)
AVE = 12.1100
LCL = 12.0800
Sample Means
Clear

32
33
34
35
36
37
38
39
40
41
42
43
44
45
46
47
48
49
50
51
52
53
54
55
57
58
59
60
61
62
63
64
25
26
27
28
29
30
31
65
66
77
78
79
80
81
82
83
84
85
86
87
88
89
90
91
92
93
94
95
96
97
98
99
100
67
68
69
70
71
72
73
74
75
76
Basic Template: You can simply copy the basic template below and paste into another worksheet.
^Top
Mean Control Chart (s known)
Average of sample means 12.11
LCL = 12.08
Calculations:
Mean
Average 12.11
Sample Mean
112.1
212.12
312.11
412.1
512.12
Mean Control Chart (s unknown)
<Back Basic
Average of sample means 12.11
Average of sample ranges 0.046 UCL = 12.1436
AVE = 12.1100
LCL = 12.0764
LCL = 12.07642
Calculations:
Mean Range
Average 12.11 0.046
Sample Mean Range
112.1 0.03
212.12 0.05
312.11 0.06
412.1 0.04
512.12 0.05
6
8
9
10
11
12
13
14
15
16
17
18
19
20
21
23
25
26
12.07
12.08
12.14
12.15
0 5 10 15 20
Mean Contol Chart (sunknown)
UCL = 12.1436
AVE = 12.1100
Clear
27
28
29
30
31
32
33
34
45
46
47
48
49
50
51
52
53
54
55
56
57
59
60
61
62
63
64
65
66
35
36
37
38
39
40
41
42
43
44
75
76
77
78
79
80
81
82
83
84
85
86
87
88
89
90
91
92
93
94
95
96
97
99
67
68
69
70
71
72
73
74
Table:
nA2
21.88
40.73
50.58
60.48
80.37
10 0.31
12 0.27
13 0.25
14 0.24
16 0.21
18 0.19
19 0.19
20 0.18
Basic Template: You can simply copy the basic template below and paste into another worksheet.
^Top You must also copy the table in A120:B138.
Mean Control Chart (s unknown)
Average of sample means 12.11
Average of sample ranges 0.046
UCL = 12.14358
LCL = 12.07642
Calculations:
Mean Range
Average 12.11 0.046
Sample Mean Range
212.12 0.05
312.11 0.06
412.1 0.04
512.12 0.05
Warning: UCL and LCL are calculated using the table in A120:B138.
112.1 0.03
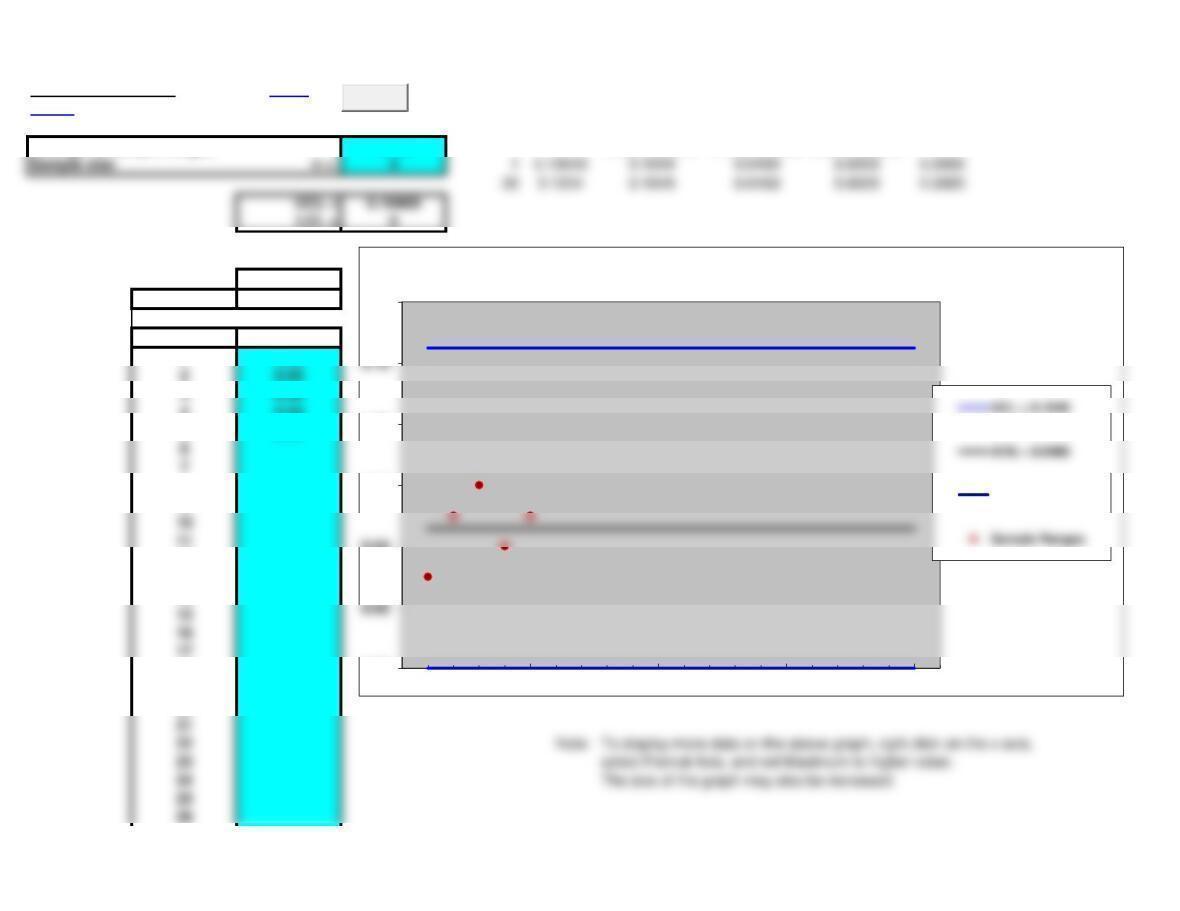
Range Control Chart Basic
<Back
Average of sample ranges 0.046 UCL = 0.1049 AVE = 0.0460 LCL = 0.0000
Calculations:
Range
Average 0.046
Sample Range
10.03
20.05
30.06
40.04
50.05
6
8
9
10
11
12
13
14
15
16
17
18
19
20
21
25
26
0.00
0.04
0.06
0.08
0.12
0 5 10 15 20
Range Contol Chart
LCL = 0.0000
Clear

31
32
33
34
35
36
37
38
39
40
41
42
43
44
45
46
47
48
49
50
51
52
53
54
55
56
57
59
60
61
62
63
64
65
66
27
28
29
30
76
77
78
79
80
81
82
83
84
85
86
87
88
89
90
91
92
93
94
95
96
97
98
99
100
67
68
69
70
71
72
73
74
75
Table.
nD3 D4
30.00 2.57
40.00 2.28
50.00 2.11
70.08 1.92
90.18 1.82
11 0.26 1.74
13 0.31 1.69
14 0.33 1.67
15 0.35 1.65
17 0.38 1.62
19 0.40 1.60
20 0.41 1.59
Basic Template: You can simply copy the basic template below and paste into another worksheet.
^Top You must also copy the table in A120:B138.
Range Control Chart
Average of sample ranges 0.046
Calculations:
Range
Average 0.046
Sample Range
20.05
30.06
40.04
50.05
Warning: UCL and LCL are calculated using the table in A120:C138.
10.03
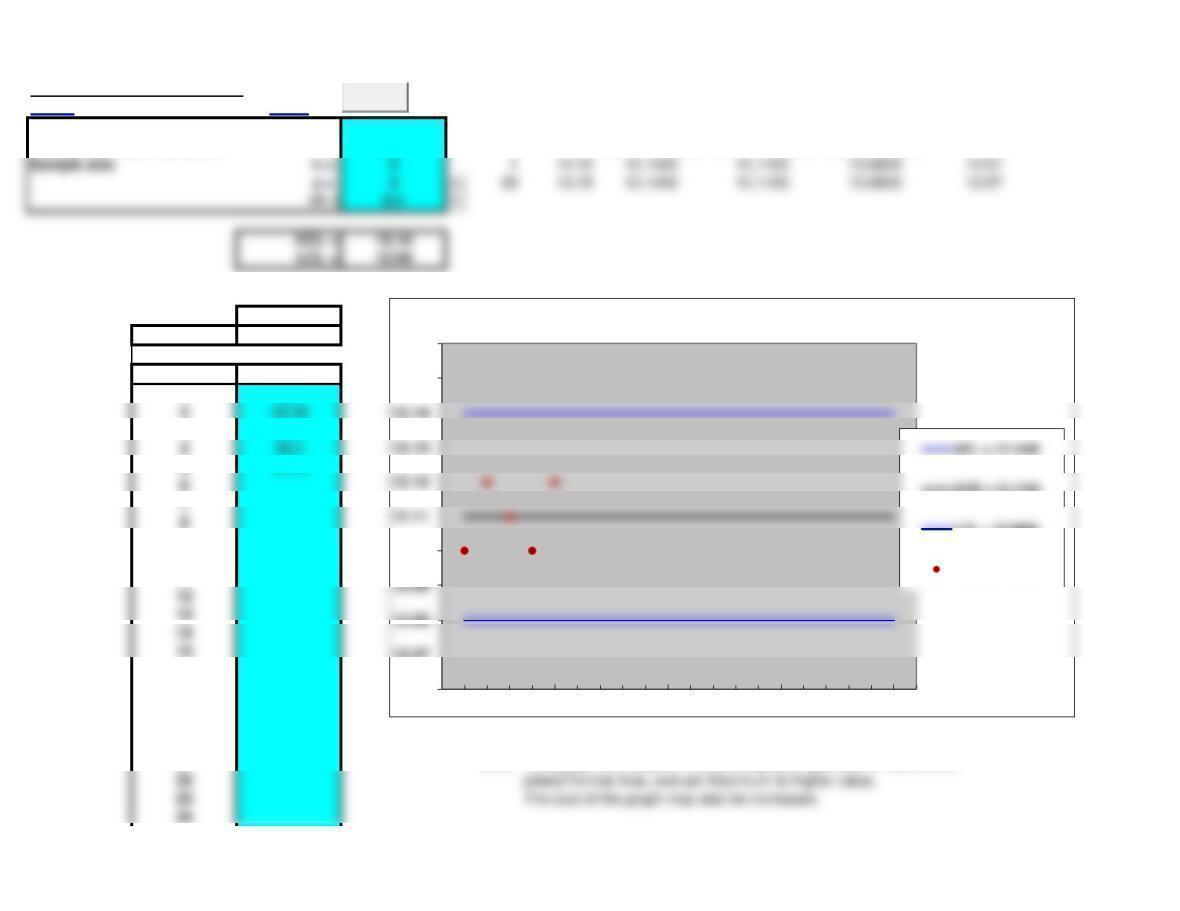
p-Chart Basic
<Back
Average proportion 0.11 UCL = 0.2039 AVE = 0.1100 LCL = 0.0161
LCL = 0.016133073
Calculations:
p
Average 0.11
Sample p
10.07
20.1
30.12
40.04
60.11
70.1
80.18
90.13
10 0.1
11 0.08
12 0.12
13 0.09
14 0.1
15 0.16
16 0.1
17 0.08
18 0.12
19 0.1
20 0.21
21 Note: To display more data on the above graph, right click on the x-axis,
22 select Format Axis, and set Maximum to higher value.
23 The size of the graph may also be increased.
24
0.00
0.05
0.15
0.25
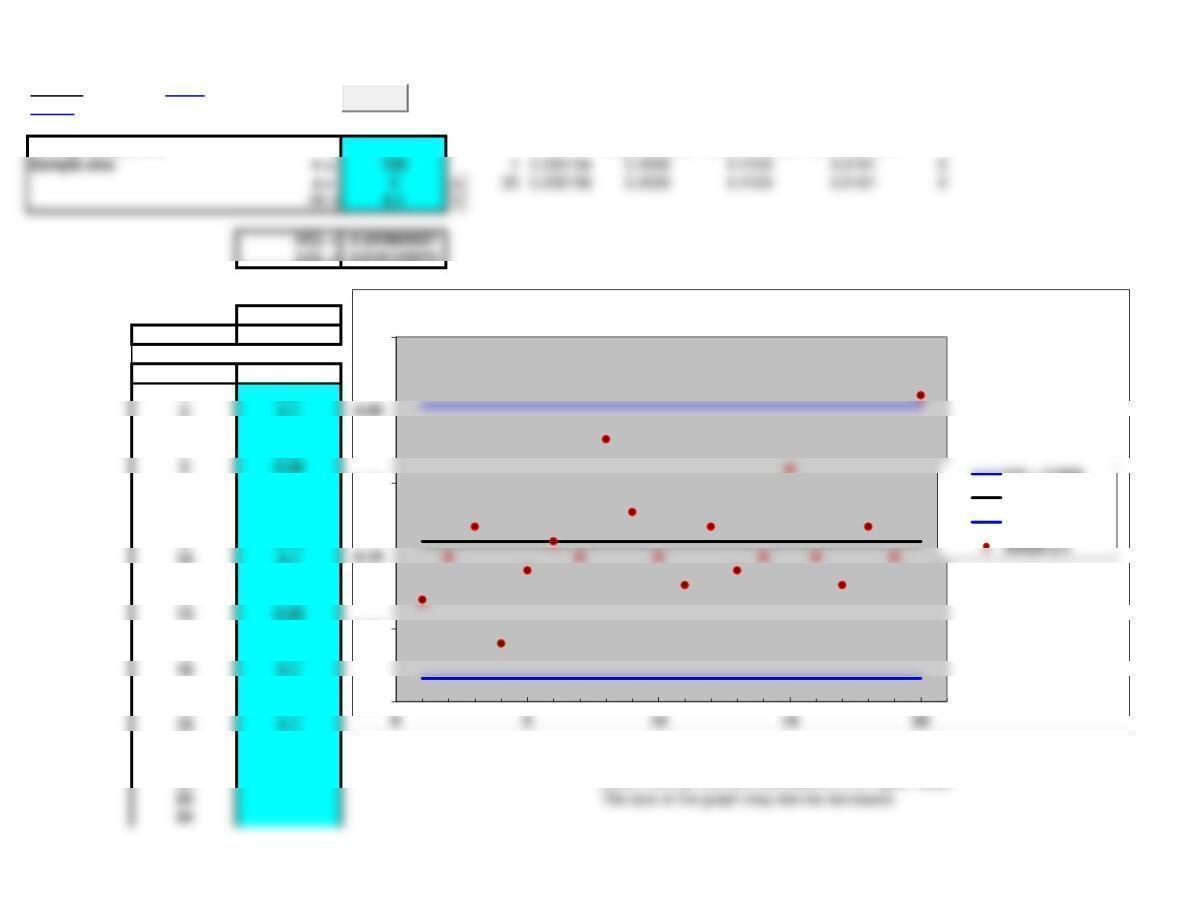
p-Chart
UCL = 0.2039
AVE = 0.1100
LCL = 0.0161
Clear
Sample size n = 100 10.235156 0.2039 0.1100 0.0161 0

35
36
37
38
39
40
41
42
43
44
45
46
47
48
49
50
51
52
53
54
55
57
58
59
60
61
62
63
64
25
26
27
28
29
30
31
32
33
34
65
66
67
68
69
80
81
82
83
84
85
86
87
88
89
90
91
92
93
94
95
96
97
98
99
100
70
71
72
73
74
75
76
77
78
79