Chapter 10 – Quality Control
10-1
CHAPTER 10
QUALITY CONTROL
Teaching Notes
As a result of increased global competition, a rapidly growing number of companies of all sizes are
paying much more attention to issues involving quality and productivity. Many statistical techniques are
available to assist organizations in improving the quality of their products and services. It is important for
companies to use these techniques in the context of an overall quality system (Total Quality Management)
which requires quality awareness, careful planning and commitment to quality at all levels of the
organization. Many companies are not only utilizing these statistical techniques themselves, but are also
Answers to Discussion and Review Questions
1. The elements in the control process are:
a. Define
2. Control charts are based on the premise that a process which is stable will reflect randomness:
statistics of samples taken from the process (means, number of defects, etc.) will conform to a
3. Control charts are used to judge whether the sample data reflects a change in the parameters (e.g.,
mean) of the process. This involves a yes/no decision and not an estimation of process
parameters.
5. a.
x
chart—A control chart used to monitor process variables by focusing on the central
tendency of a process.
Chapter 10 – Quality Control
10-2
c. p-chart—is a control chart for attributes, used to monitor the proportion of defectives in a
process.
d. c-chart—is a control chart for attributes, used to monitor the number of defects per unit.
6. A run is a sequence of observations with a given characteristic. Run tests are helpful in detecting
patterns in time series (e.g., control chart) data.
8. It is usually desirable to use both an up/down and a median run test on a given set of data because
9. No, there is always the possibility of a Beta or Type II error which is the probability of calling
10. Specifications are limits on the range of variation of output which are set by design (e.g.,
engineering, customers). Control limits are statistical bounds on a sampling distribution. They
11. The problem is that even when the machine is functioning as well as it can, unacceptable output
will result. Among the possible options that should be considered are:
a. Use 100 percent inspection to weed out the defectives. If destructive testing is required, this
may not be feasible.
d. Hope for a miracle.
12. a. This “problem” often goes undetected since there are no complaints from customers about
output not within specs. However, it is quite possible to realize decreased costs or more
profits by taking certain actions.
13. a. An optimum level of inspection is one where the cost and effort of inspection equals the
benefits derived from inspection, or the point (number of units inspected) at which the
marginal cost of inspection equals the marginal benefit from inspection.
Chapter 10 – Quality Control
10-3
b. Cost of product or service, volume, costs of inspection, cost of letting undetected defects slip
through, degree of human involvement, stability of process, and the number and size of lots.
14. Two basic assumptions that must be satisfied in order to use a process capability index are:
15. It is very important. The company’s (and manager’s) reputation is at stake, and there may be cost,
liability, legal and safety issues. Although the risks may differ substantially for different products
and services, ethical standards should be maintained “across the board.”
16. a. Type I error
b. Type II error
Taking Stock
1. a. In deciding whether to use 2-sigma or 3-sigma limits, the quality control people should be
involved as well as the accounting /record keeping personnel because it will be critical to
determine the cost of unnecessarily stopping the process vs. cost of not correcting a special
2. In setting the quality standards, customers should definitely be involved since they will ultimately
be using the product. In consultation with the upper management, the quality and production
departments should work as a team in establishing the quality standards.
3. The technology had a profound impact on quality. Improvement in measurement systems
Chapter 10 – Quality Control
10-4
4. respond to quality problems faster. Due to technological improvements in computerized design, the
Critical Thinking
1. If the analysis of the output of a process suggests that there is an unusual occurrence, but the
result of the investigation cannot pinpoint or determine the assignable causes, the limits may be
2. A single standard would be easier to work with, and everyone would know what the standard
was. Multiple standards might be used if the cost of errors differed significantly across products
3. Student answers will vary
Chapter 10 – Quality Control
10-5
Memo Writing Exercises
1. A p-chart is used to monitor the proportion of defective units generated by a process,
while an
x
chart is used to monitor the central tendency of a process (i.e. change in the
mean or the nominal value of a process). A p-chart classifies the observations into one
of two mutually exclusive categories (good vs. bad pass vs. fail, etc.). An
x
chart
2. In order to monitor the capability of the process to control the number of defective units,
we must first make sure that the special (assignable) causes of variation are eliminated
with the use of control charts. However, control charts will not pinpoint the cause of
defective units because the natural process variability may exceed the specification
limits (tolerances). In other words, even if a process is in control using control charts it
Additional Experiential Learning Exercises
Sampling Demonstrations. Bowls of colored beads (e.g., 1,000 beads, 40% white, 30% green,
20% red, 5% black, 3% yellow, etc.) are available with paddles that have indentations :that
facilitate quickly obtaining samples of various sizes. Use to demonstrate sampling variability –
take repeated small samples (or have a student do it) to demonstrate that different percentages of
a color appear in different samples. Then increase the sample size, focusing on a specific color,
and have students recognize that there is less variability (i.e., sampling variability distribution)
Process Control Demonstrations. Obtain 30 clear plastic “zipper” bags and an ample supply
of colored beads, marbles, or jelly beans.
a.
Place 10-20 beads/beans in each of 10 bags, focusing, say on red beads/beans. Number
the bags 1 to 10. Put 0, 1, or 2 red beads/beans in each bag, along with other colors of
beads/beans. Pass the bags out to the class and ask them what kind of control chart
Chapter 10 – Quality Control
10-6
would be appropriate (p-chart or c-chart). Then say, let’s suppose the red beads/beans
are defects, so we shall construct a c-chart. Have then report (in order), the number of
defects they have counted. Next, have the class calculate 2s control limits, and then see
Solutions
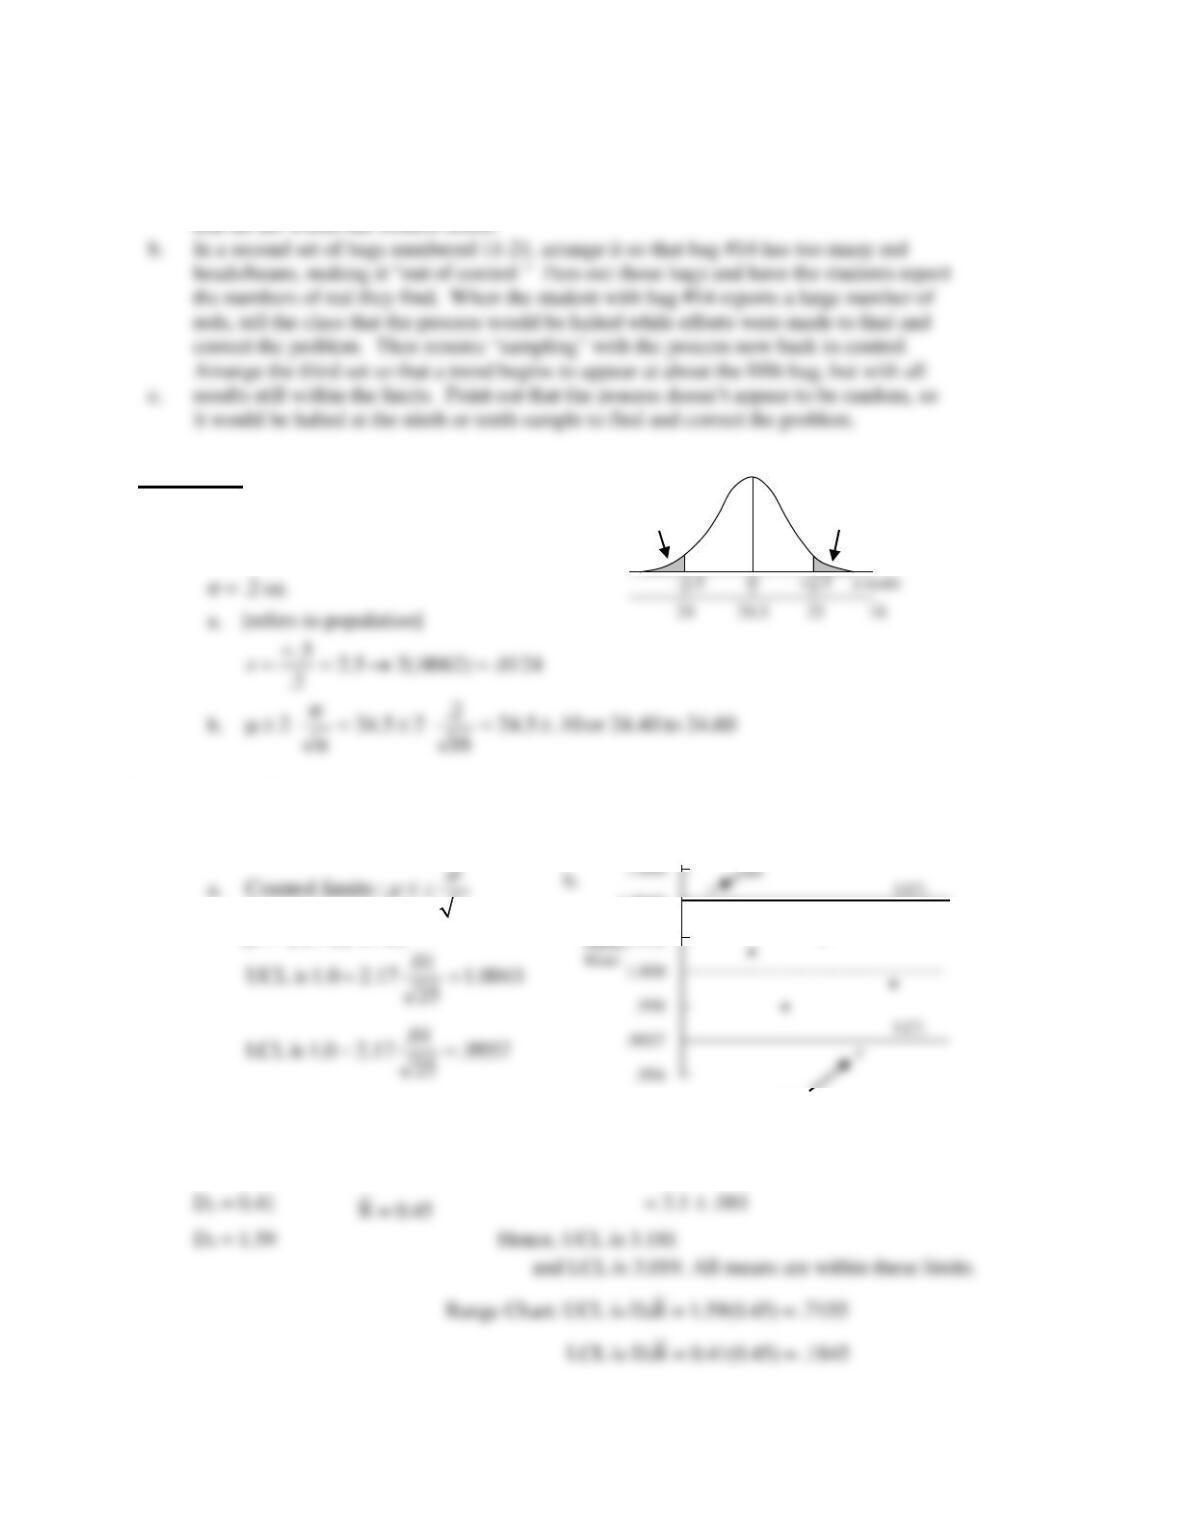
1. specs: 24 oz. to 25 oz.
= 24.5 oz. [assume = =
x ]
24 24.5 25 16
-2.5 0 +2.5 z-scale
2. = 1.0 liter
= .01 liter
n = 25
[z = 2.17 for 97%]
•
•
•
*
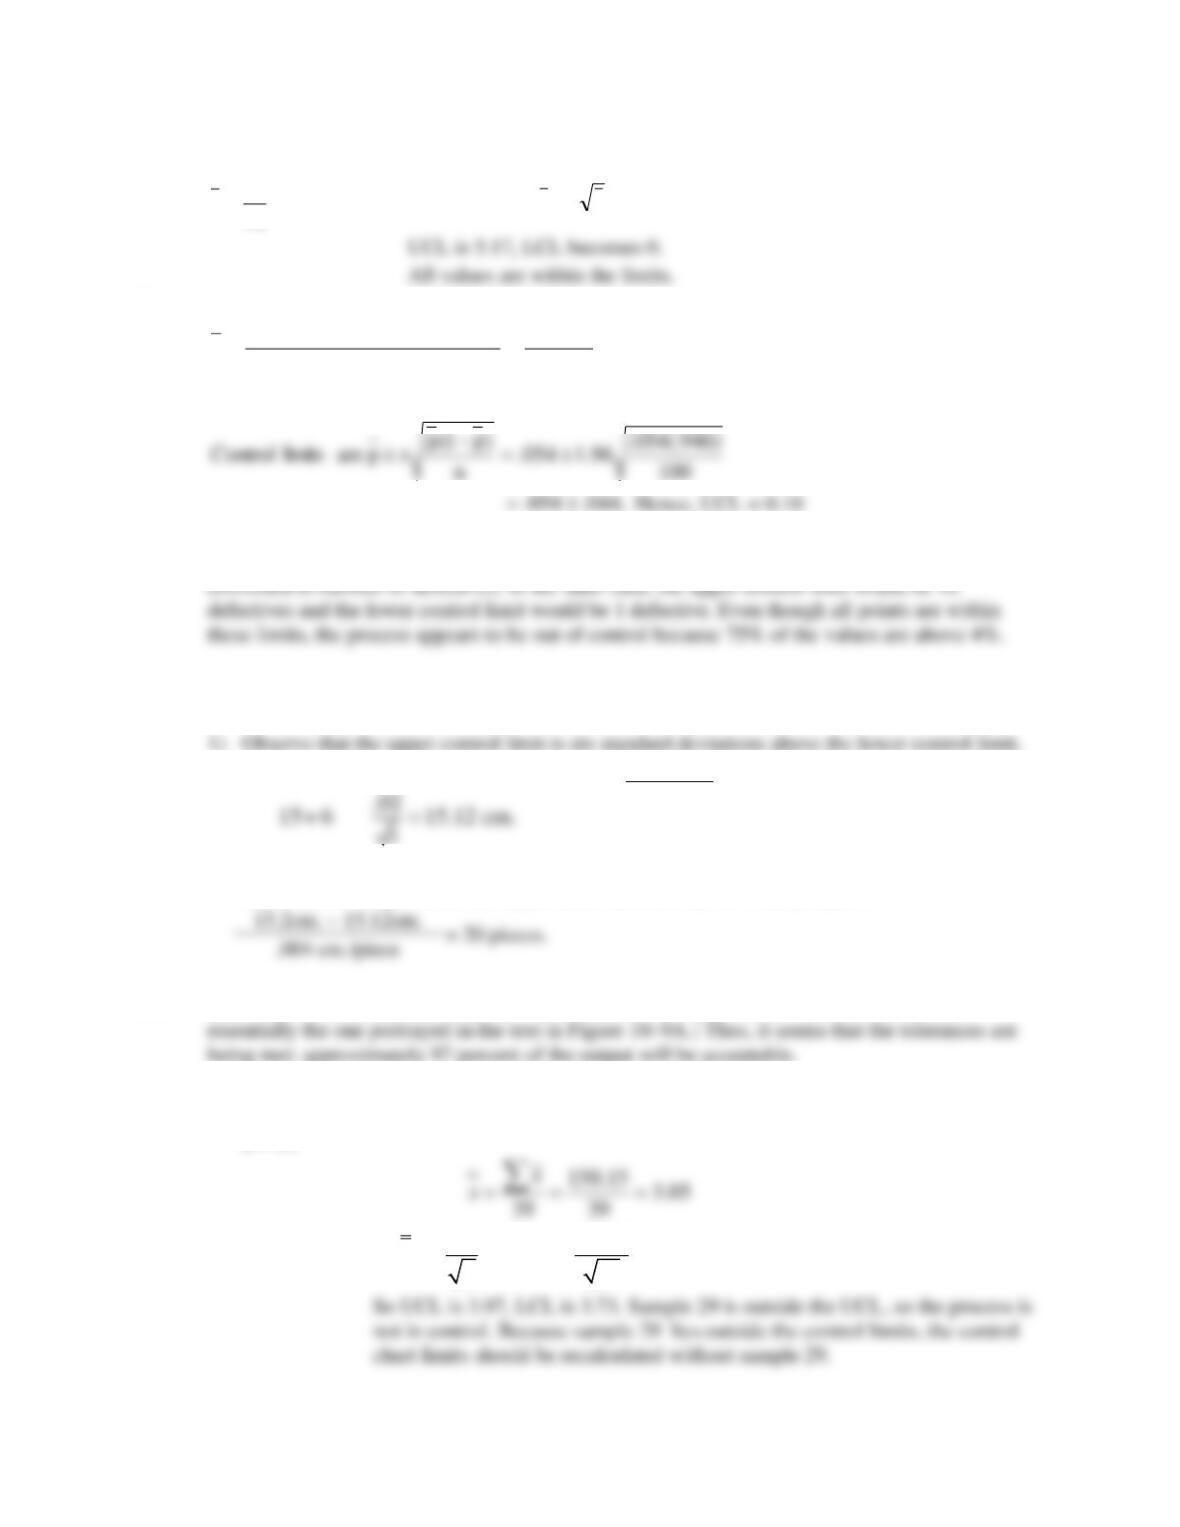
3. a.
n = 20
A2 = 0.18
=
X = 3.10 Mean Chart: =
X ± A2 −
R = 3.1 ± 0.18(0.45)
Hence, UCL is 3.181
and LCL is 3.019. All means are within these limits.
Range Chart: UCL is D4
.0062
.0062
1.0043
1.002
out
•
*
Chapter 10 – Quality Control
10-7
In control since all points are within these limits.
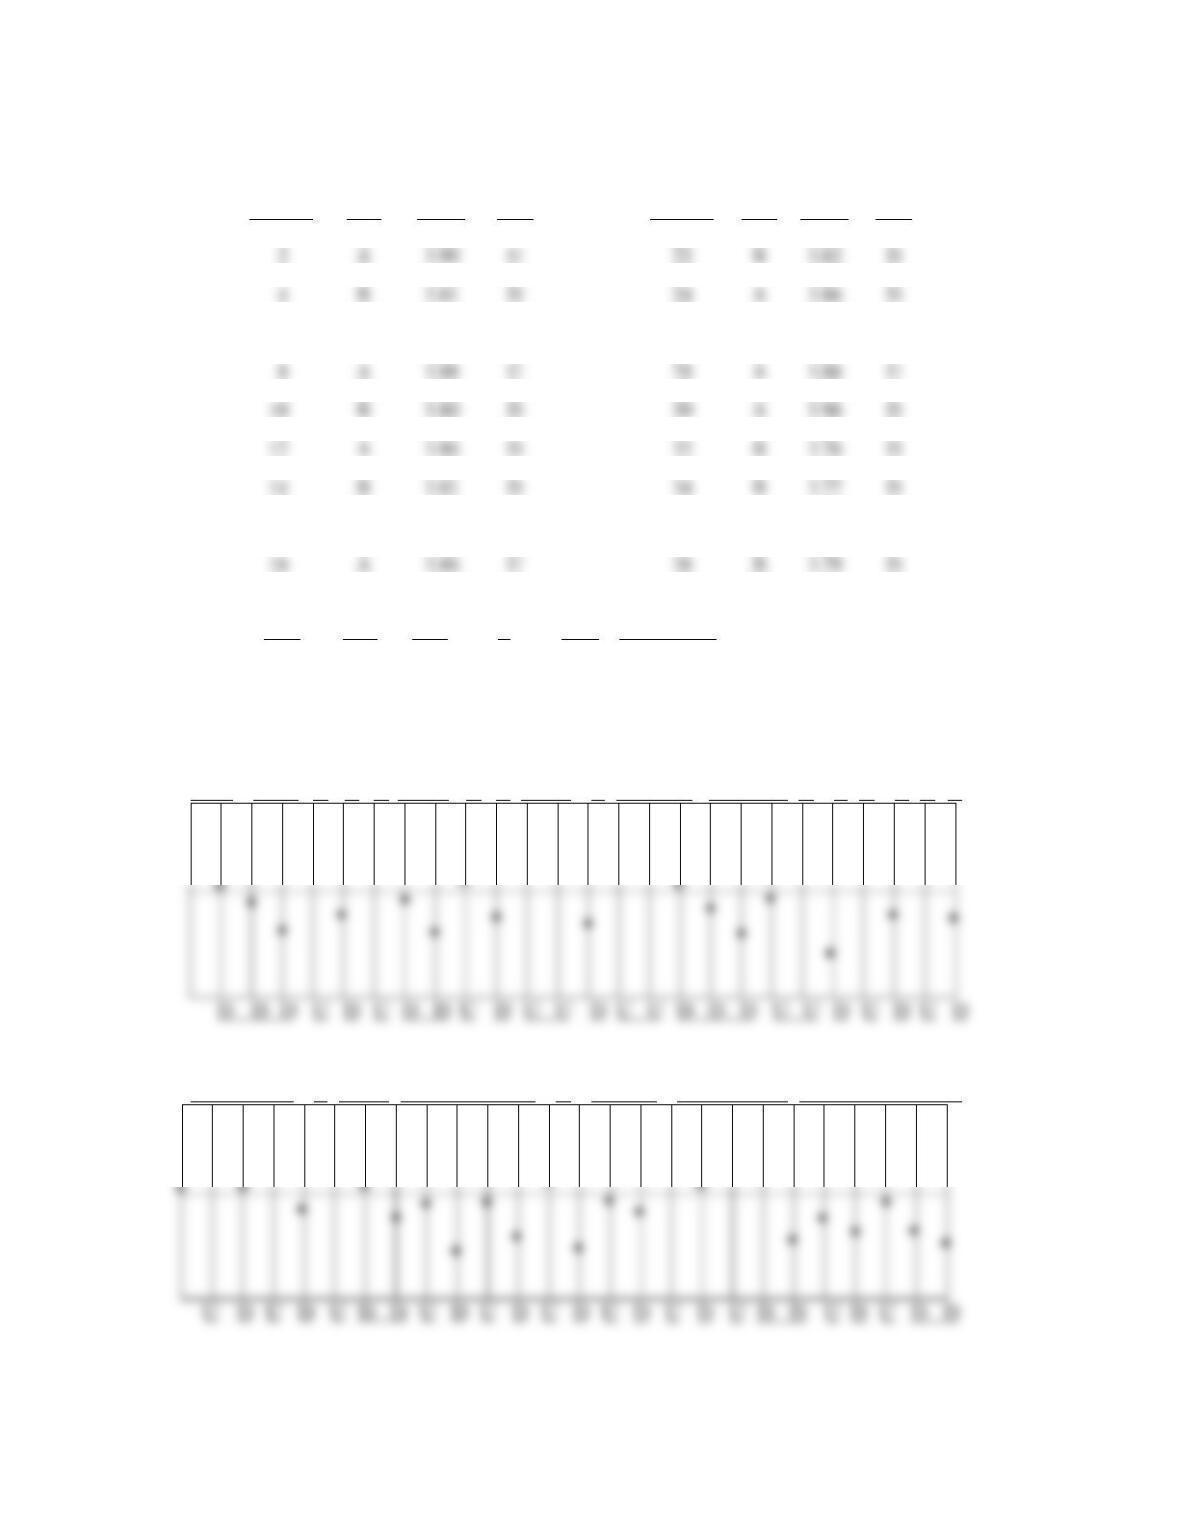
4.
Sample
Mean
Range
1
79.48
2.6
Mean Chart: =
X ± A2
−
R = 79.96 ± 0.58(1.87)
3
80.14
1.2
UCL = 81.04, LCL = 78.88
4
79.60
1.7
Range Chart: UCL = D4
5
80.02
2.0
LCL = D3
−
R = 0(1.87) = 0
5. n = 200
a.
1
2
3
4
.020
.010
.025
.045
b. (2.0 + 1.0 + 2.5 + 4.5)/4 = 2.5%
f. Yes.
g. mean = .02
.01] to[round 0099.
200
)98(.02.
dev. Std. ==
6. n = 200 Control Limits =
n
pp
p)1(
2−
Chapter 10 – Quality Control
10-8
Sample 10 is too large.
Chapter 10 – Quality Control
10-9
8.
5.1
14
21
c==
Control limits:
67.35.1c3c =
9.
054.
)100(16
87
nsobservatio ofnumber total
defectives ofnumber total
p
===
LCL = 0.01
Note that observations must be converted to fraction defective, or control limits must be
10. There are several slightly different ways to solve this problem. The most straightforward seems to
be the following:
2) Compute the value of the upper control limit at the start:
3) Determine how many pieces can be produced before the upper control limit just touches the
upper tolerance, given that the upper limit increases by .004 cm. per piece:
11. Out of the 30 observations, only one value exceeds the tolerances, or 3.3%. [This case is
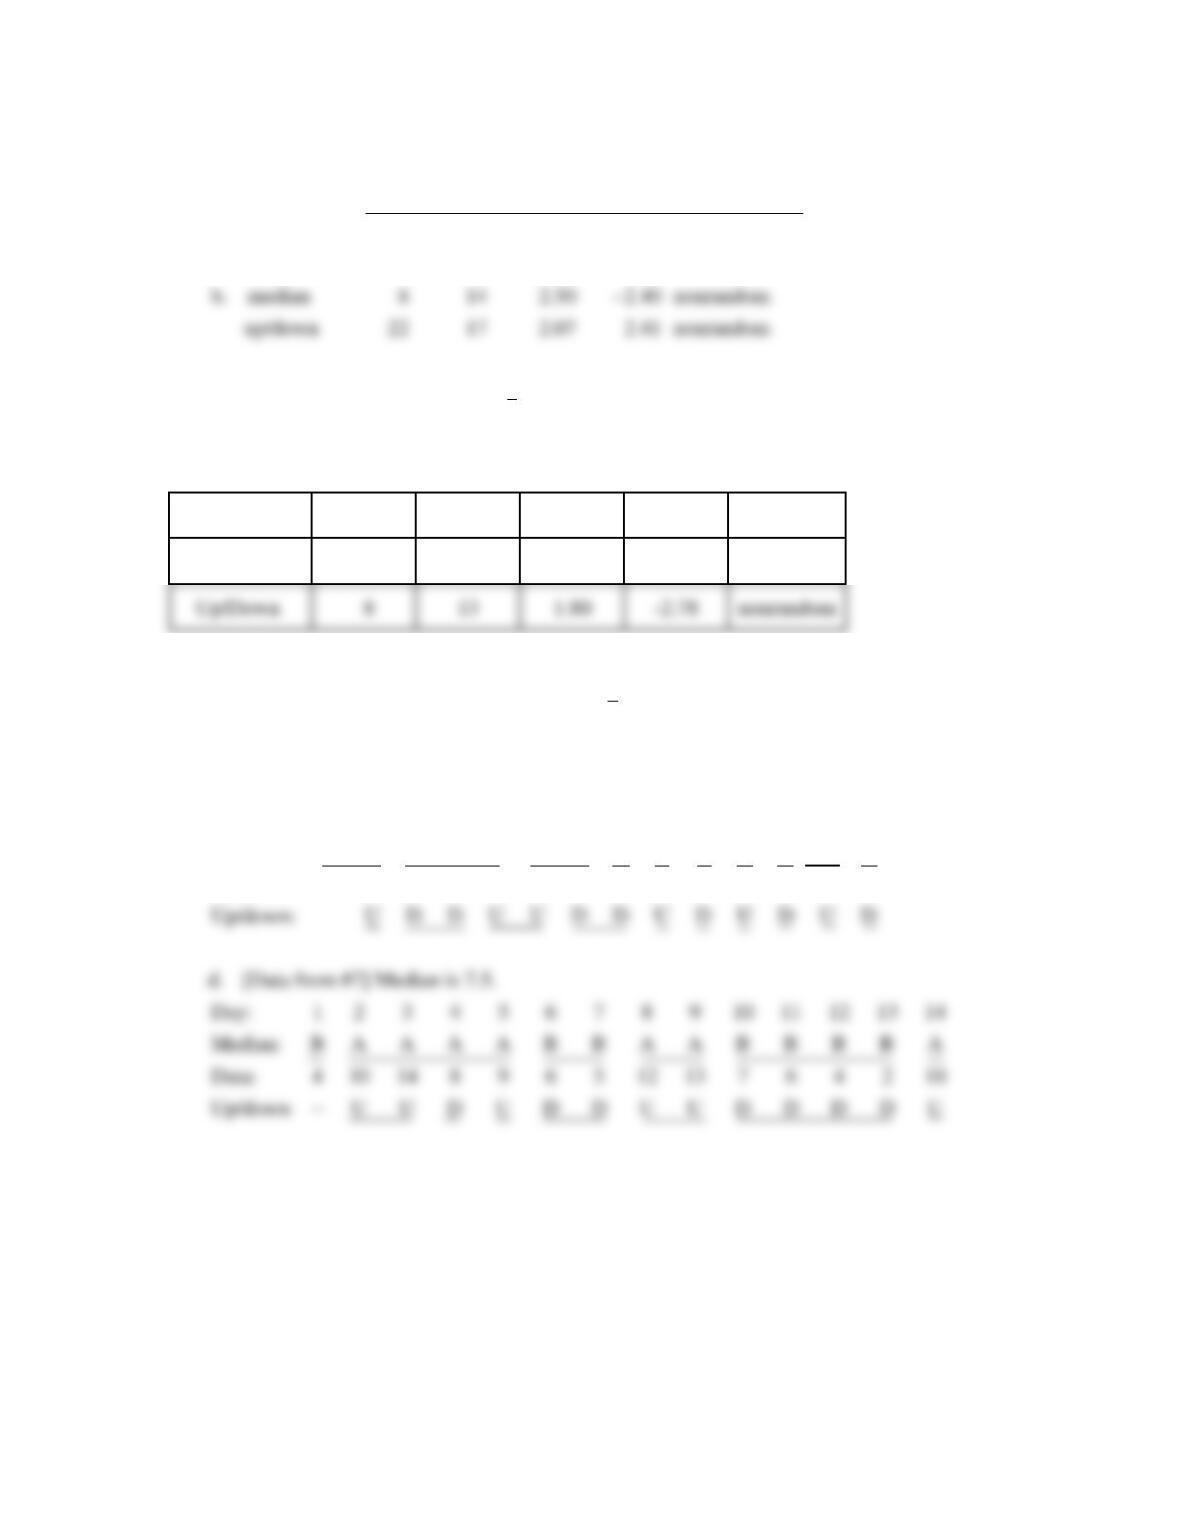
12. a. = .146
n = 14
Control limits are
0.146
3 .385 3 3.85 .117
14
xn
= =
Chapter 10 – Quality Control
10–10
b. [median is 3.85]
Sample
A/B
Mean
U/D
Sample
A/B
Mean
U/D
1
A
3.86
−
21
B
3.84
D
3
B
3.83
D
23
A
3.89
U
4
B
3.81
D
24
A
3.86
D
5
B
3.84
U
25
A
3.88
U
6
B
3.83
D
26
A
3.90
U
7
A
3.87
U
27
B
3.81
D
8
A
3.88
U
28
A
3.86
U
9
B
3.84
D
29
A
3.98
U
10
B
3.80
D
30
A
3.96
D
11
A
3.88
U
31
A
3.88
D
12
A
3.86
D
32
B
3.76
D
13
A
3.88
U
33
B
3.83
U
14
B
3.81
D
34
B
3.77
D
15
B
3.83
U
35
A
3.86
U
16
A
3.86
U
36
B
3.80
D
17
B
3.82
D
37
B
3.84
U
18
A
3.86
U
38
B
3.79
D
19
B
3.84
D
39
[B]
3.85
U
20
A
3.87
U
Test
obs.
exp.
Z
Conclusion
Median
18
20.5
3.08
–.81
random
Up/down
29
25.7
2.57
1.28
random
13. a.
A A B B A B A B B A B A A B A A A B B B A B A B A B
•
•
•
•
•
•
•
•
•
•
•
•
•
•
•
•
b.
A A A A B A A B B B B B A B B B A A A A B B B B B B
•
•
•
•
•
•
•
•
•
•
•
•
•
•
•
•
•
•
•
•
•
•
•
•
•
•
•
•
•
•
•
•
•
•
•
2
A
3.90
U
22
B
3.82
D
Chapter 10 – Quality Control
10–11
Summary:
obs.
exp.
z
Conclusion
a.
median
18
14
2.50
1.6
random
up/down
17
17
2.07
0.0
random
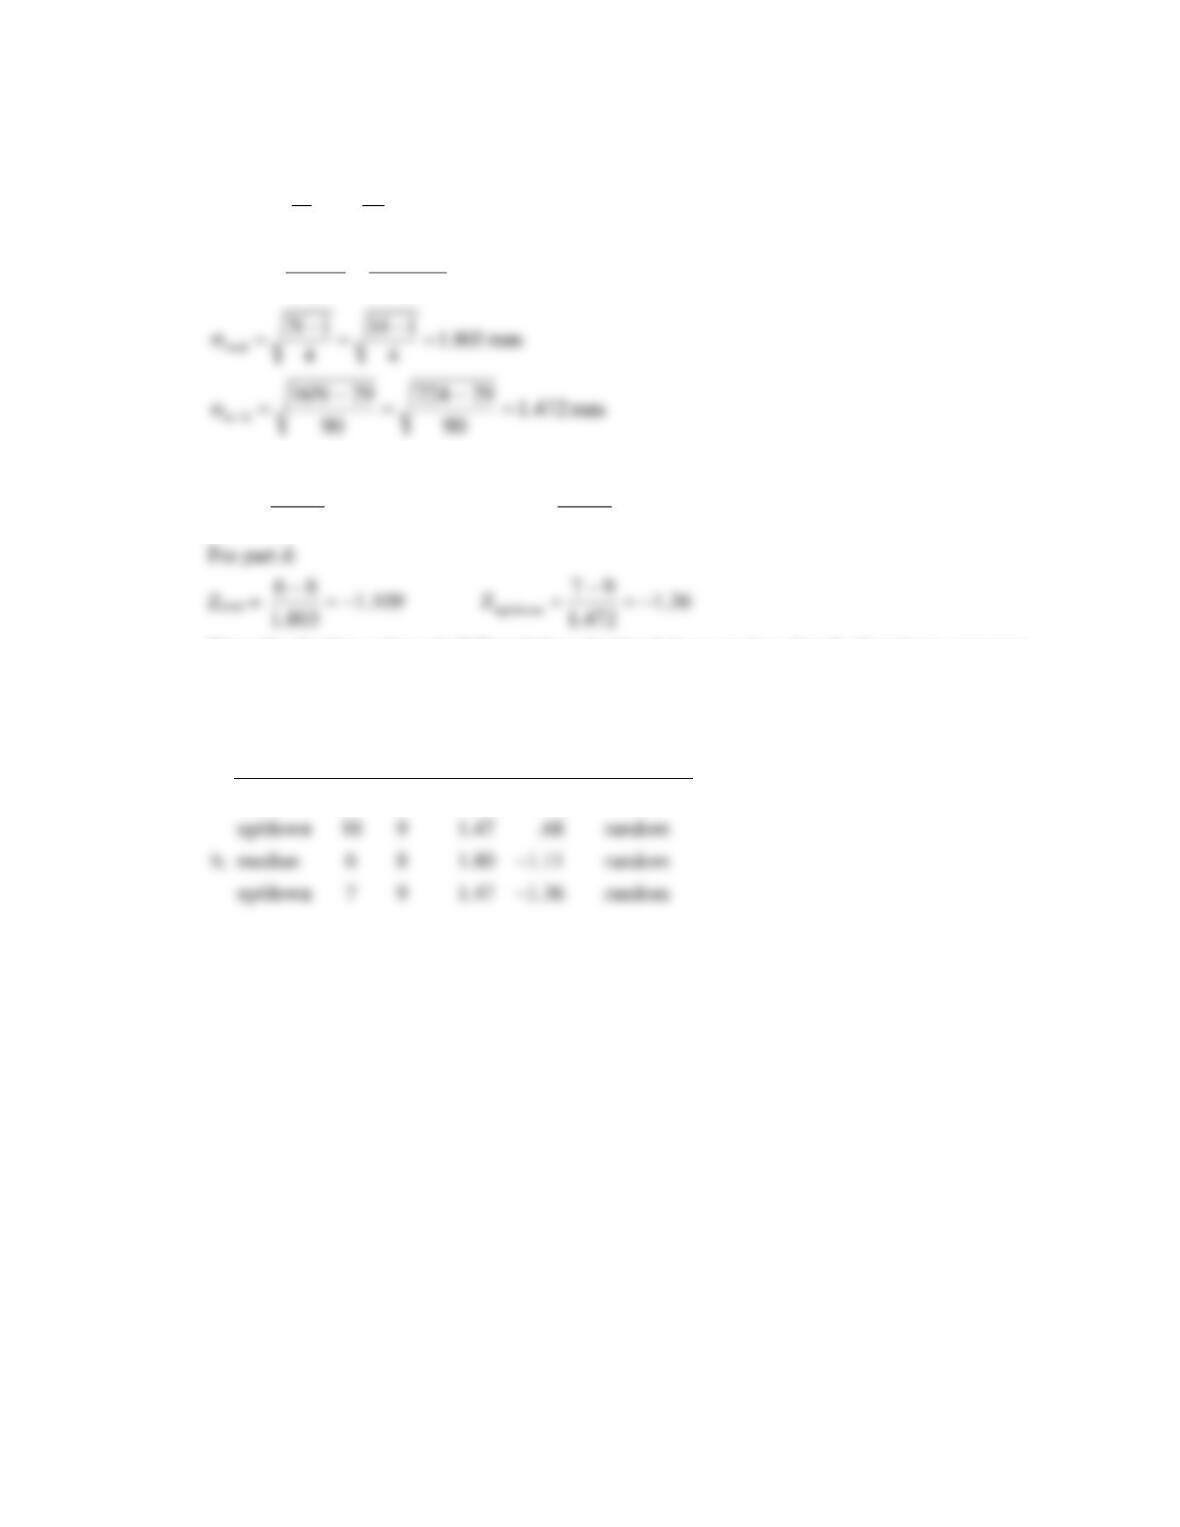
14. a. Because neither z-score exceeds +2.00, the process output is probably random.
b. N = 20
Test
r
expected
Std. dev.
z-score
Conclusion
Median
14
11
2.18
+1.38
random
Up/Down
13
1.80
nonrandom
Because the Up/Down test had a z-score outside of z = +2.00, the analyst can conclude the sequence is
probably nonrandom, so the process should be investigated for a possible assignable cause of variation.
c. [Data from Chapter 10, Problem 8]
Median is 1.5 A = Above, B = Below, U = Up, D = Down.
Sample:
1
2
3
4
5
6
7
8
9
10
11
12
13
14
Median:
A
A
B
B
B
A
A
B
A
B
A
B
A
B
Data:
2
3
1
0
1
3
2
0
2
1
3
1
2
0
Up/down:
U
D
D
U
U
D
D
U
D
U
D
U
D
Day:
Median:
B
A
A
A
A
B
B
A
A
B
B
B
B
A
Data:
10
14
12
13
10
b.
median
nonrandom
up/down
22
17
2.07
2.41
nonrandom
Chapter 10 – Quality Control
10–12
For part c and d:
E(r)med =
runs 81
2
14
1
2
N=+=+
E(r)u/d =
runs 9
3
1)14(2
3
1N2 =
−
=
−
For part c:
Zmed =
679.
472.1
910
Z 109.1
803.1
810
up/down =
−
==
−
Since the absolute values of all Z statistics calculated above are less than 2, all patterns appear to
be random.
Summary:
Test
obs.
Exp.
z
Conclusion
a.
median
10
8
1.80
1.11
random